Manitoba Keewatinowi Okimakanak (MKO) - Expense Claims
PDF Version (254 Kb, 8 Pages)
Table of contents
Background
- Indigenous and Northern Affairs Canada contracted KPMG to undertake a review of the former Grand Chief's expense claims following allegations with respect to potential misuse of MKO funds. His term of office ended September 2015.
- The review looked at all expenses incurred from April 1, 2012 to March 31, 2014. There were 358 expense claims, totaling $460,255.
- A comparison was made of expense claims and cell phone records to assist in the determination of the former Grand Chief's location related to the claims.
Findings: Claims by Type
- During the review, KPMG identified four types of form used to claim expenses.

Description of # of Claims by Type
Overview
The chart shows the number of claims by type, and their values, during the period reviewed. It shows that travel expenses represented almost two thirds of the total number of claims.
Values
Numerical values presented on the image:
| Type | # of Claims | Value of Claims |
|---|---|---|
| Cheque Requisition | 28 | $47,650 |
| Out of Pocket Expense | 77 | $66,573 |
| Travel Expense | 227 | $313,604 |
| Travel Authorization & Advance | 26 | $32,428 |
Presentation
The pie chart represents the number of each type of claim as a proportion of the total number of claims.
Findings: Timing of Payment of Travel Claims
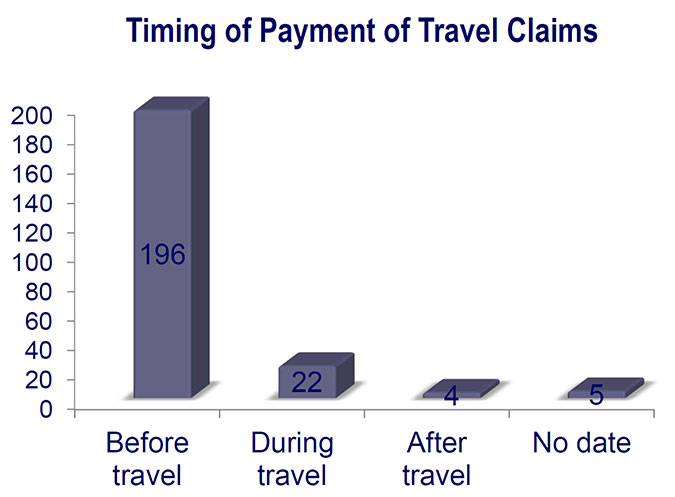
- Of the 358 claims reviewed, 227 were travel expense claims. KPMG noted that travel expense claims were often submitted before the travel actually occurred. The table below illustrates the timing of the issuance of cheques for travel claims.
Description of Timing of Payment of Travel Claims
Overview
The chart shows the timing of payment for travel claims during the period reviewed. It shows that the large majority of travel claims were submitted, and cheques issued for reimbursement, before travel occurred.
Values
Numerical values presented on the image:
| Timing | # of Claims |
|---|---|
| Before Travel | 196 |
| During Travel | 22 |
| After Travel | 4 |
| No Date | 5 |
Presentation
The bar chart represents the number of travel expense claims in four categories of timing. Travel claims for each timing category are represented using columns lined up horizontally, with heights indicating the number of claims.
Findings: Travel Expense Claim Form
The Travel Expense Claim Form requires three signatures:
- The traveler's
- Finance approval
- Political approval
The table below details the authorizations documented on the 227 travel claims reviewed
| # of Claims | % of Claims | ||
|---|---|---|---|
| No Signatures | 29 | 13% | |
| All Required Signatures | - | 0% | |
| Only Finance | 33 | 15% | |
| Only Political | 138 | 61% | |
| Only Former Grand Chief | 9 | 4% | 9% |
| Former Grand Chief and Finance | 6 | 3% | |
| Former Grand Chief and Political | 5 | 2% | |
| Finance and Political | 7 | 3% | |
| Total | 227 | 100% |
Findings: Travel Advances
- Travel advances totaling $24,100 were paid to the former Grand Chief during the period under review. The reasons for these advances were not clearly documented and often lacked approval. Per KPMG's review of expenses, it does not appear that advances were needed for travel because the former Grand Chief claimed per diems, mileage, and other expenses for each trip, often in advance.
Findings: Donations
- The former Grand Chief submitted expense claims totaling $6,529 for certain donations apparently made by him, and paid for by MKO. However, the documentation does not contain any evidence to indicate that these funds were provided to the intended parties. In other cases, the parties have not been named and no confirmation could be obtained.
Claims Reviewed Against Cell Phone Records
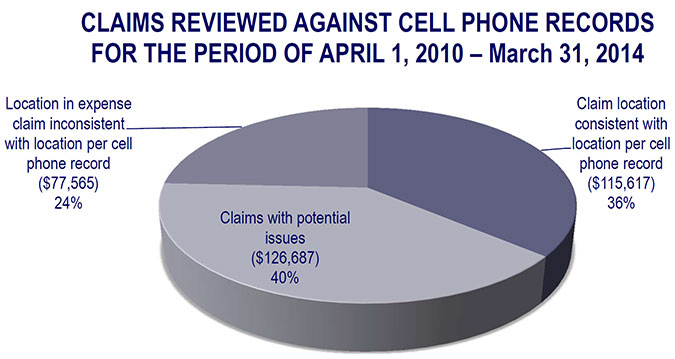
- KPMG obtained cell phone records relating to the period in question, for the cell phone provided to the former Grand Chief and paid for by MKO. The total value of mileage and per diem claims for which available cell phone records were analyzed relating to the period of review is $319,869.
Description of Claims Reviewed Against Cell Phone Records
Overview
The chart shows claims according to their consistency with cell phone records for the period reviewed. It shows that approximately three quarters of claims for which cell phone records were analyzed were either inconsistent or potentially inconsistent with the purported location of the expense.
Values
Numerical values presented on the image:
| Type | Value of Claims | Percentage of Total |
|---|---|---|
| Claim location consistent with location per cell phone record | $115,617 | 36% |
| Claims with potential issues | $126,687 | 40% |
| Location in expense claim inconsistent with location per cell phone record | $77,565 | 24% |
Presentation
The pie chart represents the value of claims that were inconsistent, potentially inconsistent, or consistent with cell phone records, as a proportion of the total value of claims for which cell phone records were analyzed.Conclusion
- The former Grand Chief was asked to verify the facts on a number of occasions in 2015, after providing him with a draft of the report on July 15, 2015.
- A report-out to the Grand Chief and Chiefs in General Assembly took place in April, 2016 in Thompson, Manitoba, involving the Associate Regional Director General Manitoba Region and officials invited by both parties.
- Following a discussion of the findings of the audit, a total of $85,723 was agreed upon as recoverable from funding provided to MKO.
- The Grand Chief is in regular contact with INAC and a recovery period will be established for repayment with Manitoba Region INAC.