
Archived - Thematic Indicators Project
Archived information
This Web page has been archived on the Web. Archived information is provided for reference, research or record keeping purposes. It is not subject to the Government of Canada Web Standards and has not been altered or updated since it was archived. Please contact us to request a format other than those available.
Date: September 2009
PDF Version (499 Kb, 145 Pages)
Table of Contents
- Foreword
- Executive Summary
- 1. Introduction & Background
- 2. Overview and Scope
- 3. Research Approach
- 4. Methodology
- 5. Thematic Chapters
- 6. Health and Well-Being
- 7. Environment
- 8. Education
- 9. Economy
- 10. Governance
- 11. Infrastructure
- 12. Mapping of the Indicators to the PAA
- 13. Conclusion & Recommendations
- Appendix A - List of Indicators
- Bibliography
Foreword
The creation of sound measures to track the performance of programs at the Department of Indian and Northern Affairs Canada (INAC) is critical to developing programs that reflect the vision of Aboriginal and northern people and remain responsive to the needs of Aboriginal and northern communities. Measurement of success in these programs must move past a review of the activities of the Department, to pursue the impacts of these activities in numerous contexts. The purpose of the Thematic Indicators Project is to assist the Department in its move towards performance measurement that considers broader program outcomes among Aboriginal and northern people.
The Project is the product of a four-month summer internship based out of the Audit and Evaluation Sector that brought together eight Master's-level students from universities across the country. In addition to their work on this project, the interns were placed in INAC sectors to offer exposure to a variety of work experiences and to provide a firsthand understanding of the work of the Department. The Project builds on findings identified in a special study on Results-based Management Accountability Frameworks (RMAFs) conducted by the first cohort of INAC evaluation interns over the summer of 2008.
The approach taken to the Project was to connect the specific performance measurement needs of the Department with what matters most at the community level. The result is a discussion of indicators in six thematic areas drawn from a broad review of literature and performance measurement in other jurisdictions. The interns consulted INAC sectors, other federal departments, provincial governments and Aboriginal and community organizations to identify performance measurement needs at multiple levels among various stakeholder groups and to build on and complement work already underway.
The Thematic Indicators Project is primarily intended to guide INAC programs when developing performance measurement strategies. The report does not propose a set of prescriptive indicators, but rather encourages a shift in thinking about the purpose and spirit of performance measurement. It is hoped that the report will find use with other federal departments, various levels of government and those working diligently to measure progress at the community-level.
Nicole Kennedy
Director of Evaluation, Performance Measurement and Review,
Indian and Northern Affairs Canada
Executive Summary
Introduction
The development and use of appropriate indicators is essential for greater accountability, program improvement and evidence-based decision making. Performance measurement plays a key role in monitoring and assessing the impacts of programs and is necessary for future evaluation work. In the past decade, evaluations have consistently identified that a lack of performance data has undermined the capacity of the Department of Indian and Northern Affairs Canada (INAC) to undertake meaningful evaluative work. The Thematic Indicators Project, a research project produced by INAC's Audit and Evaluation Sector, is designed to inform the development of Performance Measurement Strategies (PM Strategies) and encourage the development of indictors that consider broader outcomes in Aboriginal and northern communities
This report identifies key performance indicators across six thematic areas that represent the broad scope of INAC's mandate: Health and Well-being; Environment; Education; Economy; Governance; and Infrastructure. Ultimately, this framework contributes to the measurement of INAC's vision of a future in which First Nations, Inuit, Métis and northern communities are healthy, safe, self-sufficient and prosperous.
Key Findings
Thematic Areas – Pillars of a Strong Community
A key finding that emerged early in the research was the need to take a holistic community-level approach to the selection of indicators. The project is organized around six thematic areas, each of which represents a critical area of inquiry when developing an understanding of healthy, safe, self-sufficient, and prosperous Aboriginal and northern communities. The reader is encouraged to consult Canada's Aboriginal Women: Assessing the Issues, also recently completed by INAC's Audit and Evaluation sector for ideas on how to apply a gender-based approach to these thematic areas.
Health and Well-being
Fundamentally, community well-being depends on the
physical, mental and emotional health and well-being of individual
community members. Health can also be affected by, and in turn affect
the environment, culture, family and community. The multiple facets
of individual and community development contributing to health and
well-being means that developing performance measures to satisfy
these elements is a complex and challenging task. In order to demonstrate
the relationship between program activities and community health
outcomes, health status indicators such as physical and mental health
as well as indicators that measure both the social and environmental
determinants on health such as living and working conditions, child
development and poverty are considered.
Environment
Social, cultural, and historical features of Aboriginal and northern
communities are closely tied to the land and environment. A bountiful environment
provides sustainable food production and other essential contributors of
good health. The Environment chapter draws on select quantitative and qualitative
indicators in order to measure the complex relationship the environment
shares with communities' economic, social and political processes.
Many of the environmental indicators presented are quantitative. These
indicators provide a comparable, reliable and valid description of the
health of the environment. In contrast, the remaining indicators are qualitative
and prescriptive in nature, addressing the quality of environmental management.
Together, the collection of environmental indicators creates a comparable
and reliable yet detailed picture of environmental success in Aboriginal
and northern communities.
Education
Education is intricately linked with other areas of well‑being as it prepares Aboriginal and northern people for new opportunities that will result in an increased standard of living and overall community well-being. Research on Aboriginal perspectives on learning provides a holistic lens from
which to examine the development of a successful education system. This lens
views education as lifelong, experiential and spiritual process, rooted in
traditional language and culture, and supported at the community level. A goal
of the proposed indicators is to illustrate the importance of formal and experiential
learning. The indicators focus on measures of those aspects of learning, which
prepare the individual from the beginning of their development to a self-sufficient
and participating member of society.
Economy
The socio-economic conditions in Aboriginal and northern communities
are highly complex and continue to undergo significant change. Today, Aboriginal
and northern communities are increasingly identifying and participating
in economic activities that, given adequate capacity, could provide sustainable
means for diverse cultures to flourish in Canada's dynamic economic
environment. The approach taken to economic development in this chapter
focuses on the entire economic policy story in Aboriginal communities from
the initial economic action plan through to long term growth and sustainability.
Indicators have been selected for their ability to measure the direct and
indirect factors affecting the economy.
Governance
As Aboriginal communities in Canada continue to grow, the need for strong Aboriginal governance structures that have the capacity to bring individual and community well-being to parity with other Canadians becomes
more pressing. The links between governance and social development in the areas
of health, economy, environment, education and infrastructure in Aboriginal
communities are well documented in the governance literature.Throughout the
research, we identified four sub-categories of governance activities that provide
a general scope for this broad thematic area: Principles of Good Governance;
Strong Institutions of Government; Self Government Agreements; and Strong Intergovernmental Relationships. Together, the categories provided us with a platform for selecting indicators that can assist INAC officials in understanding the governance capacity
of Aboriginal communities.
Infrastructure
The thematic area of infrastructure
was chosen as a contextual enabler of broader outcomes relating to health and
well-being, general social health, and economic opportunities. The indicators
discussed have been chosen for their ability to monitor outcomes that directly
relate to key issues of infrastructure in Aboriginal and northern communities.
The research presented few indicators that allow for an assessment of the general
state of infrastructure. While there are many operational and technical measures
for various infrastructures, few are direct indicators of higher-level performance
and outcomes.
Headline Indicators
A list of key or headline indicators with descriptions can be found in Annex A to the full report. Following the screening of hundreds of indicators discovered in the research, a broad list of twenty to fifty indicators was developed for each thematic area. The research group then discussed which of these were most applicable to the Department and to the issues facing Aboriginal and northern communities. This process arrived at a list of ten to fifteen headline indicators in each thematic area.
Indicators Mapping and Synthesis
INAC's Program Activity Architecture (PAA) was chosen as a framework of reference to depict the ways in which the selected indicators can currently be used to measure the progress of program activities toward their stated objectives and ultimately, toward the Department's Strategic Outcomes (SOs). In order to assess the applicability of indicators across INAC's current program areas, a mapping exercise was conducted to determine the relevancy of selected indicators in each of the thematic areas to the PAA. The purpose of this exercise was twofold:
- To determine the usefulness of selected indicators to INAC's
program areas; and
- To identify indicators that have broad application across program areas in the Department.
The mapping process involved aligning the top indicators in each thematic area with SO and Program Area (PA) levels of the PAA. To this end, the project team primarily consulted INAC's 2009-10 PAA element description and the 2009-10 Performance Measurement Framework. Indicators that cut across SO areas may be considered as central to the measurement of the Department's ultimate outcomes. The following is a synopsis of the relationships between these indicators and the PAA.
Chart 1 outlines the frequency of the headline indicators from each thematic area across the PAA. The chart shows the number of indicators from each thematic area that were aligned with indicators that could can be used to measure activities within each SO. For instance, indicators from the economy thematic area were linked to various program areas across the PAA a total of 20 times. The full report provides greater detail in the relationship between the headline indicators and departmental programming.Frequency of Headline Indicators across the PAA
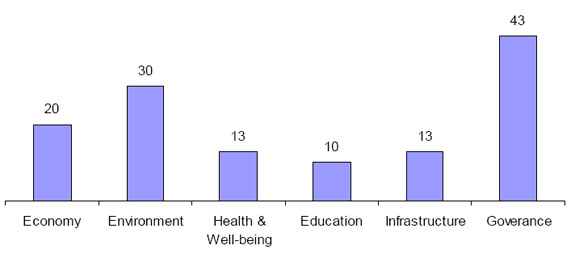
Chart 1 outlines the frequency of the headline indicators from each thematic area across the PAA. The chart shows the number of indicators from each thematic area that were aligned with indicators that could can be used to measure activities within each SO. The chart shows the following frequencies for each SO: Economy: 20; Environment: 30; Health & Well-being: 13; Education: 10; Infrastructure: 13; Governance: 43.
The mapping exercise revealed that indicators for the thematic areas of Governance and the Environment surfaced most often, suggesting that the Department can benefit from integrating indicators outlined in these Thematic Chapters into multiple levels of departmental performance measurement initiatives. For example, the Governance indicator that found the highest degree of relevancy across SOs was "intergovernmental relationships" – the extent that Aboriginal communities and other stakeholders are making a joint commitment to strengthen community well-being. This indicator appeared eleven times and at least once in every SO. Likewise, the Environment indicator that found the highest degree of relevancy across the SOs was the "environmental risk management" indicator which appeared seven times and was relevant for every program activity under the Land SO. This indicator measures the extent to which communities are engaged in planning to mitigate environmental vulnerability.
The headline indicators for the thematic areas of Health and Well-being and Education did not appear as frequently as one might expect, suggesting that these indicators exceed the scope and mandate of INAC's activities. Despite not being directly linked to the PAA, attention should still be given to these indicators as they reveal important points of analysis when measuring cross-cutting issues.
Recommendations
To a large extent, the selected indicators are outcome-oriented, enabling analysis that goes beyond activities and outputs to focus on comprehensive issues and needs specific to Aboriginal and northern communities. Focusing on what is meaningful for measurement at the community-level, however, is a multi-faceted and challenging task. The diversity of Aboriginal and northern communities across Canada limits the extent to which performance information can capture the unique and complex condition of each community. The literature generally agrees on a number of factors to consider when designing a culturally-relevant performance measurement plan. Drawing from this knowledge, this report provides a starting point for the further development of indicators that meet individual community needs while simultaneously addressing the broader performance measurement goals of government.
Research for this project reveals several challenges and opportunities for the Department to consider in pursuit of meaningful and effective performance measurement. The recommendations which follow set out important steps that individual programs and the Department as a whole can take in this direction.
Recommendation 1: Differentiate between indicators related to community well-being and program success
The dual goal of the research has been to provide a list of indicators applicable both to Aboriginal / northern communities and departmental programs, which together contribute to an understanding of the Department's role in achieving outcomes at the community-level. This has meant that some indicators relate to the general well-being of communities, while others may be better suited to measuring program performance. Measures of program performance can be used to measure immediate outcomes, while measures of community well-being can be used to measure intermediate and long-term success. Differentiating between these two types of indicators contributes to an understanding of attribution between program activities and outputs and community outcomes.
Recommendation 2: Engage communities and other stakeholders in a culturally appropriate manner that integrates gender-based perspectives in developing performance measures.
Developing performance measurement indicators that are relevant at the community level requires extensive consultation with Aboriginal and northern communities to ensure that the proposed indicators and measures have meaning for the community, are appropriate to culture and gender, and are rooted in the vision Aboriginal and northern peoples have for their communities. Importantly, this requires engaging community members that represent the many different groups in a community including men, women, elders, youth and others. Attempts to collect data in Aboriginal communities should also be sensitive to the community's principles of research and data collection. One example are the principles of Aboriginal ownership, control, access, and possession of information (OCAP).
In addition, performance measurement requires consultation and partnership with other stakeholders, namely other federal departments and governments that are working toward similar outcomes. Preliminary contact made with external stakeholders during this project revealed that there are similar efforts in indicator work underway, offering opportunities for sharing of best practices, harmonizing data collection, and ultimately, creating more sophisticated performance measurement systems.
Recommendation 3: Continue to work towards harmonized data collection
The shortage of data sources focusing on Aboriginal people, within and outside the Department, makes collecting information on a number of the indicators selected for this study costly, time-consuming and in some cases unfeasible, despite their relevance at the community level. Existing data are often unable to be disaggregated to analyze the broad spectrum of variables contributing to the well-being of individual Aboriginal and northern communities. The research also found evidence of increasing data collection and indicator work already underway in Aboriginal and northern communities. While this demonstrates a growing commitment to performance-based programming, it also increases the reporting demand on individual communities.
In some cases, the same or similar data is currently being collected by multiple sources. The fact that these and other organizations share similar outcomes and goals further demonstrates the need to harmonize data collection. Coordinated collection between the federal government, other levels of government and Aboriginal/community organizations, would reduce the reporting burden. In addition to benefiting communities, increased coordination of data collection would decrease the time and cost that data collection agencies and communities face.
Recommendation 4: Develop community-based targets
Few of the indicators reviewed in this report have included targets to assess substantive progress in Aboriginal and northern communities. For the most part, the selected indicators use benchmarks to define progress as an increase of parity between Aboriginals and non-Aboriginal populations. While this approach illustrates Aboriginal community well-being in relation to national standards, it comes at the cost of observing progress from the perspective of the community itself. To gain a better understanding of community well-being, the Department should engage communities in developing benchmarks that reflect their goals and aspirations, enabling analysis of a single community's progress over time.
Recommendation 5: Pursue measurement strategies that focus on building capacity
The research identified a strong relationship between community capacity and the achievement of outcomes. However, few indicators exist for measuring the state of capacity across multiple thematic areas. The literature indicates that capacity is a function of a range of variables contributing to community well-being. In an effort to draw attention to community capacity, this report has emphasized the relationships between these variables as they surface in each Thematic Chapter. Users of this report are encouraged to adopt a holistic approach to performance measurement to capture the broad factors contributing to community capacity. Similarly, the Department is advised to continue to work towards developing programming that cuts across outcome areas to address the many unique needs of communities.
Recommendation 6: Continue the pursuit of outcome-based indicators
A major focus of this report has been to help address the shortage of outcome-oriented indicators in the Department. A key consideration in the selection of indicators has been to identify those that go beyond descriptive measures of departmental activities to include the longer-term impacts of programs. Other selected indicators roll-up operational-level data to provide an understanding of the performance of community systems, such as various types of infrastructure. Collecting performance data on outcome indicators may necessitate engaging program recipients in continuous dialogue regarding the cumulative effects of programs.
1. Introduction & Background
The development and use of appropriate indicators is essential for greater accountability, program improvement and evidence-based decision-making. Performance measurement plays a key role in monitoring and assessing the impacts of programs and is necessary for future evaluation work. In the past decade, evaluations have consistently identified that a lack of performance data has undermined the capacity of the Department of Indian and Northern Affairs Canada (INAC) to undertake meaningful evaluative work. This same issue has been observed in the recent Management Accountability Framework assessment which recommended that INAC "continue work enhancing availability of sound performance data to support improvements in quality of evaluations and development of multiple lines of evidence."
A 2008 study of 59 INAC Result-based Management Accountability Frameworks (RMAF) revealed that while the Department's RMAFs were generally of good quality, measurement of program performance has been limited to focusing on expenditures and output indicators rather than outcomes or expected results. Moreover, implementation and data collection gaps have contributed to a lack of performance data and a rigorous measurement / data collection strategy.
The Thematic Indicators Project, produced by the Audit and Evaluation Sector at Indian and Northern Affairs (INAC), is designed to provide a substantive tool for programs in the selection of indicators during the development of Performance Measurement Strategies (PM Strategies). Given the broad scope of the project, it is also hoped that other federal departments and agencies and others working to achieve community-level outcomes will benefit from this information when developing performance measurement plans.
2. Overview and Scope
Policy and program work conducted by INAC is embedded within complex historical and present day challenges. Specific social, cultural and historical contexts impact program development, implementation and eventual outcomes. Developing culturally relevant and meaningful indicators that truly reflect the programs and communities they serve is a challenging task.
Given the breadth and complexity of INAC programming and the Department's broad mandate, the researchers undertook a national and international scan of indicators in the following six key thematic areas: Health and well-being, Environment, Education, Economy, Governance and Infrastructure. Most importantly, key indicators have been selected to address needs and issues relevant to Aboriginal and northern communities. Analysis, in turn, focuses on how success is defined at the community level in each of the thematic areas of analysis. Together, the full set of indicators in each of the following thematic areas is intended to offer a broad reflection of the many elements associated with a flourishing community. Finally, the selected indicators were mapped to INAC programming via the Department's Program Activity Architecture (PAA). The reader is encouraged to consult the complimentary report to this project, Canada's Aboriginal Women: Assessing the Issues – also prepared by the Audit and Evaluation Sector – for ideas on how to apply a gender-based approach to the thematic areas covered in this paper.
Health & Well-being
Fundamentally, community well-being depends on the physical, mental and emotional health and well-being of individual community members. Orientation toward local health issues is important in any model that describes Aboriginal capacity building.[Note 1] Community-based
healing has been found to be an effective solution to a multitude of community problems.[Note 2] In the words of one participant in a study of Aboriginal women's health in Manitoba: "The need for the community to be well … begins with each of us."[Note 3]
Environment
Much in the way personal health is reflected in one's community, the social, cultural and historical health of the community is closely tied
to the land and environment. For many Aboriginal people, cultural identity – the very fabric of community – is inextricably bound to place. It follows that community health is dependent on the health of the environment. A bountiful
environment provides for sustainable food production and other essential
contributors of good health. From an Aboriginal perspective, sustainability
of the environment is synonymous with spiritual, economic and social survival.[Note 4]
Education
The survival of the community depends on child development and education. Without a strong and concerted effort to educate Aboriginal and northern youth, future community leaders may suffer from a lack of employability and an eroded sense of self-identity and self-worth.[Note 5] Furthermore, the cultural well-being of the community may be jeopardized by the diminished
capacity to transfer knowledge across generations. Education is intricately
linked with other areas of well-being as it prepares Aboriginal and northern
people for new opportunities that will result in an increased standard of
living and overall community well-being.
Economy
In 2006, the Royal Commission on Aboriginal Peoples noted that the economy posed the greatest challenge for Northern peoples.[Note 6] The socio-economic conditions in Aboriginal and northern communities are highly complex and continue to undergo significant change. From the redistribution
of wealth during potlatch ceremonies on the West Coast to the estimated
$40 million dollars of food produced annually by Inuit, much of the well-being
of communities depends on the local economy.[Note 7] Today,
Aboriginal and northern communities are increasingly identifying and participating
in economic activities that, given adequate capacity, could provide sustainable
means for diverse cultures to flourish in Canada's dynamic economic
environment.
Governance
It is broadly accepted in the literature that good governance and capacity to govern are foundational elements of a healthy and well-functioning community.[Note 8] Without governance capacity, First Nations would not be able to claim the right
of self-determination, which brings continued cultural strength and self-sufficiency.[Note 9] Aboriginal
people engage in diverse forms of political and social organizations. Despite
this diversity Aboriginal people share common aspirations for strong and
self-sufficient governance. As communities continue to change and grow,
the need for strong Aboriginal governance structures that have the capacity
to bring individual and community well-being to parity with other Canadians
becomes more pressing.
Infrastructure
At last, the thematic area of infrastructure is a contextual enabler of broader outcomes relating to health and well-being, general social
health and economic opportunities. For instance, adequate housing is
related to a number of health and well-being outcomes including security
and physical health. Access to high speed internet permits connection
to one's community and wider information networks and enables those
in remote communities to engage web-based economies.
It is important to note for the purposes of comparison that a number of Aboriginal community well-being indices administered in Canada target the thematic areas selected for this project. For instance, a recent study found that health, education and economy are three of the most commonly covered thematic areas in measurement tools and conceptual models. Likewise, the same study found that measures of leadership/governance and environment were also often included in index data collection.[Note 10]
3. Research Approach
3.1 Community-level Performance Indicators
Performance measurement targets various levels of analysis. Indicators developed for the United Nations Millennium Development Goals, for instance, draw from country-level data, focusing analysis on world and regional trends.[Note 11] Organizations such as Statistics Canada and provincial data collection agencies may develop indicators and data collection approaches that enable comparison of national or sub-national regions.[Note 12] A more detailed approach to performance measurement seeks to determine the condition a single community, taking into consideration key issues and priorities that most meaningfully contribute to the development of that community. Community-level indicators often go beyond high-level descriptive measures to integrate individual values and character into performance measurement.[Note 13] These indicators offer the opportunity to view issues from a systemic or institutional perspective that is often difficult to gather at the individual level.[Note 14]
It is challenging to find community-based indicators for Aboriginal groups in Canada because of the diversity of the Aboriginal population. Broadly speaking, there are three main Aboriginal groups Canada: First Nations, Métis and Inuit. There are numerous northern communities comprised of Aboriginal and non-Aboriginal individuals. Among these groups are countless communities ranging from rural and isolated First Nations and Inuit settlements to urban Aboriginal people. Each community has different needs, priorities and ways of measuring their own success that departmental performance measurement must be sensitive to. The indicators explored in the following thematic chapters offer ideas for promising ways to measure some of the more significant issues facing Aboriginal and northern people at the community-level. These indicators can tell only part of the story of the impacts of government programs on Aboriginal and northern communities. For a fuller understanding of the cultural circumstances of individual communities, the reader is encouraged to couple these indicators with others that seek to explain how the progress of Aboriginal and northern communities is framed in the context of unique histories, cultural practices and ideas for how to sustain community well-being into the future.
3.2 Aboriginal Approaches to Performance Measurement
To gain a greater appreciation of how Aboriginal peoples understand the world, a review of several models and other studies help reveal pillars of a healthy Aboriginal community. It is equally important to note that Aboriginal models often go beyond objective analysis to include direct experience, interconnectedness, relationships and values, all of which can be difficult to adequately explain, much less measure.[Note 15] Finally, the broad thematic areas reviewed in this report, selected in part to reflect the current state of programming in the Department, do not cover all of the components of a healthy community identified in the literature. As a result, this guide should be used as a starting point for beginning to understand Aboriginal and northern conceptions of the world and notions of community well-being.
An Aboriginal view of the world is often considered to be holistic. This holistic perspective looks at the individual, family, community and nation; the body, mind, spirit and heart; the animal world; the sun, water and air.[Note 16] It centres around the balance of these and other aspects of human life that include the physical and spiritual as well as the surrounding natural environment. According to a conceptual framework developed for the Regional Health Survey (RHS), "[f]or First Nations peoples, community wellness is related to the mental, physical, cultural and spiritual well-being of both the individual and the community."[Note 17] In order to capture the full scope of what constitutes a healthy community for Aboriginal people, it is necessary to take a multi-dimensional approach in viewing the community.
One way to conceive of an Aboriginal worldview is through socio-ecological analysis. A socio-ecological approach to community health posits that "good health is a product of reciprocal interactions between individuals and environments that shape their lives."[Note 18] One author broadly describes socially-determined community health as a function of social, cultural, educational, economic and political environments. A key idea in this context is the interrelationship between individual health and balance with one's environment[Note 19].One important study on indicators related to humans and their surroundings is The Well-being of Nations written by Robert Prescott-Allen. This study focuses on sustainability in the assessment of quality of life and the environment in 180 countries through the use of four indices including the Human Wellbeing Index (HDI), Ecosystem Wellbeing Index (EWI), the Wellbeing Index (WI) and the Wellbeing/Stress Index (WSI). The first two indices offer comprehensive measurements of human well-being and environmental quality. The remaining can be used to compare the relationship between quality of life and the environment.[Note 20]
4. Methodology
4.1 Scope, Duration & Methods
This project was completed by a team of eight graduate-level interns who worked collaboratively over the course of four months to fully examine each thematic area. While the scope of the project was directed by the activities of the Department and the research broadly reflects the many Program Areas of INAC's Program Activity Architecture (PAA), the intent was to also address common areas of importance in Aboriginal and northern communities discussed in the literature. The goal of this approach is to establish a research scope that encompasses both high-level activities of the Department and issues identified as holding special importance to Aboriginal and northern community development and capacity building. The following research methods were used to gather information to this extent:
4.1.1 Phase 1: Data Collection
A. Literature Review
The purpose of the literature review was (i) to define the concept of
community-level performance measurement and identify best practices and
promising performance indicators and (ii) to review Aboriginal perspectives
and cultural knowledge frameworks to isolate indicators that measure what
is most meaningful for Aboriginal and Northern communities. To this end,
the project team identified and reviewed indicator-related literature
including national and international jurisdictions, Aboriginal organizations
and other community-based projects. The types of literature included in
analysis include peer reviewed journals, grey literature and other studies
published at the community level. A detailed bibliography of all sources
can be found at the end of this report.
B. Document and file review
The project team reviewed departmental performance measurement documentation
including the Program Activity Architecture (PAA), Performance Measurement
Framework (PMF), Report on Plans and Priorities (RPP), Department Performance
Report (DPR) and the 2008 RMAF study, State of Performance Measurement
of Programs in Support of Evaluation at INAC. Though not discussed
in detail in this report, these documents were indispensible when determining
the relevance of indicators to the activities and objectives of the Department.
C. Departmental Engagement & Outside Interviews
Assistant Deputy Ministers from all INAC sectors were contacted and asked
to provide contact information for a sector lead with knowledge in performance
measurement work underway. Sector representatives were asked about lessons
learned and their specific needs when developing performance measures. Other
federal departments and provincial governments and Aboriginal / community
organizations were contacted and asked to provide input into the project
based on their expertise and what they felt were pressing needs in the field
of performance measurement. These organizations provided insight into some
of the broader issues to consider when selecting indicators, such as opportunities
for streamlining data collection and measuring success across departments,
governments and sectors.
4.2.1 Phase II: Analysis
D. Indicator Analysis & Criteria for Selection
Following the screening of hundreds of indicators discovered in the research, a broad list of twenty to fifty indicators was developed for each thematic area. The research group then discussed which of these were most applicable to the Department and the issues facing Aboriginal and northern communities. This process arrived at a list of ten to fifteen headline indicators in each thematic area.
Although the researchers did not conduct a rigorous analysis
of promising indicators based on a hard set of criteria, a number of factors
were given consideration when determining which indicators to include in
the select list for each thematic area.
- Utility.Extent to which indicators have broad applicability
across the thematic areas and can be used by programs in multiple areas
of the Department
- Applicability.Extent to which indicators have particular relevance to Aboriginal and northern communities and can be used to compare progress in these communities.
- Comparability.Are there indicators being used by other
jurisdictions that could be applied to INAC programs?
- Availability. How are indicators used and collected?
What is the source of data? How often is data collected?
- Reliability. How reliable are data sources and methods
of inquiry? Have they been tested or implemented among Aboriginal and/or
northern communities?
- Validity. How well does the indicator address outcomes
or success as it is defined in each thematic area?
- Feasibility. Overall, is the indicator a feasible option for performance measurement at INAC? Is it possible to implement?
E. Mapping of the Indicators to the PAA
A key component of the Department's strategic management, the Program Activity Architecture was chosen as a framework of reference to
depict the ways in which the selected indicators can currently
be used to measure the progress of program activities toward their stated
objectives and ultimately, toward the Department's Strategic Outcomes
In order to assess the applicability of indicators across INAC's current
program areas, a mapping exercise was conducted to determine the relevancy
of selected indicators in each of the thematic areas to the PAA. This exercise
contributes to the utility of the project through the alignment of indicators
with program areas based on their identified activities and objectives.
Moreover, headline indicators with broad application across the PAA have
been revealed through this process.
4.1.3 Phase III: Reporting
The principal findings of this project are a set of indicators that offer insight into many different departmental activities. A final section of the report discuses conclusions broadly drawn from the research and offers recommendations for continuing to improve performance measurement in the Department. These findings were presented to INAC's Evaluation, Performance Measurement and Review Committee in September, 2009 and, following approval, have been made available to INAC, other federal departments and the broader public.
4.2 Research Limitations
This research project undertook the task of identifying a suite of indicators that meet two separate and at time competing objectives. On one hand, the project focuses on identifying intermediate and ultimate or "high level" outcome indicators. On the other the hand, it was considered imperative that selected indicators be assessed and included based on their applicability and relevancy at the community level. This presented a significant challenge because intermediate and ultimate outcome indicators may be very broad in nature and may therefore be applied as strategic measures to evaluate multiple experiences or social conditions. However, indicators operating at this level may not, in all cases, be of use or provide information of interest to particular Aboriginal and northern communities in Canada. According to Chouinard & Cousins, Aboriginal peoples do not tend to compartmentalize, demarcate or contain their experiences as outcomes are often integrated into the culture and broader community.[Note 21] Therefore, although selected indicators will retain a high degree of relevancy at the policy level, a single indicator may be better suited for a particular community or program activity than to another.
Throughout the research phase it became clear that there is no clear methodology for assessing community development across First Nations, Métis and northern communities. Although several different frameworks acted as a research guide, no single method was available that could reasonably encompass Canada's diverse Aboriginal and northern populations. Therefore, readers should be aware that indictors were developed from a broad base of methodological perspectives that may only be applicable in particular cultural contexts.
Both objective and subjective indices are needed to understand the quality of community life. Yet, for those indicators requiring consideration for particular context, there exists an additional challenge for data collection. Although the indicators selected are among the most relevant, culturally specific indicators may, in many cases, require significant financial and human resources in order to collect. This is particularly the case for assessing programs that deliver services to urban Aboriginal individuals and communities as there continues to be a significant discrepancy in research and data available about this population.
Finally, considerable communication with experts across INAC and other federal Departments was undertaken for the project. However, only two external organizations were consulted about indicator selection. Thus, report findings are limited to the perspectives found in the literature and across the federal government. Further consultation is required in order to develop indicators and measurement models that are validated and recognized by Aboriginal and northern communities.
5. Thematic Chapters
Discussion of Thematic Chapters that follow focuses on (i) the context or issues facing Aboriginal and northern communities, (ii) rationale or reason for selecting the indicator (i.e. how the chosen indicators address key outcome areas) and (iii) assessment / analysis. Assessment of each indicator, to which the most attention is given, is based on its practical applicability to INAC including: the context in which the indicator is being used and understood by other organizations/jurisdictions; the relevance and comparability to INAC programs; and strengths and weaknesses of the indicators.
Community-level indicators are generally presented in one of two ways: (i) Measures of the governmental, economic and social systems operating in a community and (ii) measures at the individual or household level that contribute to broader outcomes of the community. It is noteworthy that a number of the indicators discussed in this study – for instance literacy rate – are not inherently community-based and may have been chosen in part because they offer the opportunity for data comparison with other jurisdictions.
The application of these indicators at the community-level depends on the selected unit of analysis and the scale at which data are reported. For example a geographical unit of analysis (i.e. person, household, neighbourhood, city, province, etc.) may be reported as the total number of persons in a community, communities in a region, households in the nation, etc. Analysis can also be used to compare indicators of a single Aboriginal or northern community to another, or to national or international benchmarks.
6. Health and Well-Being
6.1 Introduction
Recurrent in the literature on Aboriginal health and related health indicators is the fact that Aboriginal peoples' health is in a concerning state when compared to their non-Aboriginal counterparts. The Human Development Index (HDI) for the registered Indian population shows that while scores on the HDI have increased between 1981 and 2001, this progress has been slow and has left Aboriginal communities behind the rest of Canada.[Note 22] Examining health and well-being can be a daunting task, as this area covers all facets of human existence. According to the Royal Commission on Aboriginal Peoples:
Aboriginal people from almost every culture believe that health is a matter of balance and harmony within the self and with others, sustained and ordered by spiritual law and the bounty of Mother Earth.[Note 23]
Aboriginal people often describe health as a balance between various elements in which all things are interconnected: "Indigenous ideologies embrace a holistic concept of health that reflects physical, spiritual, emotional and mental dimensions. However, it is the interrelatedness of these dimensions that is perhaps most noteworthy."[Note 24] Health can also be affected by and in turn affect the environment, culture, family and community. These elements do not act in silos but connect with one another, influencing the community at all levels.
The multiple facets of individual and community development contributing to health and well-being means that developing performance measures to satisfy these elements is a complex and challenging task. Measuring wellness forces us to expand our thinking about health beyond concerns of merely the physical person to include the entire human being in the broader context of the community. The complexity of this area suggests that there are hundreds of indicators available to measure various elements of health and well-being. Developing a comprehensive picture requires considering health status indicators such as physical and mental health as well as indicators that measure both the social and environmental determinants on health such as living and working conditions, child development and poverty.
Throughout the analysis, this section considers various Aboriginal frameworks for selecting culturally relevant indicators. We have based our approach to indicator definition on the principles outlined in the First Nations Regional Longitudinal Health Survey (RHS) Cultural Framework. The RHS Cultural Framework begins by defining health as "the total health of the total person within the total environment."[Note 25] This definition suggests strong interconnectedness between individuals and the community. The RHS cultural framework encourages us to consider a dynamic array of indicators as contributing to the overall health and wellness of the individual.
Looking at health from a holistic and social determinants lens allows us to more fully understand individual and community factors affecting health. It is impossible to suggest only a few indicators that are comprehensive enough to examine important trends. The indicators we are suggesting are therefore broad, composite indicators containing a variety of sub-indicators and possible measures. Sometimes, using one or two sub-indicators is sufficient, as programs may seek out snapshot of a certain area in health and well-being. At other times, a deeper analysis will be required. In such cases, all sub-indicators can be used and the measures can be combined with indicators appearing in other thematic areas to illustrate a more comprehensive picture.
The following section provides a detailed analysis of health and well-being indicators that research shows to be among the best for portraying a holistic perspective of the current state of Aboriginal and northern communities in Canada.
6.2 Findings
1. Physical Health
Context
One of the most basic elements of health and well-being is physical health. Developing performance indicators to measure physical health requires us to look at a myriad of factors that have the largest impact on the health of Aboriginal and northern populations at the community level. Research on Aboriginal health conditions continually shows that Aboriginal people are more at risk of developing serious health problems than other Canadian populations.[Note 26] Aboriginal communities face higher rates of diabetes, obesity, heart disease and have a lower cancer survival rate than their non-Aboriginal counterparts.[Note 27]
Health Canada is the primary department responsible for Health on reserve and in northern communities. Health Canada reports on vital statistics such as birth weight, mortality rate for various diseases, years of life lost due to suicide or unintentional injuries as well as the incidence rate of sexual transmitted diseases, infections and other diseases.
Rationale
In this report, Physical Health is measured with two components in mind: (i) Morbidity and Mortality and (ii) Disability and Chronic Disease. A number of measures of Morbidity and Mortality such as life expectancy at birth are long established measures of physical health and can be disaggregated to individual populations. These measures also reflect the status of health care and the effectiveness of preventative care.
Measuring Disability and Chronic Disease allows us to assess the long term trends in disease rates. It is also linked to life expectancy as lower death rates may indicate success in disease prevention, detection and treatment. Measures such as ‘rate of unintentional injuries' allows us to measure the adequacy and effectiveness of injury prevention efforts, including public education, community and road design, prevention, emergency care and treatment resources.[Note 28]
Assessment
The Morbidity and Mortality indicator, along with its sub-indicators and measures is universal, which means it can be used in different populations and settings. It is a proven acceptable measure of assessing individual health in a population and it is sensitive in that it can measure changes over time that are of interest to INAC and to the communities that it is serving. The mortality rate measure allows for comparisons of death rates between two or more populations by adjusting for differences in population age distribution. However, the indicator is currently difficult to measure for Aboriginal populations alone. Moreover, it does not account for health behaviours that influence physical health such as the rate of drug/alcohol consumption and smoking.
Disability and Chronic Diseaseis a simple measure. However, one weakness is that it does not assess the socio-economic context (the social determinants) and root causes. To optimize measurement, the indicator must be measured over time to show improvements or setbacks in a specific population.
2. Emotional/Mental Health
Context
The state of mental and emotional health among Aboriginal peoples is of major concern for many communities across Canada, both rural and urban. Many mental health problems arise due to a variety of physical experiences and conditions including abuse, poverty, poor housing, loss of language and discrimination. Therefore, mental and emotional health cannot be understood in isolation of other aspects of health and well-being such as physical health, rates of poverty and community history. This view is consistent with the 1996 Report of the Royal Commission on Aboriginal people which states:
Among the First Nations and Inuit communities, the term mental health is used in a broad sense, describing behaviours which make for a harmonious and cohesive community and the relative absence of multiple problem behaviours in the community, such as family violence, substance abuse, juvenile delinquency and self-destructive behaviour. It is more than the absence of illness, disease or dysfunction — it is the presence of a holistic, psychological wellness which is part of the full circle of mind, body, emotions and spirit, with respect for tradition, culture and language.[Note 29]
Rationale
According to Lalonde any attempt to measure the health of Aboriginal communities would need to compensate for the effects of the "disconnection" that is the legacy of residential schooling and other forces of assimilation.[Note 30] For that reason, special attention would need to be paid to contemporary efforts to provide opportunities for interchange across generations."[Note 31] Furthermore, the Health Council of Canada reports that many residential school survivors have been unable to establish effective relationships within their communities as a result of being taken away at an early age.[Note 32] Thus, the usual parenting, role modeling and social bonds that occur with other members were severely and permanently damaged as a result of the residential school legacy. In an effort to understand this "disconnection" between Aboriginal generations, the State of Emotional and Mental Health indicator places significant emphasis on measuring for the effects of residential schools on individuals as well as the intergenerational impacts that persist today. Possible measures of individuals' mental and emotional health as a result of the residential school legacy include, but are not limited to, the following:
Headline Measures
- Proportion of community members who attended residential school (living
and deceased)
- Self reported mental health (measures the percentage of the population
aged 18 years and older who reported their level of life stress as "quite
a lot.")
- Level of satisfaction with life
- Perceived happiness
- Suicide rates (measured across a range of ages) including attempted
suicide and suicide ideation
- Reported experience of discrimination
Other Measures
- Education attainment (see Education Thematic Chapter)
- Rate of unintentional injuries (see Physical Health indicator)
- Alcohol and drug abuse rates
- Rate of children born with fetal alcohol syndrome (FAS) and fetal alcohol
effect (FAE)
- Rates of sexual abuse
- Rates of eating disorders
- Rates of sleeping disorders
- Rates of chronic physical illness (see Physical Health indicator)
Assessment
Data for the Emotional and Mental Health indicator is available from diverse sources such as Health Canada, INAC statistics and Statistics Canada. To date, however, no single index has been developed to specifically measure the impacts of residential schools on community health and well-being. Because individuals respond to and cope with experiences related to the history of residential schools in diverse ways, this indicator may be best measured against other health and well-being indicators listed in this report such as Physical Health and the Community Engagement indicators. According to the Aboriginal Healing Foundation (2003), "communities have found strength in another unanticipated residential school impact; namely, the friendships and alliances built among students from different communities, nations and people."[Note 33] Thus data from several composite indicators can be reliably measured to determine the state of emotional and mental health of both communities and individuals.
3. Quality and Appropriateness of Health Services
Context
Aboriginal and northern communities often lack capacity to access appropriate health services. Sometimes, only essential primary health care is available locally. For the most part, health services are provided by the federal government. Depending on the number and extent of transfer agreements in the community, these services may not meet the needs of the population, particularly if there is no diversity in the availability of health care professionals and diagnostic treatment options.
Rationale
The World Health Organization (WHO) has defined three principal goals for health-care systems as: contribution to good health, responsiveness to the expectations of the population and fairness of financial contribution. Measuring the quality of a health care system and its appropriateness (that is, the extent to which it meets community needs), is an important measure because it determines whether a community's physical and emotional health and healing needs are being met. Inequitable health care may act as a barrier to accessing or developing health promoting behaviours, resources and opportunities.
Assessment
This indicator allows us to determine health care needs for individual communities and to assess health service and delivery across a number of characteristics with the ultimate goal of improving health services and making them relevant. As such, this indicator may assess:
- Issues of accountability and fragmented delivery
- The ability of the health system model to tackle chronic disease – a
large factor of morbidity and mortality
- The extent to which the health system accounts for culture or language
- The extent to which the health system accounts for the social or economic
determinants of Aboriginal and northern people's health
- The extent to which community needs may fall beyond the coverage received
through the Non-Insured Health Benefit Plan
- The availability of appropriate health service professionals
While these are integral characteristics for determining the quality of health care provision, some of them are difficult to measure and compare because they are often community-specific. As such, this indicator is not necessarily a simple measure but is a policy-relevant indicator focusing on bettering the health system so necessary for individual and community health and well-being.
4. Accessibility and Use of Health Services
Context
Aboriginal and northern communities are often further burdened by limited access to resources that could ameliorate health problems.[Note 34] According to the Assembly of First Nations, Aboriginal peoples are less likely to receive quality care due to waiting time and the fact that no services are available at the required location and time.[Note 35]
Rationale
This indicator, taken together with the Quality and Appropriateness of Health Service indicator, allows us to further assess the extent to which health services are achieving their goals of serving community needs and how the community is able to benefit from them. Accessibility and Use of Health Services assesses the extent to which health services are usable by the population which they are meant to serve. The indicator recognizes that geographical isolation and lower socioeconomic living conditions may mean that it is harder for Aboriginal and northern people to access the services which they need to support their health and well-being. Moreover, it allows us to identify a variety of conditions which prohibit access to health services such as poverty and geographic limitations.
Assessment
Existing data on barriers to access of health services is available through the Regional Health Survey (RHS), but available only for First Nations people living on reserve. Equivalent information for Métis and Inuit populations is not available. The challenge of this indicator is determining what is considered appropriate access and, given the geographic isolation of some communities, what might be done to remedy limited access. The benefit of this indicator is that it can be compared across Canada to encourage standards which bring Aboriginal and northern communities in line with provincial standards.
5. Community Engagement
Context
According to the Report of the Royal Commission on Aboriginal Peoples (1996), "the health and well-being of individuals depend in part on community health and social dynamics."[Note 36] The variety of values and norms of a society influence the health and well-being of individuals within communities and contribute to positive feelings of cultural identity and increased cultural continuity. The focus of the Community Engagement indicator is to look at how communities can contribute the overall health and well-being of their members through social cohesion and participation.
Culture and tradition are integral components of First Nations' holistic approach to health and well-being. According to Lalonde (2005), "feeling ‘connected to' and ‘valued within' one's community is associated with all manner of positive health and outcomes across the lifespan."[Note 37] Traditional activities such as ceremonies, dances, potlatches and healing circles help to sustain culture in the community and its subsequent generations. A lack of cultural connection is frequently cited as a primary cause of many of the social problems facing First Nations.[Note 38]
However, community engagement indicators need not be restricted to traditional activities. While the benefits of engaging in traditional activities, particularly language, are well documented, Aboriginal communities across Canada experience different degrees of acculturation and may therefore engage in community events that reflect a range of contemporary and traditional activities.[Note 39] Community engagement may also include engaging members in decision-making about community infrastructure and governance. Thus, the Community Engagement indicator measures the extent to which community members are connected to one another through a variety of activities that promote cultural continuity, civic engagement and knowledge transmission in an effort to preserve culture while at the same time measure community progress.
Rationale
The 2002/2003 Regional Longitudinal Health Survey found that "traditional cultural events are important to most people, regardless of their age, gender, income, education, First Nations language skills or their community's size or isolation."[Note 40] By measuring the extent to which members across communities engage in both traditional and non traditional activities, INAC's programs can develop a better understanding about the cultural context of Aboriginal and northern peoples. This allows INAC, on a departmental level, to monitor social progress in Aboriginal and northern communities across Canada.
There are several options for measuring Community Engagement. Depending on the community and cultural context, this indicator may be measured based on the following:
Headline Measures
- Percentage of community members who identify with the community's
cultural history, language and traditions
- Number of community or group celebrations/year
- Rates of participation in traditional spiritual ceremonies or rituals.
For example, participation rates in tribal council games or gatherings
and other national or international Aboriginal initiatives
- Percentage of Aboriginal learners (degree to which they are engaged in traditional practices)
Other Measures
- Number of religious or spiritual spaces available (i.e. churches,
sweat lodges) in the community
- Number of available recreation and employment programs
- Rates of participation in recreation and employment programs
- Degree to which individuals can identify a shared purpose and vision
for the community
- Number of cooperative associations in the community
Assessment
Community engagement can be difficult to measure due to the multifaceted and varied dimensions of culture. One of the more common indicators of preservation of First Nations culture is the use of Aboriginal language. Reliable data on non-traditional recreational and employment activities is currently available from the 2006 Aboriginal Peoples Survey (APS). However, while certain traditional activities such as hunting, fishing, trapping and gathering plants are well documented by the APS and the RHS, whole collections of activities such as storytelling, cultural games and ceremonies are often overlooked because they fall outside the current conception of "traditional." Therefore, a re-examination of what constitutes activities involved in community engagement is necessary in order to effectively evaluate community progress and social cohesion. The vast numbers of activities that contribute to community engagement make it difficult to assess communities based on single criteria.
6. Community Safety
Context
Aboriginal people have historically been over-represented in the judicial system.[Note 41] According to Correctional Services Canada, "Aboriginal offenders continue to be disproportionately represented at all levels of the criminal justice system, including in the federal correctional system."[Note 42] At the end of March 2006, Aboriginal people represented 16.7% of federally-sentenced offenders compared to 1.7% of the Canadian adult population. Aboriginal incarceration impacts whole communities and "its measures highlight the level of the equality of justice and comments on the ability of western forms of justice to meld with traditional forms of Aboriginal justice." [Note 43] Therefore, it is important to document this trend and monitor changing conditions in Aboriginal communities.
However, incarceration rates alone are insufficient for measuring the extent that a community may be considered "safe." Other important qualities of community safety include rates of violent crimes committed by and against Aboriginal people, the state of violence against Aboriginal women and the accessibility of crime prevention and rehabilitation programs for both victims and offenders. Most importantly, however, the views of community members themselves about the level of violence and victimization they experience provide important markers for the overall safety of a community.
Rationale
The Community Safety indicator aims to measure community safety on two levels of analysis. First, it measures incarceration rates and rates of violent crimes. This measurement is an important marker of the changing socio-economic conditions across Aboriginal and northern communities. Second, Community Safety aims to measure the extent that culturally appropriate forms of justice and healing are available to community members. The Government of Canada is already taking action to meet this need. For example, through the Aboriginal Justice Strategy and in partnership with the provinces and territories, Canada provides funding to 451 communities for community-based justice and other programs that reflect the particular cultural values of participants.[Note 44] Measuring diverse aspects of Community Safety enables programs who deliver related services to assess how their programs are working to meet the needs of specific communities. We propose that programs focus on the following measures for assessing community safety.
Headline Measures
- Rate of incarceration of Aboriginal peoples vs. general population
- Rates of violent crime committed by and on Aboriginal peoples
- Reported perception on safety and fear of crime within the community
setting
- Percentage of crime prevention and rehabilitation programs administered by community members
Other Measures
- Number of crime prevention programs
- Number of crimes and level of criminality in the areas where indigenous
peoples live vs. in areas where there is a mixed population
- Number and participation rates of victim and offender rehabilitation
programs
- Community members' perceptions of the justice system
Assessment
The availability and validity of data for the Community Safety indicator vary between the two levels of analysis. On the one hand, incarceration rates are currently collected by Statistics Canada. The rate is calculated using the number of adults incarcerated based on data from the Integrated Correctional Services Survey (ICSS). Incarceration rates can further be measured against educational attainment and employment status to reveal a larger trend of the socio-economic context from which Aboriginal people come into the judicial system. However, it is important to note that data is not available from all Canadian jurisdictions and determining the proportion of offenders who are from urban centres continues to be a challenge.
The second level of analysis, from which the majority of the suggested measurements arise, are also currently being collected. For example, the 2006 Aboriginal Peoples Survey (APS) collected data on perceptions of safety. However, data related to access and effectiveness to alternative forms of justice and community rehabilitation projects remain limited.
7. Social Support and Community Services
Context
Measures falling under this broad indicator allow us to assess the social environment. Social supports are important to assist individuals in their daily lives, to meet special needs and to respond to community specific and contextual needs. Social supports and community services are integral to the well-being of a population as they help to ameliorate existing health problems and can prevent further health problems from occurring.
In a report published by the province of British Columbia, titled Pathways to Health and Healing, the author notes that traditionally, caring for Aboriginal children was a communal responsibility. Prolonged social and cultural upheaval has jeopardized the ability of the community to provide safe and healthy environments for children. A disproportionate number of children and youth are in government care. When Aboriginal communities face difficulties, they are not always given the resources and supports they need to ensure that children are raised in their home community and culture. "Federal child welfare funding for children living on-reserve is based on children coming into care, rather than on prevention and support for children in the home." [Note 45]
Violence and abuse are also prevalent in many Aboriginal communities. The presence of programs in the community and at school that provide a space for individuals to heal and to come forth with their experiences is a necessary measure of community support.
Rationale
Support from family and the community is associated with better health and well-being. Having programmes in place at the community level to support stresses and conditions arising from poorer socio-economic factors is integral to improving the health of Aboriginal and northern communities.
There are different ways in which we may assess the availability of supports for community and family depending on the needs of the community. The following are potential measures:
- Proportion of First Nations children on-reserve in care
- Number of First Nations children served by day care
- Programs to assist victims of abuse
- Presence of employment training programs
- Programs to heal the legacy of residential schools
- Programs to assist those with a physical or mental disability
Assessment
This indicator confirms the important role that the availability of community resources plays on health and well-being and assesses the social context of health. There are many measures that could be used here targeting the many social supports that are important to the well-being of a community. We have highlighted children in care and abuse because they are two critical issues for Aboriginal communities.
Measures for this indicator must be developed to a greater extent on a situational basis as looking at the presence or availability of programs as a single measure does not necessarily tell us if they are the right programs, if they are being used and if they are serving those communities which are most in need.
While there is some baseline data available across Canada regarding some of these measures (i.e. proportion of children in care), that could serve as useful comparisons for Aboriginal communities, measuring social support and services at the community level is particular to the needs of the community. As such, the indicator may be best developed as a community self-assessment mechanism.
8. Adequate Housing
Context
The Adequate Housing Indicator is strongly linked to indicators for housing quality, durability and safety as outlined in the Thematic Chapter for infrastructure. Housing issues are particularly pressing for the health and well-being of Aboriginal and northern people, particularly for Aboriginal children. An estimated 50% of the urban Aboriginal population under age 15 in Canada inhabits low-income housing.[Note 46]
Similarly, poor health among Métis children has been attributed to inadequate housing.[Note 47] Poor housing quality also contributes to ill health among the adult population. For example, the 2002/2003 First Nations Regional Longitudinal Health Survey found that of the 2.9% of respondents once diagnosed with TB, almost 1 in 3 (31.0%) live in an overcrowded house. It further found that 48.5% of respondents living in band-owned housing reported mold or mildew in their home while only 36.9% of respondents in other types of accommodation reported mold or mildew.[Note 48]
Size and affordability of housing is of concern across communities. Overcrowding effects Aboriginal households at a rate of four to one when compared with the non-aboriginal population.[Note 49] Results from the 2002/2003 RHS [Note 50] found occupant density of First Nation houses at almost double (4.8 persons) that of houses in Canada overall (about 2.6 persons). In the First Nations context, this trend appears to be increasing, while in the non-Aboriginal context the density has been declining over two decades.[Note 51]
Finally, Aboriginal people remain significantly over-represented in the homeless population across Canada. Aboriginal people are at higher risk of homelessness because they experience more profound rates of poverty, unemployment, mental health issues, domestic violence, addictions and sexual abuse than the non-Aboriginal population.
Rationale
Understanding the root causes of homelessness and gaining an accurate picture of homeless and housing trends related to size, affordability and environmental impacts provides programs with important information about the overall health and well-being of Aboriginal communities. In order to adequately measure this complex issue, suggested measures include the following (additional measurements are provided in the Infrastructure Thematic Chapter):
Headline Measures
- Overcrowding (average number of persons/room)
- Rates of disease associated with poor environmental health
- Rates of homelessness
- Number of aboriginal low-income housing units (vacancy rates)
- Percentage of aboriginal and northern people on social housing wait
lists
- Shelter costs to income ratio (housing that costs less than 30 per cent of gross household income)
Other Measures
- Proportion of homes with mold
- Extent that the housing market on-reserve is an economic engine creating value
Assessment
Data for housing is available within the Department and can be applied both provincially and nationally through such sources as the Community Well-being Index (CWB) and Inuit Well-being Index which include dimensions such as labour force participation and employment, income and housing. These indicators are derived from Census data and combined to form a single index score using a similar methodology as that used by the Human Development Index (HDI). Also, the Aboriginal Peoples Survey collects data about levels of satisfaction of housing quality while the Canadian Mortgage and Housing Corporation has a variety of available data tables bringing together information from diverse sources.
However, there is limited quantitative data available to understand some of the drivers of homelessness, particularly in the North. This is primarily due to inconsistencies in defining relative and absolute "homelessness" and the mobility/elusiveness of the population. Some information about shelter use has been made available. The 2001 Census added "shelters" to the type of collective dwelling. This category includes emergency or temporary accommodation for persons who may have no other usual place of residence, facilities for abused women/partners and their children, halfway houses and other shelters with some form of assistance. Measuring homelessness as a sub-indicator presents several challenges and may not be reliable; however, additional information can be obtained using other population statistics to provide a more comprehensive measure of housing need.
9. Literacy and Language Ability
Context
Language and literacy is of particular importance for improving the health and well-being of Aboriginal people. Language provides a link to cultural identity as it strengthens bonds between individuals and the community. Although a great proportion of Aboriginal communities use English or French as their principle language, "Aboriginal language remains an important element that brings members of Aboriginal communities together."[Note 52] Chandler notes language use as an indicator that has predictive power over youth suicide rates.[Note 53] Language has thus proven to be one of the most important cultural continuity factors. As Chandler notes: "Any threat to the persistence of personal or cultural identity poses a counterpart threat to individual or community well-being."[Note 54] Language connects people with their past and grounds them in the context of spiritual and cultural beliefs.
Literacy rates among children and adults are determinants of health because they are indicators of a skill fundamental to human progress and development. Language use and literacy indicators appear in most holistic measures of Aboriginal health indicating that they are integral factors to the health and well-being of the population.
Assessment
The Literacy and Language Ability indicator can be assessed using a variety of simple measures. The challenge with this indicator is that it is contextual and community-specific. Not all Aboriginal communities may feel that they are at a loss from not speaking and teaching their traditional language and certain demographics of the population may feel very comfortable using English or French as the primary language. On the other hand, it is important to assess intergenerational separationthat may exist due to the fact that young people in the community do not use the traditional language.
Furthermore, given the great diversity in Aboriginal languages, the policy direction that may stem from this indicator being assessed may be complex as we strive to provide language services across communities with diverse needs. This indicator allows us to assess other factors contributing to well-being. For example, community efforts to contribute to the preservation of traditional language can act as an additional marker showing community engagement and a desire to preserve culture.
10. Food Security
Context
Food security is essential for healthy eating and for a population's overall health and well-being. Food insecurity is a precursor to many health problems including malnutrition, low birth weight, unhealthy pregnancies as well as poorer health in seniors and greater rates of chronic disease. The concept of food security is broadly defined by Agriculture and Agri-Food Canada as existing "when all people, at all times, have physical and economic access to sufficient, safe and nutritious food to meet their dietary needs and food preferences for an active and healthy life."[Note 55] Vulnerability to food insecurity in Canada is generally attributed to people with low incomes, low educational attainment and social isolation among other population characteristics. Aboriginal and northern people are therefore among the most vulnerable group to suffer from food insecurity. The 2004 Canada Community Health Survey found that off-reserve Aboriginal households experienced a higher prevalence of income-related food insecurity than non-Aboriginal households. The survey reported that one out of three Aboriginal households faced food insecurity, 43% of which were severely food insecure. In comparison, 8.8% of non-Aboriginal households were food insecure, only 2.7% of which were severely food insecure. [Note 56]
Rationale
In order to achieve a holistic measurement of food security in Aboriginal and northern communities, measures should account for traditional food practices, food cultivation and storage facilities as well as ownership/control over lands designated for food production. This view is consistent with the United Nations Department of Economic and Social Affairs that states:
Indigenous Peoples affirm that their overall health, well-being and cultural continuity is directly related to their ability to eat their traditional foods and continue their traditional food practices. This should be taken into account in an on-going process to determine cultural indicators for sustainable agriculture, food systems and well-being among Indigenous Peoples.[Note 57]
Thus, to adequately measure food security among diverse Aboriginal and northern communities, the following measures can be useful for addressing both contemporary and traditional food practices. They include:
Headline Measures
- Income-related household food security (includes statistics for various
groups including households relying on social assistance, lone mothers
with children, Aboriginal peoples off reserve and children age 0-17)
- Availability and use of community hunting/gathering/fishing conservation
training programs
- Catch rate of ungulates and fish
- Perceptions that food is of insufficient quality (includes aspects of
dietary diversity, nutritional adequacy, preference)
- Self reported feelings of uncertainty or anxietyover food (situation,
resources, or supply)
- Total food production
- Total community expenditure
Other Measures
- Number of hunters/fishers in the community
- Number of active knowledge networks/steering committees focusing on
crop diversity, soil fertility and crop management
- Reported reductions of food intake (for adults and children – measured by calorie consumption);
- Feelings of shamefor resorting to socially unacceptable means to obtain
food resources
- Number of adequate food storage facilities in the community
Assessment
Income-related food security appears to be the most common measure for determining if a population can be determined "food secure." However, this measure does not account for other characteristics of food security that are integral for the health and well-being of Aboriginal and northern peoples in particular. The Aboriginal People's Survey has accessible and reliable data on hunting trends, harvesting and food quality. However, there remains limited availability of data is in respect to those measurements of traditional food knowledge transmission. Despite its unavailability and the cost and time it requires to collect, knowledge transmission data, in its many forms, remains an important measurement for food security because it allows the Department to make predictions about inter-generational transmission of hunting, gathering, fishing, farming and other sustainable food practices.
6.3 Overall Synthesis & Analysis
This chapter has reviewed indicators that represent integral aspects of the health and well-being of Aboriginal and northern peoples. The indicators measure individual and community health, the combination of which is necessary to fully measure community wellness.
Gaps/Limitations
One of the biggest challenges in using performance measures to assess success in programs related to health and well-being is the general lack of data that exists concerning Aboriginal and northern populations as well as very limited capacity to collect the data. One of the primary facets of health assessment data is the Canadian Census. The Census is a problematic data source when it comes to Aboriginal people because it lacks accurate identification that recognizes self-identified First Nations, Métis or Inuit ethnicity.[Note 58] This can result in coverage problems due to incomplete enumeration and a lack of accurate identification.
A further challenge in developing performance measures in this area concerns the diversity of population demographics, culture and capacity among Aboriginal and northern communities. Not only does the appropriate amount and type of health systems and programs vary across communities, but it also varies across Canadian jurisdictions. For example, population characteristics are more difficult to determine among urban Aboriginals than for remote communities and reserves. Provider jurisdictions in health care vary from the federal, provincial/territorial, Aboriginal governing authority or a combination thereof.[Note 59]
Further/Additional Considerations
Several additional factors are important to consider when developing performance measures or setting targets for community health and well-being. Firstly, self-determination is an important factor to the long term well-being of communities. Aboriginal people continue to advance in fulfilling their right to self-govern and toward their development as self-sufficient, sustainable communities. Self-determination and governance includes the management of health services and health information. For example, the First Nations Regional Longitudinal Health Survey conducted by the First Nations Centre at the National Aboriginal Health Organization addresses issues of data ownership, control, access and possession (OCAP). Working with established Aboriginal-development health assessment systems can provide a strong basis for building the performance measures necessary to measure community-level success.
Another issue which should be examined in the context of Aboriginal community development is the legacy of Residential Schools. Trauma of the residential school experience is "manifest in the form of ‘dissociation, mood, personality or behaviour problems, alcohol or other substance abuse, self-harm and suicide.'" [Note 60] Beginning the healing process of this issue involves moving toward a broader approach to prevention and treatment of ill-health and integrating health services for comprehensive healing. This process can and must be enriched by the use of cultural specific perspectives governing community perceptions.
Major gaps in health information systems and access to health assessment data at the community level is problematic at present – "issues of jurisdiction and Aboriginal self-determination will require the development of collaborative partnerships between First Nations, Métis and Inuit governing authorities and health information agencies."[Note 61]
6.4 Broad application
Assessing Aboriginal and northern health status involves piecing together various aspects of human wellness. The indicators which we have presented vary greatly depending on what they aim to measure. Taken alone, each indicator does not provide a sufficient understanding of the conditions of health in Aboriginal and northern communities. For example, physical health alone does not permit a comprehensive assessment of Aboriginal and northern health status. Non-medical determinants of health considered in this Thematic Chapter and in the other chapters of this report, provide us with a fuller understanding of health determinants and of performance measurement. Living and working conditions such as high school graduation, unemployment rate, housing affordability and child poverty are all factors that play a primary role in determining health status. While physical health is an important measure of individual well-being, social indicators are the key to assessing the primary determinants of health.
Because health and well-being is a complex and interrelated thematic area, it fits into almost every facet of this project. For example, the Early Development (school readiness) indicator found in the Education chapter can act as a direct marker for a factor influencing health, as children who start their schooling years behind can fail to catch up. Lack of educational attainment can result in difficulties finding employment, accessing adequate housing and feeling safe, happy and secure in life. As another example, the lack of proper infrastructure in the community, particularly to support school and housing, means that people will lack the physical structures to keep them secure and to give them a space to live and thrive. Such conditions directly impact the health of individuals and the well-being of communities.
7. Environment
7.1 Introduction
The environment impacts many aspects of community: Health and well-being, economy, infrastructure and, in the case of many Aboriginal groups, cultural identity. Poor air quality, for example, can cause lung and cardiovascular disease. Contaminants in freshwater can affect the growth and survival of aquatic life, which can, in turn, affect the food supply. The depletion of resources impacts sustainable development, causing poverty. Acid rain and increasingly severe storms can lead to damaged infrastructure. And, greenhouse gas emissions and resulting climate change can alter the landscape, ecosystems, and, consequently, community livelihoods. A healthy Aboriginal or northern community is dependent on a healthy environment.
Issues relating to the environment are of concern to INAC as well as Aboriginal and northern communities. The importance of sustainable resource and environment management is directly depicted within the Strategic Outcomes of The Land and The North. The Department's success, as well, is dependent on the health of the environment.
Indicators presented in this section have been selected based on their ability to measure environmental issues in Aboriginal and northern communities. These issues were researched and indicators were selected and/or developed based on pressing environmental needs. Research on Aboriginal perceptions of a healthy environment is limited. The indicators presented in this report reflect the Aboriginal context, to the greatest extent possible.
7.2 Findings
1. Water Quality
Context
This indicator is included in the Canadian Environmental Sustainability Indicators. It refers specifically to freshwater quality. Water pollution impacts the health of humans, ecosystems and the economy. The release of toxic substances such as mercury, for example, can effect the growth and survival of aquatic life. The contaminated aquatic life may then be ingested by humans. The high treatment costs and subsequent beach and/or shellfish growing area closures can harm the economy.[Note 62] Freshwater sources in Aboriginal and northern communities are particularly susceptible to toxic runoff from development projects, making water quality relevant to the environment surrounding Aboriginal and northern communities.
Rationale
This indicator is based on applications of the Water Quality Index (WQI), which was promoted by the Canadian Council of Ministers of the Environment (CCME) in 2001.[Note 63]The freshwater quality indicator groups WQI values into five categories: poor, marginal, fair, good and excellent. WQI measures the frequency and extent to which selected parameters exceed water quality guidelines at select monitoring sites.[Note 64] These guidelines have been identified for the protection of aquatic life and were developed by the CCME and federal, provincial and territorial partners.[Note 65] The water quality indicator has been used in the past to assess the effectiveness of water quality treatments and, more broadly, government programs and policies.
Assessment
Several limitations should be mentioned in a discussion of this indicator. Because plant workers are responsible for deciding appropriate parameters, guidelines and time periods, the data has limited comparability. In addition, the location of current monitoring sites in populated areas means that remote Aboriginal and northern communities with water pollution caused by economic development will not be measured. This indicator is reliable and valid; however, if used to measure the effectiveness of government programs and policies directly, its validity lessens. A qualitative indicator, perhaps in combination with Freshwater Quality, would be more comprehensive.
2. Land Degradation
Context
For many Aboriginal and northern communities, the relationship with the land is paramount. Land is essential for food, income and cultural identity. Consequently, a measure of the quality of land is significant in Aboriginal and northern contexts.
Rationale
The indicator, Land Degradation, is defined as the share of land which, due to natural processes or human activity, is unable to sustain either economic nor ecological function.[Note 66] One example of land degradation includes land affected by soil erosion and long-term loss of natural vegetation.[Note 67] Land degradation can prevent sustainable development, which can lead to poverty. Land degradation can affect human and ecosystem health. Finally, it can affect the inherent value of nature, which has spiritual and cultural importance to many Aboriginal and northern communities.
Assessment
This indicator measures the share of land affected but not the extent to which the land is affected, weakening its validity. More qualitative measures, such as an assessment, would contribute to a comprehensive understanding of the reduction in land quality. Despite this limitation, this indicator's strengths lie in its comparability, feasibility and reliability.
3. Climate Change Research
Context
Resource exploitation and greenhouse gas emissions are causing climate change which is impacting ecosystems, infrastructure and community and economic sustainability. An improved understanding of the risks and opportunities regarding climate change mitigation and adaptation is crucial for policy development, sustainable economic development and effective resource management.
Rationale
Climate change research is particularly relevant to northern communities. Climate change can result in a threat to traditional food supply, increasing climate sensitive disease and extreme weather and natural disasters. Engaging in Climate Change research allows us to assess areas of need including: Adaptation to a changing food supply, changes in transportation, infrastructure and the health effects of climate change.
This indicator measures the presence of coordinated research, observation, monitoring and modelling based on natural, social and health sciences. To be applicable, this research should incorporate local Aboriginal and northern knowledge and understanding of the environment and the related changes. The existence of climate change research demonstrates consideration for the future of people, the land and the economy. This indicator measures the presence of climate change research for the region or community and the involvement of Aboriginal and northern communities in conducting the research. Aboriginal and northern community involvement in the research means that the community is engaged in building knowledge about important issues rooted in their specific needs and affecting their community's future.
Assessment
This indicator has several limitations. It may fail to provide rich data because it does not measure the type of research but simply measures its existence. A valid measure for the purpose of this research is to simply assess whether climate change research is present. Measuring the extent of research would provide unfair comparisons across Aboriginal and northern groups, as not all groups are equally affected by climate change. However, since this indicator simply targets the presence of some form of research, it is comparable, valid, reliable, simple and inexpensive.
4. Environmental Risk Management
Context
Many Aboriginal and northern communities in Canada are exposed to varying levels of environmental vulnerability and risk. Healthy living and sustainable development are therefore dependent on a quality base of information revealing the potential hazards of inhabited regions. Environmental risk management is the most widely recognized way of assessing and managing the risks related to environmental vulnerability as they relate to both humans and the natural environment.
Environmental risk management is composed of two actions:
- Undertaking an environmental risk assessment (ERA)
- Implementing an environmental response action plan
The presence of these two actions indicates effective Environmental Risk Management. Environmental risk assessment (ERA) involves the examination of risks resulting from natural events (i.e. flooding, extreme weather events), technology, agents (i.e. chemical, biological, radiological) and industrial activities that may pose threats to ecosystems, animals and people. Environmental health risk assessment addresses risks to human health concerns while ecological risk assessment addresses environmental organisms.[Note 68]
Rationale
The implementation of environmental risk management is the most effective way of managing potential risks to humans and the natural environment. It is the systematic application of policies, procedures and practices to the task of identifying environmental hazards; analyzing the consequences and likelihoods associated with those hazards; estimating risk levels (quantitatively or qualitatively); assessing those levels of risk against standard criteria and objectives and taking steps to reduce risk levels. ERA is an internationally-recognized practice which is used to inform legislative and regulatory programs, including determining societally "acceptable" risk levels.
ERAs provide a basis for decisions on site-specific concerns (i.e. in land-use planning), help communities to prioritize environmental risks (i.e. regulation of chemicals or practices) and allow for comparisons between environmental risks to inform resource allocation toward the control of identified risks. Environmental Risk Management is therefore a highly effective tool for informing community planning and policy.[Note 69]
Assessment
Environmental Risk Management and its two components are widely recognized, comprehensive and highly acclaimed measures of environmental vulnerability. They provide a high level of detail which can have tremendous influence on a community's well-being and future economic development.
The primary drawback for this indicator lies in the technical expertise required to conduct an ERA. This may be a costly and lengthy process. However, viewed in terms of the potential costs of not assessing environmental risk, it may be argued that it is a cost-effective practice capable of saving not only money but potentially livelihoods and even lives in the future. Because of the comprehensiveness of the research involved in conducting an ERA, it may be considered highly valid and reliable.
The implementation of an environmental response action plan may pose costs to the community. However, generally the cost of acting is weighed against the potential consequences. Thus, decision-making is often based on cost-effectiveness and safety and is therefore typically made in the interest of the community.
5. Management Effectiveness of Protected Areas
Context
Protected areas and/or reserve areas need to be managed effectively for environmental protection and sustainability and continued community well-being and development. This indicator measures the effectiveness with which areas are being managed based on information about the context, planning and design, resource inputs, management processes, delivery of goods and services and conservation outcomes of protected areas. The current standard for measuring management effectiveness is by means of a site-level assessment has been developed by the World Commission on Protected Areas (WCPA).[Note 70]
Rationale
Management Effectiveness of Protected Areas is an important indicator of how well protected areas are conserving biodiversity and managing natural resources, important issues for many Aboriginal and northern communities which rely on natural resource exploitation for economic development. Moreover, these areas may be important to cultural heritage, scientific research, recreation and other values. It is thus necessary to know not only about the area and systems in which communities live and operate, but also whether these areas are effectively managed.
Assessment
This is a comprehensive indicator which could be applied at a site-specific, regional, or community level. It is therefore a good measure of the effectiveness of attempts to protect and sustain environmental quality in protected areas and on reserve land. Because the assessment relies on professional evaluation and is based on comprehensive research, findings can be considered highly reliable and valid.
Unfortunately, there are often high costs to assessing management effectiveness because it involves the engagement of trained professionals. In addition, measuring management effectiveness may be a lengthy process as the outcomes of good management may not be immediately noticeable.
6. Area of Forest under Sustainable Forest Management
Context
Many Aboriginal communities live in regions with forests and may rely on them for resource extraction, economic development and cultural purposes. This indicator measures forest area that is under sustainable forest management. It can be based on a variety of information, including data related to forest health, the extent to which forests fulfill targets associated with their environmental, economic, social functions, resource depletion and use and forest management practices.[Note 71]
Rationale
Forests serve multiple environmental, socio-economic and cultural roles in Aboriginal communities. They contribute to employment, traditional land use and recreational opportunities, and play a crucial role in the global carbon cycle. Human impact on forests has been significant and deforestation has raised concerns about forest growth and regeneration. Thus, the extent to which areas are under sustainable forest management contribute directly to sustainable development. Sustainable forest management is an important means to achieving economic development, halting deforestation, the degradation of natural resources and the loss of biodiversity.
Assessment
Criteria for establishing what is included in sustainable forest management has been established by international agencies such as The United Nations Environment Programme (UNEP), the United Nations Forum on Forests (UNFF), the Centre for International Forestry Research (CIFOR), the International Tropical Timber Organization (ITTO) and the International Union of Forest Research Organizations (IUFRO) as well as other members of the Collaborative Partnership on Forests (CPF). However, it may be challenging to locate the appropriate agencies or organizations responsible for assessing whether or not sustainable forest management exists. Since scientific consultation is required, this could be a lengthy and/or expensive process. An additional drawback is that no recommended targets have been established and thus communities or regions would need to decide these for themselves. However, the main benefit to this measure is its prescriptive nature – results from findings can be used to suggest further action towards sustainable management and can be used to track changes in use over time.
7. Proportion of Fish Stocks within their Safe Biological Limits
Context
Many coastal Aboriginal and northern communities rely on fish and commercial fishing for subsistence and increasingly for economic development. As a result, it has become important to monitor the degree to which stocks are being overdrawn in order to prevent overfishing and risk to species. Measuring the proportion of fish stocks within their safe biological limits is an internationally recognized way to provide information on the state of exploitation of fishery resources.
Fish stocks are measured and rated as either "underexploited," "moderately exploited" or "fully exploited" according to formal stock assessments based on a Food and Agriculture Organization procedure. Stocks that are "overexploited," "depleted" and "recovering" are considered to be outside their maximum biological productivity.[Note 72]
Rationale
The indicator provides information on the state of exploitation of fishery resources at the global, regional and national levels. It measures the level of sustainable production from capture fisheries, an important element of food security. It is based on formal stock assessments, derived from national and, for shared fish stocks, regional catch and effort statistics. It is a important reference for policy-making related to sustainable management of fish stocks, down to the regional level. Monitoring fish stocks contributes to maximization of sustainable production from capture fisheries and, as a result, to food security. In addition, this practice reduces the loss of environmental resources as well as biodiversity loss.
Assessment
One challenge with this particular indicator is that the state of fish stocks can be heavily impacted by other influences outside of human activity, including environmental fluctuations and climatic change, predator-prey interactions and habitat modification. In addition, the three rating levels are not comprehensive and only supply a surface-level analysis of fish stocks. However, this measure is recognized internationally as an exceptional tool to shape policy and fishing activity, increasing its comparability across jurisdictions.
8. Community Support for Environmental Programming and Sustainable Development
Context
For sustainable development and environmental protection to truly become a cornerstone of community living and economic development, it is crucial to have community support. As Aboriginal and northern communities face significant challenges related to environmental degradation and global climate change, the level of community support for environmental programming and sustainable development should be increasing to meet this need. There are two sub-indicators which could be measured to determine this:
- Percent of organizations that have adopted sustainable development goals
- Number of community environmental education programs.[Note 73]
Rationale
The immediate need to conserve environmental resources where possible and to develop environmentally sustainable industries is critical as many regions face continued and increasing challenges related to climate change and environmental degradation. Measuring the percent of community organizations which have adopted sustainable development goals provides insight into a community's openness, engagement and attitudes toward local environmental programming. Measuring the level of community support this way can be used to inform community environmental programming and policy-making, toward continued and improved sustainable development.
The number of environmental education programs within a community is reflective of the community's prioritization of environmental issues. In addition, implementing environmental education programs has the potential to increase awareness of environmental issues and concerns and can influence community knowledge and practices of sustainability and environmental protection.
Assessment
The two sub-indicators for Community Support for Environmental Programming are easily quantifiable, simple to measure and can be obtained at a low cost. Data can be gathered from community organizations that report on their sustainable development goals and any educational programs in place.
A weakness of these indicators is that they are strictly quantitative and do not provide any level of detail relating to the comprehensiveness and/or appropriateness of the sustainable development goals of communities or environmental education programs. Thus, it could be beneficial to conduct a systematic review of each component; however this would add to the complexity and cost of measuring these indicators.
9. Greenhouse Gas Emissions
Context
Greenhouse gas emissions in the atmosphere trap heat, thus affecting climate change. This, in turn, impacts the frequency and severity of storms, the migration of insects and infectious diseases, water availability, glacier and sea ice cover, crop yields and other biological and ecological systems.[Note 74] Greenhouse gas emissions and the resulting changes have the potential to affect a community's health and well-being, economy and infrastructure. The effects of greenhouse gas emissions are particularly evident within northern communities where changing glacier and sea ice cover results in reduced resources, infrastructure damage and in-migrating species.[Note 75]
Rationale
The Canadian Environmental Sustainability Indicators' Greenhouse Gas Emissions indicator measures human-made greenhouse gas emissions at a national, provincial/territorial and industry sector level. For the purpose of measuring environmental success in Aboriginal and northern communities, the trends at the provincial, territorial and sectoral level would prove useful. Additionally, individual communities' greenhouse gas emissions could be calculated.[Note 76] The data used to inform this indicator comes from an internationally approved inventory.
Assessment
This indicator is comparable, valid and reliable. However, it is strictly quantitative and provides no contextual information. Although calculating the Canadian Environmental Sustainability Indicators' Greenhouse Gas Emissions indicator may be complex and costly, a simpler Greenhouse Gas Emissions indicator that measures only carbon emissions would still provide an indication of environmental success in Aboriginal and northern communities. In addition to informing environmental performance measurement, this indicator can be used to inform reduction strategies, adaptation plans and risk assessments. Also, this indicator can help to identify sources of greenhouse gas emissions.
10. Air Quality
Context
Poor air quality is a common concern in many Aboriginal and northern communities, where economic development may not proceed in a sustainable way. Air quality is important to human, ecological and economic health. Poor air quality can lead to throat irritation, coughing and breathing difficulties, as well as serious respiratory and cardiovascular problems.[Note 77] Additionally, air pollution can affect vegetation by interfering with its ability to produce and store food, increasing its vulnerability to pests and disease.[Note 78] This can disrupt entire ecosystems, agriculture and subsequently the economy. Nitrogen oxides and sulfur dioxides are responsible for acid rain, which can erode infrastructure.[Note 79]
Rationale
The Air Quality indicator measures exposure to ground-level ozone and fine particulate matter, the two most widespread pollutants. In some cases, sulphur dioxide, nitrogen dioxide, lead, carbon monoxide and volatile organic compounds are also measured.[Note 80]
Assessment
Because most monitoring stations are south of 60˚ and near large cities, some remote Aboriginal and northern communities' air pollution may be difficult to measure. Also, due to the complexity of the indicator, data collection may be costly and, therefore, unfeasible. Given the quantitative nature of this indicator, it is comparable, reliable and valid. This indicator does not pertain to the Aboriginal and northern contexts, specifically; however, the literature identifies it to be of the utmost importance for human health and well-being in all contexts.
7.3 Conclusion
Trends
Most of the environmental indicators discussed in this chapter are quantitative: Greenhouse Gas Emissions, Air Quality, Water Quality, Land degradation, Climate Change Research, Community Support for Environmental Programming and Sustainable Development. These indicators describe the quality of the environment. Due to their quantitative nature, these indicators depict a comparable, reliable and valid description of the environment's health. In contrast, the remaining four indicators are qualitative and prescriptive in nature and speak to the quality of environmental management. These indicators provide richer data. Together these indicators create a comparable and reliable yet detailed picture of environmental success in Aboriginal and northern communities.
Gaps and Limitations
None of these indicators were created specifically for Aboriginal or northern contexts. With the exception of Climate Change Research, they do not explicitly consider Aboriginal and northern knowledge and understanding of the environment. Qualitative indicators that reflect Aboriginal perspectives were lacking in the literature pursued for this project.
Most of the indicators – with the exception of Community Support for Environmental Programming and Sustainable Development – are complex, costly and require expertise. Individual communities may lack the capacity to measure these indicators. In most cases, however, data is being collected by other departments and/or organizations in which case the coordination of data collection and data sharing may be the only challenge.
Additional Considerations
The Environmental Performance Index (EPI) may be a useful measure of environmental success. The indicators selected above are captured within the EPI; they were, however, selected individually to address specific environmental issues within Aboriginal and northern communities. The index was developed by the Center for Environmental law and Policy at Yale University and the Center of International Earth Science Information Network at Columbia.[Note 81] It is composed of 25 indicators that fall into the following categories: Environmental burden of disease; water as it pertains to health; air pollution as it relates to health; air pollution as it related to the ecosystem; water as it relates to the ecosystem; biodiversity and habitat; productive natural resources and climate change.[Note 82]
Broad Application
A healthy economy, sound infrastructure and general health of the community depend on a healthy environment. As such, indicators presented in this section can be used to measure success across other thematic areas. For example, considering the close ties between health and the environment, environmental indicators can be used to measure community health and well-being. Some indicators indentified as infrastructure indicators, such as the Canadian Water Sustainability Index, may be considered also as an environmental indicator.
8. Education
8.1 Introduction
Education is a cornerstone of human and social development and makes up one of the largest areas of programming within INAC, falling under The People Strategic Outcome (SO) area. INAC programming in education supports the provision of elementary and secondary education consistent with provincial programs and standards with the goal of increasing levels of educational attainment, improving employability, enhancing the quality of educational support services and providing financial support for status Indians to participate in post-secondary education. Research has shown that "the acquisition of human capital is highly correlated with income, wealth, occupational diversity and a host of other positive outcomes."[Note 83] Thus, an educated population is better prepared to deal with social challenges, to become self-sufficient, and to participate meaningfully in the national economy.
Developing performance indicators that measure educational success in the Aboriginal population is a complex task, particularly because Aboriginal people face unique socio-economic barriers to educational attainment. Increased levels of child poverty, substandard housing, higher rates of unemployment and incarceration, along with sub-standard living conditions leading to poor health are all factors in determining education success. Thus, measuring these impacts, and their relationship to educational programming, requires a holistic, whole-of-community approach.
Research on Aboriginal perspectives on learning provides us with a holistic lens from which to examine the development of a successful education system. This lens views education as lifelong, experiential and spiritual process, rooted in traditional language and culture and supported at the community level. The indicators highlighted in this section aim to meet INAC programming priorities while integrating this holistic perspective on education based on the First Nations Holistic Lifelong Learning Model – a model developed through the Canadian Council on Learning. Drawing on the inherent holism of many Aboriginal worldviews, this model compels us to conceptualize education as more than just what happens inside the classroom to incorporate family and community context as domains which influence educational attainment.
8.2 Findings
The following headline indicators, sub-indicators and proposed measures provide markers through which we can assess the success of INAC's programs in education.
1. Access to Learning Opportunities
Context
Access to Learning Opportunities is part of the Canadian Council on Learning's Composite Learning Index. Access to a variety of learning opportunities contributes to the social well-being of a population. Most importantly, access to learning institutions and to vocational training determines the extent to which a population can easily participate in the education system. Many of the communities where INAC is currently delivering services in education are remote and attending school (at the primary, secondary and/or post-secondary level) may therefore require extensive travel. This places a significant barrier on a population's capacity to participate in education.
Rationale
This indicator utilizes two measures of access to learning resources:
- Access to learning institutions including elementary and secondary schools,
colleges, universities and vocational schools.
- Access to community services such as libraries and civic associations, and cultural resources.
Access is an important indicator of education participation, as individuals living beyond a reasonable commuting distance to institutions of higher learning are less likely to attend.
Assessment
This is a holistic indicator that measures educational resources at the community level. It allows for cross-community and intra-community comparisons, which is important because it can open up further study and analysis of the factors that contribute to community success. While this indicator has been developed by the CCL for thousands of communities across Canada, the indicator has not been rolled out in the Northwest Territories, and has not been disaggregated for Aboriginal communities specifically.
This indicator applies one unit of measure and can be used to measure access to a variety of resources. However, it may be influenced by a number of factors. Measuring access simply by the unit of time it takes to travel to an educational institution or community service does not explain the socio-economic conditions which may be preventing access in the first place. As such, a challenge of this indicator is that it may simply show geographic isolation. However, this indicator, coupled with an enrolment indicator such as ‘Education Participation' or ‘School Life Expectancy' could provide us with a clearer assessment of program performance.
2. Sufficient Resources for Education
Context
Educational experience and ultimate outcomes for students are dependent on a wide variety of inputs. One necessary input is adequate resources to facilitate and enhance learning. Resources may be defined in terms of physical resources (i.e. facilities and supplies) human resources (i.e. teachers and support staff) as well as community and social resources (i.e. community educational programs, support from family and friends, etc.).
For performance measurement purposes we have selected three sub-indicators which are currently being measured across Canada and have been linked to broader educational outcomes in Canada and internationally. In an ideal situation, a school/community would measure all three sub-indicators. Taken together, they are contributing factors for the indicator Sufficient Resources for Education indicator. The selected sub-indicators for this indicator include:
- Student- Educator Ratio: All employees in the public school
system who are required to have teaching certification as a condition
of employment are considered to be educators. Teachers, principals, vice-principals,
professional non-teaching staff such as consultants, guidance counsellors
and religious and pastoral counsellors are also included.
- Students - Computer Ratio: Average number of students per
computer.
- Supports Available Outside the Classroom: This includes home and community supports available to assist students with their studies and general learning. This sub-indicator reflects the available resources and the value placed on education.
Rationale
This indicator, along with its proposed sub-indicators is useful for a variety of reasons:
- Student- Educator Ratio: In contrast to the commonly used indicator
of "student-teacher ratio," the student-educator ratio is a more comprehensive measure of the staff resources available
to support learning in schools, as it includes teachers, education
assistants, guidance counsellors, principals and other relevant members
of an administrative body. These individuals support learning above
and beyond learning in the classroom.[Note 84] This
sub-indicator allows us to assess the extent to which resources are
available to support student learning from a variety of perspectives.
It can be measured against provincial standards but should take special
community and school needs into account
- Students - Computer Ratio: Computers are now an educational and industry
standard. Information communication technology is considered an essential
part of a student's education, and many schools now incorporate
it into curricula. Moreover, "students who are comfortable with
computers and information technology may find it easier to progress
and succeed in school and then to make a smooth transition to the labour
market."[Note 85]
- Supports Available Outside the Classroom: Parent and family support is integral to the learning process. According to the Province of Saskatchewan, "[parents and family] facilitate discussions of academic progress and school experiences with their children, promote curiosity and a desire to learn, ensure necessary resources are available, and help and encourage their children."[Note 86]
Assessment
While measuring Sufficient Resources for Education is a critical component to gauging the quality of the educational system and the context for learning, one drawback is the degree of latitude in such a measure. We have suggested three means by which resources can be measured; however, this should not be considered a complete list. Moreover, even if a community or school possesses sufficient resources according to the selected sub-indicators, there may still be shortages in other resources (i.e. up-to-date textbooks, facilities, instructional tools). Therefore, we suggest using the indicator Sufficient Resources for Education more as a framework for developing indicators which measure the supports available to students, using the three selected sub-indicators as possible measurements.
The Student Educator Ratio and the Student-to-Computer Ratio are relatively simple to measure, and can be reported by schools, school districts, and even regions. One drawback to the Student-Educator Ratio is that it does not measure the technical capacity or quality of the computers, however, it is still a good starting point for measuring technological resources available to students.
In regards to the Supports Available outside the Classroommeasure, a qualitative survey given to students which gauges their level of home and community support is a good measure of the students' perceived level of support, however, as with all qualitative research, this measurement poses challenges in terms of reliability, although it may be considered highly effective in terms of validity. One additional challenge to this measure is the time and resources it takes to develop, collect and analyze the findings from the questionnaire.
3. Pan-Canadian Assessment Program (PCAP)
Context
Aboriginal students in either federal, provincial, or band-operated schools face a number of unique challenges which impact educational outcomes.[Note 87] Students often perform below the expected level for their age. In many cases measuring the level of performance in achievement is challenging, particularly due to many contextual issues, for example, language, a lack of educational resources and opportunities, along with socio-economic factors which influence educational outcomes. Because of the unique contextual factors for Aboriginal schools, standardized testing to compare performance against other students' achievements has been a topic of debate. However, standardized testing is a useful measure in that it provides citizens and schools across Canada with a picture of how well the education system is meeting the needs of students and society.[Note 88]
Rationale
The Pan-Canadian Assessment Program (PCAP) was designed to measure the performance of a randomly-selected sample of 13-year-old students from participating districts. The exam measures student performance across reading, math and science. Unique to the PCAP is the inclusion of a contextual questionnaire for respondents, which uses information from both student performance and the contextual questionnaires as well as the review mechanisms of individual jurisdictions in the interpretation of performance results. In addition, the information from the contextual survey may be examined and used by researchers, policy makers and practitioners to determine what factors influence learning outcomes.
Assessment
The PCAP is perhaps the most comprehensive standardized measure of educational performance available to Canadian students. The key feature of the PCAP which makes it particularly relevant and useful for measuring educational outcomes in Aboriginal and northern communities is the inclusion of the contextual questionnaire. This feature allows for context-specific interpretation of the results, while at the same time providing some basis to measure the quantitative outcomes of educational programs. It is recognized that making comparisons of results is complex across all Canadian schools and regions; however, the exams help to determine whether students across Canada are able to reach similar levels of performance at about the same time in their educational development. The PCAP is a reliable indicator of educational achievement not only for its standardized results scoring, but also because results may be disaggregated by gender and other variables.
One limitation of the PCAP is that it is only administered in English and French and therefore does not address the needs of students learning in their traditional languages. Furthermore, the test is only administered to 13-year-olds and so progress by the same cohort of students cannot be tracked over time.
The provinces and territories typically provide funding for the assessment (at a cost of approximately $3.00/student). It is likely that the cost associated with administering this test in band operated, federal and provincial schools with Aboriginal students would have to be absorbed by INAC.
4. Supportive Family Context
Context
The home context from which learning and development takes place is being increasingly recognized as important to educational outcomes. Because many Aboriginal communities face unique socio-economic and health challenges such as high rates of poverty and substance abuse, it is likely that many children subsequently face challenges in terms of the level of education support they receive at home. A number of provinces and organizations are now examining the family context in their analysis of educational programming. Because no single indicator can adequately capture the level of support in the family context, we recommend the use of three sub-indicators which contribute to Supportive Family Context. These include:
- Parental Participation in Children's Education: The
percentage of parents attending fall and spring parent-teacher meetings.
- Exposure to Reading at Home: The percentage of children
who have an adult read to them every day.
- Homework Assistance: The percentage of children who receive assistance at home with their homework.
Rationale
Home support provides a foundation for learning outside of the classroom setting and influences students' attitudes toward learning. The selected indicators are relevant and useful for the following reasons:[Note 89]
- Parental Participation in Children's Education: Parental
involvement supports children's learning at school and in the home
by providing guidance, encouragement, homework assistance and facilitating
meaningful discussion and other learning opportunities.
- Exposure to Reading at Home: Young children who are surrounded by reading material, who see adults reading regularly and who are read to at an early age often cultivate positive attitudes toward reading and develop their own appetite for reading.[Note 90]
- Homework Assistance: Assistance with homework not only improves learning but also demonstrates the family's commitment to education as well as the relative value placed on learning. Educational outcomes as well as attitudes toward education and learning are likely to improve with assistance.[Note 91]
Assessment
The importance of examining the family context for learning and its impact on education is worth investigating to determine how home supports could be improved or enhanced to facilitate and encourage lifelong learning.
Measuring the percentage of parents who attend parent-teacher interviews is a straightforward and simple way to measure the involvement of parents in their children's education, and can be easily tracked by teachers and reported to administrators. Not only is it an effective measurement, but it is virtually costless. On the other hand, it is not a comprehensive measure as it provides only a small glimpse into the many ways in which parents can be involved in their child's education and the education system in general.
Examining the self-reported measures of Reading Exposure and Homework Assistance, in addition to Parental Participation, provides a more comprehensive way of measuring Supportive Family Context.The drawback of these measures is their limited reliability and the time and resources required to create and administer the questionnaires and to collect and analyze the results.
5. Satisfaction with Quality of Basic Education System
Context
The diversity of cultures, language, and geographic locations of First Nations, Inuit and Métis and northern communities across the country mean that education institutions must meet a variety of unique needs. At the same time, education institutions should be in line with provincial standards, so that Aboriginal people may benefit from the same education as non-Aboriginal Canadians. A self-assessment of educational resources in the community allows us to better understand community needs and gaps in resources.
Rationale
Satisfaction with Quality of Basic Education System addresses the extent to which INAC's education programs are responding to community needs and providing learners with the foundational elements of educational success. This indicator can be applied across all education levels and can be used to assess perceptions of children, youth, adults and elders. The two sub-indicators Satisfaction with Aboriginal Specific Resource and Satisfaction with Aboriginal Adult Learning System further allow one to assess the dynamics of education programs and both learner and educator needs.[Note 92]
Assessment
The Satisfaction with Quality of Basic Education System is a useful indicator for a variety of reasons. First, it can uncover key community needs and areas of improvement. The indicator further promotes community participation in the assessment of education programs. Second, this indicator improves our information base about Aboriginal and northern learners and about the community by allowing us to measure educational quality from the individual and community perspectives. It recognizes the diverse needs of Aboriginal and northern communities and aims to determine missing resources. This information can act as a tool that can help Aboriginal organizations, parents, educators and various community members and stakeholders determine for themselves the effectiveness of programs. Finally, information gathered through this indicator can assist education providers as well as the federal government in delivering programming, to identify and continue initiatives that demonstrate positive results.
A potential weakness of this indicator is that it places a reporting burden on the individuals in the community. While the survey could easily be distributed to high school students and educators, arriving at parental viewpoints and those of other community representatives may be more difficult. This indicator is currently being developed by the Province of Alberta's Ministry of Education. It could be rolled out to other provinces and territories and could be compared across communities.
6. Civic Conceptions and Attitudes
Context and Rationale
Aboriginal and northern communities face a variety of unique challenges that place pressure on social cohesion and social capital that are necessary for a community to thrive. While it is clear that higher levels of educational attainment increase social capital and social cohesion, educational attainment must be met by opportunities at the community level. Furthermore, if community members see a place for themselves within the community, they are more likely to achieve success in education. Civic Conceptions and Attitudes provides us with an assessment of the attitudes of young people towards their community, and provides a perspective on the way that young people see their connection to the community.
Assessment
This indicator connects education to the community level. It allows us to assess the attitudes that individuals have towards the community, particularly attitudes of young people. This indicator is comprehensive as it allows us to measure aspects of governance, health and well-being and the economy. It allows us to determine the larger state of population well-being and tells us about the attitudes of individuals within the community to that community and to the larger world around them. The Civic Conceptions and Attitudes indicator is currently being used internationally by the Institute on Education Statistics to compare factors leading to education success across international jurisdictions.
One of the major challenges of this indicator is the development of measures that are relevant to the community context, making an assessment of the data is difficult, unless the data is compared to other communities or to individuals in other provinces. This indicator would need to be revised from its current state under the Institute of Education Statistics to make it relevant to the communities in which INAC is currently delivering education programs.
A second weakness of this indicator is that it does not allow attribution of outcomes to a specific condition. For example, low levels of civic attitudes does not necessarily mean that the education system does not foster a sense of these ideas, but that there are perhaps other socio-economic conditions in place that are playing an effect.
7. Community Involvement in Education
Context
Similar to parental and family involvement in education, community engagement with education programs is increasingly being examined as a critical influence on educational outcomes. The strong tie to community and culture inherent in many Aboriginal communities provides good reason to measure community involvement in education. The level of a community's participation can be measured in a number of ways. One way is to track the number of participants (in terms of parents, elders, community leaders, etc.) in school governance activities. This includes participation on parental councils, boards of trustees, post-secondary boards, provincial education committees, task forces and school administration.
Rationale
Community involvement in education provides a rich context of educational development. The level of community involvement may have a profound effect on the overall education program, both in terms of creating support for students and learning in the community, but also in terms of shaping the curriculum and educational system toward the development of more culturally relevant programming, both inside schools and in the community at large. Furthermore, community involvement in education contributes to high quality learning opportunities that are responsive, flexible, accessible and affordable to the learner by providing strategies that facilitate increased participation by Aboriginal and northern parents, students, communities and organizations in working to support academic success. Moreover, this indicator promotes system transparency, effectiveness and responsiveness.
Assessment
The Community Involvement in Education indicator is largely a governance indicator. While it does not assess the extent of self-determination in the education system, it presents a picture of the extent to which individuals in the community are involved in dialogue concerning educational performance. Measuring the level of community involvement may involve the distribution of a questionnaire that reveals the extent to which individuals feel that they have a stake in the education system and can influence its direction.
It is important to note that community involvement does not guarantee success of the education system. This indicator must be integrated with proper funding to support the development of in-school community resources and programs that enhance the family context for learning. Furthermore, the extent of education governance activities at the community level will differ, and so it is difficult to compare this indicator across communities. Reliability of this indicator is still uncertain as it does not seem to be something which is widely used by other jurisdictions. The indicator is valid insofar as self-reliance and self-determinants in education has been proven to positively influence educational success.
8. Early Development (School Readiness)
Context
The degree to which a child is ready to learn at school predicts how well they do at school. Many children may enter school with significant limitations in their social, cognitive, emotional and psychological condition which may present barriers for coping with the school and community environments. These conditions are particularly pronounced in many Aboriginal communities where social barriers resulting from intergenerational trauma and poverty mean that the child is beginning the most vital years of educational development significantly behind. These factors may place significant stress on the child, the classroom, teacher and parents.
Rationale
Early Development (School Readiness) is an indicator that has been developed by various organizations offering different potential measures. It "refers to a child's ability to meet the task demands of school such as playing and working with other children, listening to the teacher, remembering and following rules, and being comfortable exploring and asking questions."[Note 93] In this report, we refer to the Offord Centre for Child Studies Early Development Index (EDI). EDI is used in Canada to measure school readiness using five domains: Physical health and well-being; social knowledge and competence; emotional health/maturity; language and cognitive development and general knowledge and communication skills.
Assessment
The domains in the EDI are distinct but also interact with and reinforce each other. It takes about 20 minutes to complete by the teachers and educators who work with the students. To date, the total number of children in the database is approximately 293,000. The system is already well developed, but would require a roll out to Aboriginal and northern communities. The EDI can report on population of children in different communities, monitor populations of children over time and predict how well they will do in primary school. Another benefit of the EDI is that it measures readiness outcomes of the early years, while at the same time providing information on the child's readiness to learn at school.
School readiness is a strong indicator because it allows us to assess "readiness" on multiple levels including the school's readiness for children, and the ability of the family and community to support optimal early child development. Awareness of early childhood development and school readiness allows us to enhance and improve community awareness of problems, parent education, professional development for child care teachers, quality of child care environment and programs that facilitate a child's transition into school.
9. Participation in Job Related Training
Context
Education programs are meaningful for a community when they support the individual throughout his or her lifetime. In developing performance measures for educational programs in Aboriginal and northern communities, it is important to integrate adult education and the link between education and employment. Building a successful education system involves moving beyond basic primary and secondary education to include the development of skills and knowledge necessary to become a full participant in the local and national economy. Educational attainment must translate into employment outcomes and opportunities.
Rationale
Research shows that employers can benefit from job-related training through increased labour productivity, while employees stand to gain through improved job performance, higher wages and improved career opportunities.
The Participation in Job Related Training indicator comes from the Canadian Council on Learning Composite Learning Index and is used to measure the ability of working age Canadians – employed or unemployed – to maintain and develop the skills needed to compete in the economy through courses, workshops, seminars or training related to a current or future job.
Measuring participation in job related training allows us to assess the extent of education resources in the community and the supports available to its members. Measuring participation in job related training is a simple assessment of the extent to which: There are resources available to support employment; there is a diversity of resources to support skills development in the community and citizens are pursuing various forms of higher learning to prepare them to fully participate in the economy.
Assessment
The indicator is a proven marker of lifelong learning, and more specifically of adult learning and development. Because it is an existing measure, there is data available from across Canada that can be used to compare Aboriginal and northern communities with other Canadians.
This indicator is concrete and valid, and while there is some question regarding what one would consider falling under "job-related training," the parameters can be modified. It can also be consistently measured over time, showing progress in this domain. Data from such an indicator can further be disaggregated across gender and age groups.
10. School Life Expectancy (SLE)
Context and Rationale
All Aboriginal groups share the problem of low educational attainment and a large gap with the non-Aboriginal population.[Note 94] The School Life Expectancy (SLE) indicator allows us to observe not only how the Aboriginal population compares to other Canadians, but how it compares to other countries.
SLE is defined as the total number of years of schooling that a child can expect to receive in the future, assuming that the probability of enrolment in school is equal to the current enrolment rate for that age. It can also be defined as the average number of years which a child at the official school entry age is likely to spend in the education system. The indicator can suggest the potential educational attainment of the future adult population, thereby informing forward looking policy decisions.
Assessment
The SLE Indicator has three valuable features. First, it allows us to compare the size of the student population by level of education using a simple and common scale: number of school years. Second, the indicator allows comparison of post-secondary programmes. Third, the indicator can be disaggregated by gender and by geographical location.
The weakness of this indicator is that the years spent repeating grades is also included in SLE and should be taken into account when interpreting the indicator. As a result of this factor, the indicator does not represent the average number of grades completed as it represents the years spent in education and not the number of grades successfully completed. This may make it less sensitive to learning achievement. As such, this indicator is best assessed when used together with other indicators such as percentage of grade repeaters.
8.3 Overall Synthesis and Analysis
The goal of the education indicators discussed in this chapter is to provide measures which are applicable to various demographics and to a variety of education levels. Access to Learning Institutions, for example, applies to primary, secondary and post-secondary education, while Civic Conceptions and Attitudesare important measures not only for youth, but for adults as well.
Another goal of the proposed indicators is to illustrate the importance of formal and experiential learning. Formal learning can be assessed through such indicators asSufficient Resources, Satisfaction with Quality of Basic Education System, andSchool Life Expectancy, while experiential learning is assessed through an understanding of Supportive Family Contexts, Civic Conceptions and Attitudes as well as Early Development. The indicators focus on measures of those aspects of learning which prepare the individual from the beginning of their development to be a self-sufficient and participating member of society.
Examining the success of education programs from a holistic perspective and integrating the individual, family and community context across all levels of education is a complex task. It is therefore difficult to limit performance measurement to a short list of indicators. Thus, the above headline indicators are by no means exhaustive, yet they illustrate important contextual elements that must be accounted for in measuring the success of programs:
- Communities and families are critical to the success in student achievements.
- Personal satisfaction with the education system informs us of the needs
of the community.
- Resources must be present inside the classroom, but supportive environments
for learning must also be created in the community and in the home.
- Education is critical for developing attitudes towards the community, but the community must work to provide spaces and places in which individuals can feel a connection – this includes the development of appropriate jobs and resources to gain skills in those jobs.
8.4 Broad Application
Education is linked to a number of the other thematic areas presented in this report. Specifically, Infrastructure, Health and Well-Being and Economy are key areas in which there is a significant connection to educational attainment. From an economic perspective, for example, communities with little capacity for long term economic development will experience difficulties in improving education.
9. Economy
9.1 Introduction
Economic development is a fundamental component of a healthy community. It generates financial wealth, provides social security and contributes to the quality of life. Moreover, economic development is one of INAC's priorities, a healthy economy being one of the Department's Strategic Outcomes. The following indicators have been selected as appropriate for measuring economic success in Aboriginal and northern communities.
Measures of Wealth
1. Gross Domestic Product
Context
Gross Domestic Product (GDP) measures a region's production which makes it an appropriate indicator with which to measure economic development in Aboriginal and northern communities.
Rationale
While this indicator does not account for either social or environmental costs of production, it remains a powerful indicator for economic development. It measures the total production of goods and services. Strong and steady growth in GDP indicates a healthy economy.
Assessment
While it is a conventional economic indicator that is comparable, valid, reliable and feasible, GDP has its limitations. It fails to consider activities outside the market economy that may be contributing to the overall wealth of the community including domestic and volunteer labour. It does not provide rich, contextual data, which is critical to describing economic development in the Aboriginal and northern contexts. However, when combined with other, more detailed economic indicators identified in this chapter, one can approach an understanding of economic development in Aboriginal and northern communities.
2. Adjusted Net Savings
Context
When working towards economic development within Aboriginal and northern communities, the goal is to create a sustainable economy. This is especially important in communities that are heavily resource dependant and thus need to focus on economic diversification.
Rationale
While GDP measures current wealth, Gross National Savings – the measurement of the rate of savings in an economy – is imperative to long-term economic growth. Unlike GDP, this indicator does consider both social and environmental contributions and costs. Adjusted Net Savings, developed by the World Bank and used by the United Nations, is an indicator for sustainable development, as it takes into account investments in human capital, the depletion of natural resources and damage caused by pollution. This indicator expresses the exploitation of resources and pollution as disinvestments and the development of a skilled workforce as an investment.[Note 95]
Adjusted Net Savings is calculated by making four adjustments to Gross National Savings: 1) estimates of depreciation of fixed capital are subtracted; 2) education expenditures are added as corresponding values of human resource development to investment, 3) estimates of resource depletion are subtracted and 4) approximations of pollution damages are subtracted. This method of calculating wealth reflects the trade-off between economic development and the environment.
Assessment
Like GDP, Adjusted Net Savings fails to consider economic activity outside of the market economy. Also, due to its complexity, conducting an assessment of a community's adjusted net savings may prove costly; however, the information required can be captured using environmental indicators including land degradation, air quality, water quality and greenhouse gas emissions. This indicator provides rich data while still remaining comparable, valid and reliable. Given its consideration for capacity-building and the environment, this indicator is crucial to measuring success in Aboriginal and northern contexts.
3. The Presence of a Commercial Economic Development Organization
Context
capacity building and institutional development remains a priority in Aboriginal and northern communities.[Note 96] A Harvard study of 67 Aboriginal communities explains that institution building is important, if not the critical difference between successful and unsuccessful economic development.[Note 97] Because governance in Aboriginal communities is often evolving, support and technical assistance is becoming more and more pertinent. An organizing body that is able to carry out this role is thus imperative to economic success. The presence of a commercial economic development organization satisfies the need to encourage and enhance Aboriginal control over economic development.
Rationale
A commercial economic development organization can contribute to and coordinate the pursuit of appropriate economic development projects, the community planning process, the development of qualified people, the engagement of youth and the development of relationships of trust between stakeholders. In the absence of Aboriginal financial institutions, this organization can coordinate efforts to help Aboriginal people gain access to capital, a critical component to economic development. Additionally, this coordinating body can provide information on economic development activities and employment opportunities to the public, a procurement guide to suppliers and an Aboriginal business directory. It can facilitate knowledge-sharing and communicate success cases.
Several limitations to this indicator exist. It is not sensitive to the stage of development of an organization. If the organization is fully operational, effective and efficient, the environment for economic success can be said to exist. This method of measurement is somewhat subjective and obscure and, therefore, neither comparable nor reliable. The need for a coordinating body, however, is prevalent in the literature on economic development in Aboriginal communities. For this reason, the presence of a commercial economic development agency is a significant indicator for economic success.
4. Aboriginal Communities' Involvement in the Non-Aboriginal Economy
Context
Sharing best practices and information and building networks contribute to economic success, particularly in Aboriginal communities. This sharing and networking occurs when Aboriginal people participate in the non-Aboriginal economy.
Rationale
Aboriginal communities' involvement in the non-Aboriginal economy helps Aboriginal businesses become more efficient and profitable. This participation can be achieved by negotiating employment and contracting agreements with major employers, through mechanisms to match Aboriginal people with opportunities, employment equity and anti-discrimination policies and programs.[Note 98] One such success story is the Aboriginal community of Miawpukek, Newfoundland and Labrador. This community has expanded employment opportunities for partnerships with non-Aboriginal business. They are working with businesses off-reserve and helping those businesses become familiar with working with Aboriginal peoples.[Note 99]
Assessment
Similar to the Presence of a Commercial Economic Development Organization, the indicator, Aboriginal Communities' Involvement in the Non-Aboriginal Economy, proves difficult to measure since quantifying participation of Aboriginal people employed in the non-Aboriginal economy alone does not suffice. A qualification of this participation provides a more comprehensive picture of economic success. This qualification makes the indicator less comparable and reliable; however, it creates validity for each individual community and generates rich data.
5. Good Governance
Context
Aboriginal communities' vulnerability to instability, factionalism and a lack of separation of business and government deters investors from pursuing business opportunities in the community. Instead, open relationships based on trust, inclusiveness and transparency have been identified as imperative to successful economic development.
Rationale
To help foster these qualities, Good Governance has been identified as an indicator of economic success.[Note 100] This indicator includes components such as: strategic vision, authority and capacity for solving community problems, transparency and accountability, rule of law, government effectiveness, self-determination and intergovernmental relations (upon which the Governance Thematic Chapter elaborates). Self-determination is of particular interest for economic success. Because the transfer of control tightens the link between decision-making and consequences, communities have strong incentives to make sound and appropriate development decisions. Through self-determination, the community bears the costs and reaps the benefits of its decisions.[Note 101]
Assessment
Not only is Good Governance an important indicator for the reasons mentioned above, but it also helps to reduce reporting burden. Because the sub-indicators of Good Governance (strategic vision, authority and capacity for solving community problems, etc.) should be measured to determine the success of governance within the community, the information will be available. For this reason, this indicator has the potential to be cost-effective and feasible. The coordination of the data collection may prove challenging; however, with clearly defined roles and responsibilities as well as open communication, the information can be easily shared. The Thematic Chapter on governance discusses the strengths and limitations of the sub-indicators of Good Governance.
Employment
6. Employment-to-Population Ratio
Context
This indicator depicts the proportion of a country's working-age population that is employed. Unlike the unemployment rate, which analyzes the entire labour force, the employment rate denominator is the source population, which includes all working-age people (excluding those in the military and prison institutions). While the source population grows fairly steadily from one year to the next, the labour force fluctuates as people become encouraged or discouraged by prevailing economic conditions.[Note 102]
Rationale
This indicator provides information on a community's ability to create employment and, consequently, generate wealth. Communities with higher employment rates are likely to have higher standards of living because many economic development activities emerge from outside Aboriginal communities. [Note 103] Employment-to-Population Ratio can be analyzed according to gender and age in order to assess differences in labour market activity.[Note 104] Given the inequities in many Aboriginal communities, these analyses may provide useful information.
Assessment
This indicator is comparable, feasible and reliable. Its validity, however, fluctuates when the indicator is used to analyze gender and/or age differences in the labour market and inferences are made based on this analysis. This indicator does not consider labour outside the market economy such as volunteer and domestic labour; however, the following indicator, Vulnerable Employment, addresses this limitation.
7. Vulnerable Employment
Context
Aboriginal communities face particularly high unemployment rates compared to non-Aboriginal communities. These rates are even more prevalent among Aboriginal women. Thus, within the Aboriginal context, it is important to measure unemployment at a personal or household level to fully understand areas that require attention.
Rationale
This indicator includes own-account (self-employed) workers and contributing family members within the concept of employment addressing this need. It provides information on the number of people who are vulnerable to economic risk because of weak institutional employment arrangements. Own-account workers and contributing family members are considered vulnerable as they have no formal work arrangements. This indicator could, however, extend past own-account workers and contributing family members to include all workers with weak employment arrangements, which is common in many Aboriginal communities. Vulnerable Employment reflects low degrees of job security, lack of access to social security and other factors associated with persistent poverty.[Note 105]
Assessment
Vulnerable Employment is an inclusive indicator that accounts for formal and informal employment. It is comparable, feasible, reliable and valid. It provides the rich and contextual data required to paint the entire employment picture.
8. Coordination and Consultation
Context
Coordination and consultation among all partners and stakeholders is a necessary component for economic development. The need for healthy relationships is especially important in Aboriginal and northern communities where government funding plays a paramount role. Thus coordination across various departments and levels of government is crucial to ensure that money is allocated appropriately.
Consultation also needs to occur between the public and private sectors as economic development cannot occur through government funding alone. These relationships are particularly important in northern communities where private companies are increasingly investing in natural resources. Without government's ability to form strong relationships with the private sector, the potential benefits for local communities may be lost.
Rationale
Coordination and consultation is a necessary component to ensure all partners and stakeholders are considered for economic development. Moreover, it is through creating these relationships that economic diversification can be achieved, thus ensuring a more stable and sustainable economy.
Arguably the most important element to Coordination and Consultation is not in forming relationships, but in monitoring the progression and effectiveness of partnerships. This indicator aims to evaluate this progression in addition to acknowledging the initial consultation. Many current measures of partnership building are quantitative in nature (ie. number of meetings attended, number of people present, etc.). While simple to collect this type of measurement fails to address whether anything tangible has resulted from these meetings. Thus, this indicator strives to be a qualitative assessment of this effectiveness.
Assessment
Coordination and Consultation aims to address a critical element of economic development, thus increasing its appropriateness to communities. However, its strength as an indicator is somewhat lacking. This is due to the complexities associated with measuring effectiveness. More specifically, determining benchmarks for what is deemed a successful relationship will vary depending on partners, the community and the issue at hand. Moreover, while information on partnerships, especially within government, may be accessible, the content of the meeting may be considered confidential. This makes measurement considerably more challenging.
9. Technology, Research & Development
Context
Technological progress and Research and Development (R&D) are two areas which affect long-term economic growth. As Aboriginal and northern communities look to develop new industries, it is crucial that technology and R&D receive investment.
These two areas are especially important when looking to develop new, sustainable industries. For example, some Aboriginal and northern communities are now investing in Hydro and wind power and many northern communities are mining natural resources, Through proper technology, research and development, these communities will be equipped to conduct these practices and develop healthy economies.
Rationale
Technological progress, research and development are elements that drive long-term economic growth. Through these channels productivity and competitiveness can increase. Additionally, improvements in technology can lead to improvements in the quality of life and sustainable practices.[Note 106]
Assessment
Technology and research and development are measured quantitatively by dollar amount of funding into projects. This indicator is strong in that the information is easily accessible and due to its quantitative nature, comparability over time is possible. Moreover, it is both valid and reliable. While this indicator is strong, it is lacking qualitative assessment, specifically relating to whether the research being conducted is providing useful information.
10. Access to Markets
Context
For an economy to grow, it requires both physical and economic access to markets. While these are somewhat different challenges, they are very closely correlated. Many Aboriginal and northern communities are located in remote areas. This creates physical challenges when trying to import or export goods and services. Due to this physical limitation, economic access to markets is in turn negatively affected.
Access to markets from an economic perspective must also be considered when a community is looking to enter a new area. Again, due to additional transportation costs, some communities must take into careful consideration their ability to generate profits. Small businesses (which comprise the majority in Aboriginal and northern communities) are already facing challenges of economy of scale. The additional cost of transport is especially encumbering.
Rationale
Access to markets generates the potential for "access to capital, markets, skilled labour, networks, technology, competitively priced goods and services and fresh perspectives…high levels of openness can also spur productivity improvements."[Note 107] The ability for a community to access external markets is imperative for economic growth. Moreover, it provides the community with fresh perspectives and allows the community to share its ideas.
Assessment
The "physical" component of access to markets is measured quantitatively through assessing the quality and cost of transportation access to and from communities, including air, road and train, among others. This indicator is considered strong, as information is available and can be tracked over time. Access to markets from an economic perspective is also measured quantitatively by assessing import and exports from a community. However, while this indicator can be measured and compared over time it is limited by the fact that it does not encompass traditional trading practices present in some Aboriginal communities.
11. Infrastructure
Context
Infrastructure is a necessary component for economic growth and sustainability. In many Aboriginal and northern communities across the country there is a severe lack of infrastructure. This is particularly evident in northern communities, for example, where housing shortages have left people living in substandard conditions. Without a proper home there can be an increase in health problems due to proper sanitation, leading to a reduced workforce and an increased number of dependants on employment insurance.
Rationale
If construction is occurring within a community to improve current infrastructure or develop new infrastructure it will positively impact the economy either directly or indirectly. Indirectly, the improvement of current infrastructure increases a community's overall value as does the development of new infrastructure. The development of better roadways, airports, trains and other transportation infrastructure that allow for greater access to markets is also positive for economic development (the importance of access to markets is discussed in further detail under the economic indicator Access to Markets). Moreover, new or improved schools and training facilities also affect the economy by increasing the number of workers equipped to enter into the knowledge economy in a region. Examples of direct economic developments may be the construction or improvement of buildings that house economic activity (businesses).
Assessment
Proper infrastructure lays the foundation for a healthy economy and ultimately a healthy community. It is with this understanding that infrastructure was given attention in the context of economic development. However, it is also recognized that due to the large and complex nature of this indicator, there are many different factors to consider for complete and successful measurement. The reader is encouraged to refer to the Infrastructure chapter of this report for more detail in this area.
9.2 Conclusion
The approach taken to economic development within the scope of this project is one that is both comprehensive and holistic. Instead of focusing on output indicators, which are often used to characterize indicators of the economy, this approach urges analysis of the entire economic policy story from the initial economic action plan through to long term growth and sustainability. The indicators in this chapter have been selected for their ability to measure the direct and indirect factors affecting the economy. While this is viewed as a strength given the community focus, it can also be a limitation as they are not always comparable or reliable.
10. Governance
10.1 Introduction
Governance is the cornerstone upon which prosperous nations are built. Governance occurs through interactions among institutions of government, processes and traditions that determine how power is exercised, how public policy is created, and how citizens or other stakeholders engage in public life. The Institute on Governance broadly defines Governance as:
[T]he traditions (norms, values, culture, language) and institutions (formal structures, organization, practices) that a community uses to make decisions and accomplish its goals. At the heart of the concept of governance is the creation of effective, accountable and legitimate systems and processes where citizens articulate their interests, exercise their rights and responsibilities and reconcile differences.[Note 108]
Hence the scope of this thematic area is one that necessarily applies across INAC's program areas in which services are delivered with the objective of supporting First Nations, Métis, Inuit and northern communities to build capacity for strong and independent communities.
There is no one perspective on Aboriginal Governance. Rather, Aboriginal and northern communities engage in diverse forms of political and social organization. Despite this diversity, however, Aboriginal and northern people share common aspirations for strong and self-sufficient governance. According to the Report of the Royal Commission on Aboriginal People:
This diversity is also reflected in Aboriginal peoples' visions of governance. However, these visions have a common core. Ultimately, Aboriginal people want greater control over their lives. They want freedom from external interference. They do not want to be dependent on others. They want to realize their own visions of government.[Note 109]
As Aboriginal communities in Canada continue to grow, the need for strong Aboriginal governance structures that have the capacity to bring individual and community well-being to parity with other Canadians becomes more pressing. The links between governance and social development in the areas of health, economy, environment, education and infrastructure in Aboriginal communities are well-documented in the governance literature. For example, in their 2001 study among First Nations bands in BC, Chandler and Lalonde found that suicide rates and patterns were lower among those communities that had made progress toward self-government and land claims and had control over social services such as health care, education, police and fire.[Note 110] Likewise, a special study from the 2007 Standing Senate Committee on Aboriginal Peoples reported that "without effective, responsive institutional arrangements capable of sustaining development, extending accountability, outlining fair administrative practices, giving greater control over planning decisions and investment resources to communities, and providing appropriate capacity for financial support, sustained economic development cannot occur."[Note 111]
Throughout the research, four sub-categories of governance activities were identified that provide a general scope for this broad thematic area:
- Principles of Good Governance;
- Strong Institutions of Government;
- Self Government Agreements and
- Strong Intergovernmental Relationships
These categories emerged from the literature at the international level (such as work done by the United Nations Development Programme), non-governmental organizations in Canada (such as the Institute on Governance) as well as the Strategic Outcomes for the Department, particularly under the SO area of The Government which aims to support "good governance, effective institutions and co-operative relationships for First Nations, Inuit and Northerners."[Note 112] Together, the categories provided us with a platform for selecting indicators that can help in understanding the governance capacity of Aboriginal communities.
10.2 Findings
1. Strategic Vision
Context
Good governance starts with a strategic vision. It is from this vision that a community can steer itself in the present and into the future. The National Centre for First Nations Governance (NCFNG) describes strategic vision as:
[T]he shared, long term dream of the People – the future state that the People hope to achieve collectively. Vision charts the course from where the People are to where they want to be and is relevant to those in the present time and to those in the future seven generations.[Note 113]
It is important that a community's strategic vision be rooted in the values and beliefs of the community and that the vision reflects the distinct culture of its members. Strategic vision is applicable and relevant when it is informed from the "ground up." According to the Institute on Governance, "community engagement can be considered the heart of a strategic vision."[Note 114] Strategic vision has to be built from within the community as a collective. Only then can it form the basis of good governance and become the foundation from which strong nations are built.
A strategic vision guides a community from being reactive to proactive. A reactive community emphasises short-term pay-offs while a proactive community seeks future gain.[Note 115] Communities that work towards short-term pay-offs may result in an unstable investment environment due to a lack of long-term planning whereas proactive communities which strive for future pay-offs are more politically stable and therefore desirable partners in economic development and community planning.
Rationale
A strategic vision is a framework that requires three key tools:
- A strategic plan lays out the community's vision, define
the roles that institutions and individuals would play, and articulates
the goals of the community [Note 116];
- the development of an organizational system stems from the
strategic plan to aid in the execution of government programs and services
and
- community engagement is a central element of good governance; therefore, a strategic vision needs to be easily communicated to community members to ensure their buy-in.[Note 117]
Strategic vision can be measured through a qualitative survey that measures:
- The participation rate of citizens in strategic decision-making;
- the availability of a strategic plan with clear goals;
- milestones articulated in the strategic plan that are to be accomplished
and
- resources available to leaders/representatives to develop and institute the strategic vision (resources can be educational/financial/human resources)
Assessment
Strategic vision lays out the framework for a community's governance practice and is therefore, an excellent measure for good governance. It is from the strategic vision that institutions of government are built and from which the goals of an institution will be carried out.
However, in order to develop and carry out the strategic vision, a community requires the capacity and resources to form a plan, a governing body for execution, and methods with which to engage residents. Inadequate funding for initiatives that support the development of a strategic vision can pose serious challenges to a community's ability to govern effectively. If, however, adequate funding is available, and/or partnerships with organizations can be leveraged to develop a strategic vision, then the availability of information with which to measure this indicator will be easy to obtain, such as a strategic and organizational plan and community engagement strategies. Milestones achieved on the strategic and organizational plan can be measured and the degree to which residents are engaged in the strategic and organizational plan can be assessed.
2. Transparency and Accountability
Context
Governments that ensure transparency in decision-making, leadership selection and other political processes are more stable and effective in meeting the needs of the community. Governments that lack transparency and accountability are often ineffective because they are not supported by their constituents. Community members mistrust the leadership of government and feel disenfranchised and disengaged. When citizens are disengaged, the community may experience deficits in areas such as community health, investment and economic development, and education standards– areas where many Aboriginal communities currently face challenges. According to the National Centre for First Nations Governance, one of the challenges identified by First Nations communities is the lack of citizenship participation in nation-building activities.[Note 118]
Rationale
The degree to which a government is transparent and accountable is linked to the extent to which citizens have a voice in the governing processes, and the degree to which the voice of the public is heard and legitimatized. Citizens that have a voice in the decision-making process are more likely to participate.[Note 119] By openly sharing process and procedures, citizens can observe how decisions are made in a fair and just manner. Transparency also ensures the minimization of preferential treatment and private interest over public good.[Note 120]
Linked to transparency is accountability. "Economic and financial accountability [is] brought about by efficiency in resource use, expenditure control, and internal and external audits."[Note 121]
Assessment
Transparency and accountability as an indicator has strong application to good governance. Governments that institute open transparent processes and that are accountable to the public demonstrate to citizens that decision-making processes are fair. Citizens are more likely to engage with a transparent and accountable government and create a voice for themselves.
However, measuring transparency and accountability requires significant financial and human resources.[Note 122] Governments may not have the capacity to distribute accountability material to citizens, such as financial audit reports and this information may be difficult for citizens to understand.
Furthermore, the performance measurement data is not simple to interpret or obtain. Aboriginal communities have distinct culture and community practices, which means that universal data collection may not be the best approach. Furthermore, there are many Aboriginal communities that fall somewhere between having no capacity and having more than sufficient capacity to collect data. Possible ways for measuring the dimensions of the Transparency and Accountability Indicator include:
- The frequency with which information on government decision-making is
shared with citizens (i.e. pamphlets distributed to members of the community,
information on websites, if available, etc.);
- performance measurements that identify the effectiveness of government
decision-making and the delivery of services; and
- financial resources and training provided to the community to collect data.
3. Self-determination
Context
The authority and capacity for Aboriginal communities to make decisions about their future is critical to overall well-being. Historically, Aboriginal governance and self-determination has been restricted under the Indian Act. Although the Indian Act has undergone some reform, it has been argued that this governing framework has created a sense of helplessness and a state of dependency by many Aboriginal communities on the Government of Canada restricting the ability of communities to self-govern.[Note 123]
Rationale
Aboriginal communities are now in a position to seek sovereignty through self government agreements with the Crown. Self-determination is necessary for strong Aboriginal governments to take root as it allows a community to determine its own future. In doing so, citizens are able to buy into the future of their community. Citizens that are engaged with their community can participate actively in nation-building, which attracts robust economic development and can lead to other positive outcomes.[Note 124]
Self-determination includes "self government agreements, participation in land claims, number of community based and ‘controlled' or administered institutions (restorative justice, policing, health, social etc)."[Note 125] The ability of a community to control its own governing structures and services enables it to be independent and to ensure the wellbeing of its membership. For example, the Assembly of First Nations ties self-determination to community health.[Note 126]
Assessment
Self-determination is an excellent measure of good governance. Self-government agreements are one area where INAC can assist Aboriginal communities to achieve self-determination through agreements that devolve full taxation power and other community services such as primary health and education.
One weakness, however, is that self-government agreements take a long time to negotiate, sometimes up to thirty or forty years; therefore, collecting information on self-government agreements may be limited to inputs rather than outputs or outcomes until an agreement is reached. Measurements for this indicator may include the following:
- Number of self-government agreements,
- number of resolved land claim agreements and
- number of services in the community that are administered by Aboriginal governments as per cultural norms and values.
4. Authority and Capacity for Solving Community Problems
Context
One of the most pressing problems facing Aboriginal and northern people in Canada today is a lack of capacity to effectively address worsening social conditions through organizational and administrative processes that are specific to the needs of communities. Cornell and Kalt argue that "[o]ne of the unfortunate consequences of a century of federal control of Indian nations is the legacy of institutional dependency, a situation in which tribes have had to rely on someone else's institutions, someone else's rules, someone else's models, to get things done."[Note 127] Aboriginal and northern communities may not be able to address worsening social conditions because they lack the flexibility in authority and resources to address community problems.
Findings from the Harvard Project on Indian Economic Development and the Native Nations Institute for Leadership, Management, and Policy reveal that successful nations "assert the power to make core decisions about resources, policy and institutions. Lack of control in these domains soon traps Indian nations in dependent poverty."[Note 128] In order to transform Aboriginal and northern communities into healthy, self-sufficient and successful social enterprises, they must be supported in making their own rules and their own models for problem solving. Assisting communities to build this capacity for governance will help ensure that accountable and effective decisions are made for the benefit and well-being of the entire community.
Rationale
The Authority and Capacity for Solving Community Problems indicator measures the extent to which a community is able to harness and use appropriate methods to identify problems and implement solutions to issues arising from the development and implementation of an activity or program. According to Cornell, Curtis and Jorgensen, "much of a government's time is spent making decisions, small and large."[Note 129] Therefore, having the authority and the capacity to undertake decision-making is essential for social and economic development in Aboriginal and northern communities.
In the Final Report of a Governance Think Tank, The National Centre for First Nations Governance (NCFNG) identified trust between community members and leaders as a key challenge for good governance in the First Nations communities from which participants were drawn. [Note 130] In order to be effective problem solvers, community leaders must maintain the confidence of both the citizenry and the governing administration to demonstrate that they are making decisions for the benefit of the entire community. In this way, the Authority and Capacity for Solving Community Problems indicator has considerable overlap with other governance indicators such as Transparency and Accountability and Rule of Law. Ways of measuring the degree to which community leaders have the authority to solve community problems include:
- Evidence that the leadership can attain consensus among its leadership
and constituents,
- open and fair leadership selection processes,
- degree to which information on problems is shared and carried out through
to implementation of the solution and
- degree of flexibility of problem solvers.
Implementing decisions is a crucial element of effective governance. Therefore, measuring the capacity to do so is critical for gaining an understanding about community development. Without available resources (both human and financial) to identify and act on problems, many communities will continue to face barriers to independence. Ways of measuring capacity for solving community problems include:
- Number of identified persons as key or expert problem solvers,
- adoption of a problem solving process,
- access to information that supports good decision-making and
- the time it takes from identification of problem to implementation of solution (relative to the scope of the problem).
Assessment
Inherent in the Authority and Capacity for Solving Community Problems indicator is what the Harvard Project calls "cultural match." This indicator is flexible insofar as it can be used to measure good governance practices in a variety of organizational structures and cultural settings. However, little data exists for the specific measures of this indictor. It is therefore necessary for communities and INAC programs to collect data.
5. Government Effectiveness
Context
Supporting Aboriginal and northern governments to build effective institutions is integral to building strong and healthy communities. Findings from the Harvard Project on Indian Economic Development and the Native Nations Institute for Leadership, Management, and Policy suggest that"successful Native nations establish long-lived institutions that limit political opportunism and administer the practical business of the community effectively."[Note 131] In Canada, several Aboriginal groups are working with INAC and the provinces to construct strong Aboriginal governments. To date, Twenty-one comprehensive claim agreements, covering roughly 40 percent of Canada's land mass, have been ratified and brought into effect since the announcement of the Government of Canada's claims policy in 1973.[Note 132] As negotiations of comprehensive land claims and self-government agreements continue, the Government Effectiveness indicator can assist INAC to ensure that strong, long lasting Aboriginal governments emerge from negotiated agreements.
Effective institutions of government that support good governance practices and good decision-making have wide reaching implications for Aboriginal and northern communities. According to the Institute on Governance, "the structure of the state and its institutions bear a significant impact on the overall growth of the economy. It follows that the strength of policies originating from the state will determine the pace of economic development."[Note 133]Thus ensuring that an institution effectively delivers services and redistributes wealth equitably is integral to achieving progress in a community.
A major challenge in building strong and independent Aboriginal governments is building institutions that match community concepts of traditional governance. Much of government effectiveness results from the strength of the bureaucracy and the degree it supports decision- making. However, Aboriginal groups have different needs and institutional arrangements which take many forms based on diverse historical, cultural, political, and economic circumstances. The bureaucracy must therefore be reflective of the larger cultural context in which it operates.
Rationale
Simply put, the Government Effectiveness indicator aims to measure the extent to which a governing institution gets things done. Governance effectiveness, through effective policy and a strong bureaucracy are the foundations for building governance capacity. The Government Effectiveness Indicator therefore aims to measure the extent that a community can develop policy and deliver services to community members that are in line with the community's strategic vision and the needs of all community members.
The NCFNG Governance Think Tank Report revealed that a key challenge to governance in First Nations communities results from the "deskilling of people through the creation of band councils and western representative democracy models."[Note 134] Thus, the Government Effectiveness indicator focuses on measures that promote traditional governance structures that fit with Aboriginal concepts of governance. This includes measures of how knowledge about traditional forms of governance are integrated and passed down through the bureaucracy as well as the presence of a knowledgeable Aboriginal leadership.
Assessment
The Government Effectiveness Indicator is rooted in the view that a government administration must reflect the cultural context of the community and promote social cohesion between government and community members. That is to say it must have a degree of "cultural match." According to Cornell and Kalt "where cultural match is high, the institution of governance will have a high degree of support in the community."[Note 135]However, measuring social support for institutions necessarily involves meaningfully engaging the community in conversations about its government. This may take the form of focus groups, and interviews or other qualitative methods. One strength of these methods of data collection is that they can capture important information that may be omitted from administrative records. However, they may be costly and time-consuming. Data for this indicator can also be collected using administrative file review. Although the UNDP notes that while data is highly accessible, it can often be unreliable. Several ways to measure Government Effectiveness include:
- Established constitution and "community law" that reflects
the historical, cultural and social context of the community,
- the number of Aboriginal peoples in leadership roles,
- degree to which elders and youth are engaged in decision-making,
- the proportion of total public revenues allocated and managed at
the community level,
- timely implementation of First Nations and Inuit policies and legislation,
- procedures to hire and promote staff based on merit and qualifications
and
- the extent to which the institution promotes learning opportunities for the executive and administrative staff.
6. Rule of Law
Context
According to the NCFNG, "when individuals abide by the laws of the Land they validate the legitimacy of the governing authority. The Rule of Law provides clear instruction on acceptable behaviour – behaviour that benefits the community and the recourse when behaviour is unacceptable."[Note 136] This behaviour applies to both citizens and governments and helps to mitigate corruption and violence. When the Rule of Law is firmly established in a community, governments maintain a higher degree of legitimacy, and may have more flexibility to make important decisions on behalf of the community. Without regard for this foundational principle of good governance, institutions risk losing the legitimacy of their citizenry, as well as that of other governments and stakeholders. Thus the Rule of Law, as an indicator, is highly related to indicators of Transparency and Accountability, Government Effectiveness and Corruption.
Rationale
Protection of the rule of law can assist in building the economic capacity of a community. The Institute on Governance argues that "in the absence of basic legal provisions such as the protection of property rights, industrial and commercial activity is jeopardized and represents a significant barrier to external investment."[Note 137] This indicator is important for local economies. According to Cornell, Curtis and Jorgensen, "as long as people feel their claims will not be fairly addressed or that court decisions or appeals will be politicized, they will tend to mistrust their government and may take their knowledge and their energy and go somewhere else to live their lives, draining crucial assets from the nation."[Note 138] Thus the Rule of Law remains highly correlated with economic development indicators.
Assessment
The Rule of Law is a well known benchmark of good governance. It has been widely acknowledged by international organizations such as the World Bank, the United Nations and the Organization for Economic Co-Operation and Development among others. Data for the Rule of Law is currently provided for by these organizations, but is limited to measuring progress at the nation state level. Measuring the Rule of Law in Aboriginal communities, therefore, has yet to take place. Data collection methods will likely include public surveys, expert surveys, third party reports and case studies with specific communities. Possible ways of measuring the Rule of Law, albeit from a national perspective include:
- Effectiveness and predictability of the judiciary,
- the enforceability of contracts,
- degree to which the law is applied independently and decision-makers
remain at arms length from the institution,
- development of community redress mechanisms,
- foundations for protection of human rights and gender equity conform
to international commitments made by Canada,
- government mechanisms protecting human rights have been established,
- increased availability of legal services and information about legal
services,
- extent to which the constitution and common law are enforced,
- legislation, community law and legal processes are well understood
by community members and
- dispute resolution process are rooted in the historical, cultural and social context of the community.
7. Intergovernmental Relationships
Context
INAC maintains complex relationships with the Aboriginal and northern peoples of Canada. A majority of First Nations, Inuit and Métis communities are not yet self-governing. For those groups that have achieved a level of self-government, relationships with Canada and provincial governments are paramount for ensuring that the community has access to resources and services necessary for economic and social development. It is also imperative that these communities are consulted on all matters relating to their land and social well-being. Continued success across communities is highly dependent on positive, mutually reinforcing government-to-government relationships.
Rationale
According to the Institute on Governance, "Canada is fast becoming a world leader in the design of dispute resolution systems between levels of government and no where is this relationship more evident than in self-government agreements between Aboriginal and non-Aboriginal governments." [Note 139] In order to continue this trend, and to assist in the continued development of strong Aboriginal communities, Canada must strive to develop policies and deliver programs in a political environment that is conducive to positive relationships.
The Intergovernmental Relationships indicator provides the necessary link between governance capacity-building and community success. This indicator covers all aspects of INAC's program areas and is instrumental for assessing how well INAC is meeting the needs of its First Nations, Métis and Inuit. This indicator, therefore, measures the degree that positive relationships are established and maintained between governments, communities and stakeholders, with emphasis placed on collaborative frameworks that promote lasting relationships.
Assessment
The Institute on Governance states that, "for many nations across the globe, the breakdown of relations between governments and their indigenous peoples is the result of long-standing conflict and mistrust. And while the process of renewal is critical to respond to pressing social and economic conditions, these efforts take time. There is no set method to improve the relationship among governments."[Note 140] Relationship, as a concept, is difficult to measure. By focusing on collaborative frameworks, however, this indicator can assist programs in understanding the level of trust that exists between governments, and whether efforts at building and maintaining relationships are assisting in social progress. Possible ways of measuring Intergovernmental Relationships include:
- Resolution of outstanding historical lawful obligations addressed
through specific and special claims process among First Nations, federal
and provincial governments,
- establishment of First Nations and Inuit governments accountable
to their citizens,
- jointly developed policy frameworks to coordinate roles and shared
responsibilities of all parties,
- presence of frameworks that express shared goals,
- degree to which governments and organizations adherence to the framework,
- demonstration of problem solving across networks,
- level of collaborative interaction on governance projects and activities,
- number of governance projects and activities supported by INAC,
- instances of networking among First Nations or Inuit, or of collaboration
with other governments,
- implementation of governance models at an aggregate level and
- approval of agreements that support the aggregation of individual communities or service populations.
10.3 Synthesis and Analysis of Governance Indicators
Our findings reveal that no one indicator can adequately measure the extent that a community engages in sound governance practices. Taken together, however, these indicators suggest that without good governance, advancements in areas such as health and well-being, infrastructure, education and environmental protection are simply not possible. Perhaps the strongest linkage that exists in the literature is between governance and economic development.
The limitations of the indicators are not unlike others contained within the findings of other Thematic Chapters. Few efforts have been made to assess governance practices at the local level, mostly because of data collection cost and difficulties. In considering future collection efforts, there will likely be limited human and financial resources within the community to collect data that meaningfully represents the organizational context of the community. There is, however, data available from the Aboriginal Governance Index – a survey distributed by the Frontier Centre for Public Policy to First Nations in Alberta, Saskatchewan and Manitoba. The purpose of the index is to provide First Nations in these provinces with benchmarks through which bands can measure their progress in achieving sound governance. Although findings from the index could be of considerable use for INAC in developing surveys of its own, programs should be careful when measuring communities against one another as this could result in tensions between communities and may discount the diverse cultural contexts in which communities operate.
While not specific to the collection of governance indicators in Aboriginal and northern communities, international data sources that undertake cross-jurisdictional comparisons may provide important frameworks from which INAC and its partners can collect data to assess good governance practices. These include:
- Weighted Index of Social Progress
- Transparency International Corruption Perceptions Index (CPI) 2008
- The World Government Assessment
- World Bank Worldwide Governance Indicators (WGI)
Despite the data gap, particular attention should be paid to collecting governance indicators. As Aboriginal communities grow and continue to move toward self-government, providing the tools and capacity for communities to conduct their own governance assessments will become increasingly critical.
11. Infrastructure
11.1 Introduction
Community-level infrastructure commonly includes energy, transportation, telecommunications, water and wastewater, housing, public facilities, solid waste removal, emergency preparedness and management and a host of other services. From inadequate housing to a lack of water and wastewater infrastructure, Aboriginal and northern communities face a number of issues in each of these areas. The indicators discussed in this chapter have been chosen for their ability to monitor the state and condition of outcomes that directly relate to key issue areas of infrastructure in Aboriginal and northern communities. Indicators for each type of infrastructure are presented alongside outcomes drawn directly from needs identified in the literature.
The provision of infrastructure services is tied to a range of outcomes affecting Aboriginal and northern communities. In addition to the general state of infrastructure, the following types of infrastructure are discussed in this chapter to present a comprehensive view of community-level infrastructure:
- Water and wastewater. Improper disposal of
solid waste and wastewater can contaminate groundwater, which Aboriginal
and northern people are particularly dependent on as a source of drinking
water.[Note 141] Access
to clean water is correlated with a decrease in the incidence of water-borne
diseases.
- Telecommunications. Access to telecommunications
can support intra-community connections and access to information networks
abroad that may contribute to an improvement in education, health status
and economic development.[Note 142]
- Housing. Housing is broadly understood
as a fundamental requirement of Aboriginal and northern health, well-being
and quality of life.[Note 143]
- Transportation. Transportation infrastructure
facilitates the mobility of people within and beyond a community and
permits the movement of essential goods and services.
- Energy. Access to energy is an essential component of suitable housing.[Note 144] Community management of energy can empower Aboriginal and northern communities to plan for future energy needs and adapt to changing conditions.[Note 145]
11.2 Findings – Headline Indicators
General State of Infrastructure
Context & Rationale
Infrastructure is often classified into its different types, such as housing or telecommunications, each with their own specific components that need to be understood in order to adequately assess their respective levels of performance. However, a more holistic approach that incorporates the various types of infrastructure is often given less emphasis. Hence, the following indicators were chosen to fulfill this need, based on their ability to provide a common understanding of the state of infrastructure. Table one below shows areas of analysis and related indicators that can be used when assessing infrastructure systems.
| Area of analysis | Indicator |
|---|---|
| Identification of general state of infrastructure | Total infrastructure index |
| Identification of infrastructure need | Infrastructure deficit |
| Durability of community facilities and capital infrastructure | Service life / Building Performance Indicator |
1. Total Infrastructure Index
Context
The Total Infrastructure Index is "based on measures of quality and quantity of telecommunications, transport and electricity infrastructure."[Note 146] A weight of 0.5 is placed on telecommunications. Transport and electricity are each given the weight of 0.25.
Rationale
The Total Infrastructure Index is a useful measure for the fact that (i) it acts as a proxy for gaining a sense of the state of infrastructure for more than a single type and (ii) it acts as a proxy for the higher-level state of infrastructure by incorporating lower operational–level measures into a single measure.
Assessment
As indicators that incorporate more than one type of infrastructure were found to be relatively scarce in the project's research, one of the greatest strengths of the Total Infrastructure Index is that it includes three infrastructure types: telecommunications, electricity and transport. In addition, it takes into account aspects of both quantity and quality of infrastructure in a single index, establishing proxies that help ensure that there is adequate coverage provided by the infrastructure and that the infrastructure meets the functional needs of the population.
Notably, however, there are significant drawbacks that arise when relying on an aggregated weight-based measure of infrastructure, particularly when represented only as a single value. Specifically, no information of the state of the respective three infrastructure types is retained. The weights chosen for the different components of the infrastructure may not be universally suitable for all communities. In addition, while a single measure of infrastructure may simplify the representation of the state of infrastructure for reporting purposes, there is also the potential for its misuse and misrepresentation of the state of infrastructure if the shortcomings outlined above are not understood and explicitly presented when interpreting the index.
2. First Nations on Reserve Community Infrastructure Deficit
This indicator is an "estimate of the required funding to address capital infrastructure needs arising from deferred maintenance, required rehabilitation, or replacement of existing rusted out infrastructure assets."[Note 147] It includes water supply and distribution, wastewater collection and treatment, roads, solid waste, fire protection, housing and schools. While the development of this estimate arose out of a program review of INAC's Capital Facilities and Maintenance Program (CFM), the estimate does not include some typical CFM investments – specifically, the cost for construction of houses and schools.
Rationale
The infrastructure deficit estimate serves as a strong indicator for the general state of infrastructure in First Nations reserve communities. Since it is specific to these communities, it holds potential for comparative analysis and is already being used as such in INAC.
Assessment
There are two notable characteristics of the reserve community infrastructure deficit that add to its analytic potential. First, the estimate is calculated specifically for First Nations reserves – thereby targeting an important grouping of Aboriginal communities. Second, as the estimate is constructed with similar characteristics of the Federation of Canadian Municipalities' (FCM) municipal infrastructure deficit, it offers the potential for various comparative analyses of First Nations reserves with other communities in Canada.
However, there are significant limitations to the reserve infrastructure deficit estimate – some of which also limit its comparability with the FCM estimate. First, the First Nations reserve infrastructure deficit is a theoretically-based calculation, as opposed to being survey-based, as is the case for FCM's estimate. Second, the reserve infrastructure estimate is even more narrowly defined than FCM's municipal infrastructure deficit, the municipal focus of which has excluded federal/provincial/territorial infrastructure assets (i.e. certain aspects of electricity and telecommunications). Third, the scope of the First Nations reserve infrastructure deficit does not capture the state of infrastructure for other Aboriginal communities such as Métis and Inuit communities, or non-reserve Aboriginal communities.
3. Service life / Building performance Indicator
Service life is a term used to explain "the time during which a structure [or structural component] fulfills all of the requirements placed upon it without requiring unforeseen costs or disruption for maintenance and repair."[Note 148]
Rationale
A major aspect of determining community needs as they relate to capital infrastructure is measuring the durability of structures and structural components, which can be described as the condition of a structure remaining safe, functional and acceptable in appearance over a required period of time.[Note 149]
Assessment
Analysis based on service life is used as a tool both to assess the future costs of infrastructure and to monitor durability over time. The process of determining service life is sometimes described in terms of condition-based maintenance (CBM), a three-step process that (i) monitors the condition of building components based on performance scales; (ii) develops parameters to ensure detection of the failing condition of building elements; and (iii) provides a key performance indicator for comparison of the performance of different buildings.[Note 150]
A specific tool used in determining maintenance priorities in hospital buildings is the building performance indicator (BPI), one of many emerging examples of a standardized approach to comparing the performance of buildings in the context of service life.[Note 151] Applied to hospital facilities, the BPI measures building performance in the areas of structure, interior finishing, exterior envelop, fire protection, water and wastewater, elevators, electrical system, communications, heating, ventilation and air conditioning and medical gasses.[Note 152] The key strength of the BPI and other indicators like it, is its ability to target the performance of specific types of infrastructure and infrastructure components. An understanding of service life and long-term performance of materials can be used to track progress towards outcomes relating to sustainable and economically viable construction.[Note 153]
One significant limitation of service life analysis is that it is often not used as an indicator, but rather as a forecasting tool to assess life-cycle cost. Likewise, much of the literature devoted to this subject is scientific – less concerned with the use of service life in performance measurement than with the equations that underlie an accurate appraisal. Those indicators that have been developed (i.e. BPI) are exceedingly technical and specific to one type of infrastructure (i.e. hospital facilities) limiting broad applicability to the many different types of community infrastructure.
Another limitation is the complexity of the indicator. While it appears that one might be able to simply measure the length of time that a structure exists without requiring maintenance, defining acceptable standards for maintenance and building performance may require resources, expertise and benchmarking data. Numerous influences such as chemical composition of materials used in construction; weathering factors such as solar radiation, temperature and precipitation; biological factors such as microorganisms, fungi and bacteria, etc. may affect the condition of a building and a performance assessment must consider the relative impacts of each.[Note 154]
Although there has been significant headway made towards developing standards for service life (the service life of building components appears in numerous technical reports[Note 155]) it is important to remember that service life varies between jurisdictions, building materials, environmental conditions and other factors.[Note 156] One must take a community-based approach to forecasting, targeting and benchmarking this indicator.
Water and Wastewater
Context & Relevance
In 2003, an extensive assessment of water and wastewater systems on reserve was released. The report, titled National Assessment of Water and Wastewater Systems in First Nations Communities found that nearly 30% of all water systems assessed posed a potential high risk due to factors that include lack of knowledge to operate the water system, poor quality of the raw water source, inadequate treatment and a lack of regular testing procedures and maintenance of records. This finding is echoed in the RHS survey, which found that nearly 30% of all respondents considered their main source of water unsafe to drink.[Note 157] The same report found that a significant proportion of wastewater systems were problematic with roughly 16% posing a potential high risk to the community through wastewater effluent contamination. More generally, access was generally ound to be an issue with more than 5,000 households in need of basic water and wastewater services.[Note 158] Similarly, disposal of solid waste and contaminated sites adversely affect and threaten groundwater and ecosystems on reserve and in traditional hunting and fishing erritories.[Note 159] Table 2 below shows several key outcomes and corresponding headline indicators for water and wastewater.
| Outcome area | Indicator |
|---|---|
| Sustainable access to clean water; Adequate wastewater treatment | Canadian Water Sustainability index |
4. Canadian water sustainability index[Note 160]
The Canadian water sustainability index (CWSI) covers five theme-based components, the results of which are averaged to determine a ranking. The goal of the index is to provide a suite of indicators general enough to be measurable in as many communities as possible, while still covering meaningful issues. This has involved engaging communities in the selection of indicators that are simple and target available data, yet are useful at the community-level.
Rationale
CWSI was chosen as a headline indicator for water quality and wastewater treatment because it approaches water issues holistically, providing a profile of a community's key water issues as they relate to ecology, socio-economics and health. Moreover, the index was tested in rural Aboriginal communities to determine its utility and to integrate necessary modifications based on community feedback.
Assessment
Table 3 below shows a description of each indicator included in the index by policy area. Indicators related to infrastructure have been highlighted in the discussion below.
| Component | Indicator | Description |
|---|---|---|
| Resource | Availability | The amount of renewable fresh water that is available per person |
| Supply | The vulnerability of the supply as caused by seasonal variations and/or depleting ground water resources | |
| Demand | The level of demand for water use based on water license allocations | |
| Ecosystem health | Stress | The amount of water that is removed from the ecosystem |
| Quality | The Water Quality Index score for the protection of aquatic life | |
| Fish | Population trends for economically and culturally significant fish species | |
| Infrastructure | Demand | How long before the capacity of water and waste water services will be exceeded due to population growth |
| Condition | The physical condition of water mains and sewers as reflected by system losses | |
| Treatment | The level of waste water treatment | |
| Human health | Access | The amount of potable water that is accessible per person |
| Reliability | The number of service disruption days per person | |
| Impact | The number of waterborne illness incidences | |
| Capacity | Financial | The financial capacity of the community to manage water resources and respond to local challenges |
| Education | The human capacity of the community to manage water resources and address local water issues | |
| Training | The level of training that water and waste water operators have received |
The CWSI has high applicability to community water management as it has been designed for use at the community-level to assess the condition water quality as it applies to a range of socio-economic and environmental factors. The indicator also applies broadly to wastewater treatment, satisfying the need to track progress in this key issue area of Aboriginal and northern infrastructure.
Another benefit of the index is its sophisticated system of assessing the ranking of a community's water sustainability. Scores ranging from 1-100 are ascribed to each indicator through a calculation of variables. Analysis is based on common benchmarks of water quality, safety and other standards. Comparison can take place between communities or within a single community to monitor change over time once community-specific benchmarks have been established.
The index, though only recently introduced, has undergone testing by the Centre for Indigenous Environmental Resources (CIER) in six select remote and rural communities, three of which were Aboriginal. One identified weakness of the index was the relevancy and usefulness of the wastewater treatment indicator, which focused on the number of community members serviced by tertiary treatment plants. It was suggested that the indicator be changed to a compliance measure that reflects the frequency of effluent standards met.
The infrastructure measure for water demand was thought to be useful to anticipate the need for upgrades and new construction; however, one observed limitation was that Census data used to calculate the annual rate of population growth may be too infrequent a source. It was also noted that changes in water quality standards could influence the adequacy of existing facilities despite demand.
The final infrastructure indicator included in the index assesses the conditions of water mains and sewers by measuring the amount of water and wastewater that is lost from each system. This indicator was found by communities to be useful; however, there appears to be some difficulty in gathering community-level information related to water and wastewater loss.
Telecommunications
Context & Relevance
In the context of infrastructure, telecommunications includes all the physical systems and networks that permit or facilitate the broadcasting, reception, or general access to information, whether in the form of text, sound, video, or basic bits of digital or analog information. Information and Communication Technology (ICT), as well as broadband internet access, specifically, have been recognized as important for supporting outcomes in areas such as health, education, governance, resource management and culture.[Note 161]
5. Internet Access (Aboriginal Community Connectivity Infrastructure)
The Aboriginal Community Connectivity Infrastructure's internet access statistic tracks whether communities have dial-in, high-speed, other type of internet access, or no access. The statistics are based on connectivity surveys of Aboriginal communities conducted by INAC's Information Management Branch, Industry Canada's Community Access Program and the SchoolNet program.[Note 162]
Rationale
Despite some of its flaws, the measure of internet access as used by the Aboriginal Community Connectivity Infrastructure initiative was chosen, in part, due to the analysis and contextual information that is readily available at an Aboriginal community level in its reports. This greatly reduces the time and financial costs that may be involved in data collection, processing and analysis.
Assessment
The current internet access statistic covers the different types of internet access (i.e.dial-in, high-speed) at both the community and household levels. It is also able to touch upon the aspect of internet affordability, since it considers communities that incur long-distance charges when accessing the internet. Analysis of Aboriginal community and household internet access is available in the Report on Aboriginal Community Connectivity Infrastructure. While the most recently published report is for 2004, a more updated report is expected. In addition, as INAC is involved in the compilation of the report, much of the analysis and raw data should already be available internally. As well, financial, labour and time costs attributed to the collection and analysis of the statistic would already be absorbed, assuming the compilation of the report is conducted on a regular basis. The availability of the data is perhaps this specific measure's greatest advantage.
One limitation of the statistic is that the categories of internet access are at a relatively high level, specifically, information on connection speeds is not available. This is particularly significant, since connection speeds can vary greatly within specific types of internet access. Even if one has access to "'high-speed internet," network capacities can decrease significantly with an increase in the number of users in a given area of coverage. Further, no information is provided with respect to the reliability of the internet connections, such as how often disruptions to access may occur. One final notable weakness is that measuring access to the internet is a technical matter and like most types of infrastructure measures, does not reveal anything about how the community will use the tool and some of the social implications – both positive and negative – that it would have on the community.[Note 163]
Housing
Context and relevance
Inadequate or poor housing in terms of housing quality, durability and safety has been identified as a significant problem in Aboriginal and northern communities across Canada. The 2002-03 First Nations Regional Health Survey revealed that 40% of respondents living in band-owned housing reported the presence of mould or mildew in their homes.[Note 164] Data from the same survey found that over one third of respondents claimed that they lived in housing accommodations in need of major repair, a proportion four times greater than the Canadian national average.[Note 165] This survey also found household fire safety equipment, such as smoke detectors, carbon monoxide detectors and fire extinguishers to be "widely lacking."[Note 166] Similarly, the literature often discusses preventable household injuries among Aboriginal people – such as poisoning, burns and injuries – in the context of housing conditions.[Note 167]
This section discusses indicators that relate to the technical issues of adequacy, quality, performance/durability and safety of housing (see Table Five below). These issues are linked in many ways to health and social outcomes and the reader is encouraged to consult the Health and Well-being Thematic Chapter of this report for a more complete understanding of the relationship between proper housing and well-being.
| Outcome area | Indicator |
|---|---|
| Adequacy and quality of housing | Housing units requiring major repair |
| Performance and durability of housing | Service life of housing structure and structural components (See general state of infrastructure) |
| Safety of housing | Housing safety and accidents |
6. Housing units requiring major repair
Rationale
The percentage or number of Aboriginal and northern households requiring ajor repair surfaces in a number of sources as a measure of housing condition.[Note 168] Importantly, this measure indicates adequate housing, a measure of acceptable housing, which is widely used as a Canadian housing standard on and off reserve.[Note 169]
Assessment
The Health and Well-being Thematic Chapter of this report discusses the two additional elements of acceptable housing – affordability and suitability. CMHC describes an adequate housing unit as one that does not require any repairs according to residents. Major housing repairs may include the repair of defective plumbing, electrical wiring, structural repair to walls, ceilings, floors, etc.[Note 170] The indicator is generally represented as a proportion of total households reporting a need for repairs.[Note 171]
A chief strength of this indicator is data availability. Census data and RHS survey data both include this measure, increasing its reach across Aboriginal communities and enabling analysis over time. A further benefit stemming from this is community-level analysis and comparison drawing from this data.[Note 172] CMHC routinely analyzes data on major repair, enabling easy comparison between Aboriginal and non-Aboriginal populations across Canada and contributing to an understanding of whether housing conditions on reserve are consistent with provincial conditions. Much like Canada, the indicator is used in Australia to measure indigenous housing adequacy, allowing for comparison with this country as well.[Note 173]
One limitation of using this measure as a sole indicator of housing quality is that data collection and analysis are generally not sensitive to the types of housing deficiencies that together result in the need for major repairs. As a result, this indicator is best coupled with additional indicators that target specific elements of housing quality. The Housing Corporation of Britain, for instance, has developed an extensive Housing Quality Indicators System that targets a number of specific indicators in the areas of location, design and environment.[Note 174] Another key area to measure in the context of Aboriginal housing quality is the presence of mold in households and the effects this might have on health conditions.
Self-reporting has the benefit of revealing respondent awareness of housing quality issues. One final strength of this indicator and where the housing safety and accidents indicator discussed below falls short by nature, is its ability to identify housing quality issues before accidents occur.
7. Housing safety and accidents[Note 175]
This indicator, developed by the World Health Organization (WHO) Europe for use in the European Environment and Health Information System (ENHIS), measures the safety of the design, quality and general conditions of a home as it relates to accidents and injuries. The unit of measurement is the quantity and type of injuries and death cases that result from accidents and injuries in and around a private residence. This could include the occurrence of burns, poisonings, asphyxiation from toxic gases and injuries that may result from falls and other hazards in the design and conditions of a dwelling.
Rationale
The literature includes reference to community safety indicators as they relate to housing[Note 176] and indicators that target safety as a design feature of housing[Note 177]; however, it appears that few studies have developed a single indicator that attempts to measure the many adverse health and safety effects that may result from unsafe housing conditions. Though the housing safety and accidents indicator has a number of limitations, it was included in discussion for at least attempting to measure this important housing issue.
Assessment
Strengths of the indicator include the availability of medical data, the low cost of obtaining this data and some comparability across jurisdictions, namely those surveyed by WHO Europe. A second strength is the potential for the indicator to be combined with household demographic survey and Census data that may give greater meaning to segments of the population at the highest risk of household accidents. Finally, the intended emphasis of the indicator on analysis of fire-related accidents gives it relevance to Aboriginal communities in Canada.
One weakness of this indicator is its almost exclusive use of health data as an indication of physical household condition, which may not be sensitive to intervening factors. Household injuries and deaths can be caused by housing conditions, human behaviour (i.e. negligence, risk-taking, impaired mobility, etc.) or a combination of factors related to these two influences. Underreporting of injuries may also occur in some communities as a result of a lack of access to medical facilities. Similarly, while data can be compared to international jurisdictions, availability to medical services and discrepancies in the number of reported injuries in various jurisdictions may interfere with the validity of data and the extent to which an accurate comparison can be made. One final weakness is that it is unclear whether data for this indicator is still being collected by WHO Europe, which would greatly limit potential for cross-jurisdictional comparison.
Transportation
Context and Relevance
In a community context, one of the main purposes of transportation infrastructure and networks is to increase accessibility to essential goods and services. Adequate access to services has been cited as an important factor to reduce poverty.[Note 178] In particular, rural communities in Canada have been known to have a low level of access to health services.[Note 179]Transportation networks contribute to both accessibility within a community (internal access and mobility) as well as accessibility between communities (external access). While the two may differ in importance by each community, both aspects need to be considered to ensure a complete understanding of both the internal and external transportation linkages of a community. Table Six below shows the two headline indicators for community transportation.
| Outcome area | Indicator |
|---|---|
| Accessibility to essential goods and services | Degree of isolation |
| Travel time |
8. Degree of Community Isolation
Health Canada's First Nations and Inuit Health Branch (FNIHB) has developed a classification scheme for the degree of isolation for Aboriginal and northern communities. The four types are:[Note 180]
- Non-isolated: communities that are accessible by road and are less
than 90 kilometres from physician services.
- Semi-isolated: communities that have road access, but the nearest
physician services are farther than 90 kilometres away.
- Isolated: communities that have scheduled flights and good telephone
service, but no road access.
- Remote isolated: communities that have no scheduled flights or road access and minimal telephone and radio service.
Rationale
Being able to gauge a community's accessibility to essential goods and services is particularly important when dealing with remote communities that have varying levels of self-sufficiency. Based on an assessment of FNIHB's measure on the degree of a community's isolation, it was found to be a good indicator for a community's access to external goods and services.
Assessment
One of the greatest strengths of the indicator is that it touches on several aspects of transportation infrastructure in terms of how it contributes to the accessibility of goods and services. Specifically, it takes into account access to roads, flights, telephone and radio. In addition, the indicator is specific to First Nations communities and available through FNIHB, which means that much of the data collection, processing and analysis work have already been completed.
However, one notable limitation is that this is not an entirely well-rounded measure for the purposes of assessing how infrastructure contributes to accessibility since some categories are defined specifically for measuring access to physician services. In addition, as the indicator is based on four discrete categories, the degree of isolation of communities cannot be assessed on a continuous scale. In addition, caution should be taken when analyzing the degree of isolation of communities based solely on the names of the different categories. How the categories are defined are often very particular (i.e.Isolated communities are defined as being those communities that have scheduled flights and good telephone service, but no road access). This is a consideration that needs to be made clear when interpreting and presenting findings. Nevertheless as a proxy measure for accessibility to-and-from the community, FNIHB's degree of community isolation serves its purpose if these limitations are kept in mind.
9. Travel Time
The travel time indicator includes the amount of time required to travel for typical day-to-day activities, such as travelling from home to work, school, or for shopping.
Rationale
Travel time is a good indicator for a community's internal accessibility in that it can reflect the efficiency of the community's arrangement of typical points of destination and the modes of transport available to reach them. While there has been some attention given to the Rural Access Index in the international development context, travel time was chosen over the Index since it provides a more encompassing perspective on the travel behaviour of a community's residents. It includes all modes of travel that is used to reach common destinations, rather than simply being limited to measuring "the number of rural people who live within two kilometres…of an all-season road as a proportion of the total rural population."[Note 181]
Assessment
One strength of travel time is that it is not inherently limited to measuring the quantity of transportation-related infrastructure (i.e.number of paths, length of roads). Rather, it directly measures one of the desired outcomes of infrastructure, which is a high level of accessibility within a community, whether if this is by foot, automobile or other means. Existing research on travel and transportation in localities, such as the Transportation Tomorrow Survey have proven to reveal significant insight into the travel behaviour of residents.[Note 182]
Note that this indicator is directly related to the Access to Learning Institutions Indicator in the Education Thematic Chapter, which measures the average travel time of residents to a variety of learning institutions.
ENERGY
Context and Relevance
A community's capacity to serve social and economic needs is fundamentally linked to its ability to utilize energy. Issues such as rising energy costs, control over local electricity and local energy security have been identified as Aboriginal and northern community needs.[Note 183] Table Seven below illustrates several headline indicators associated with energy outcomes identified in the literature.
| Outcome area | Indicator |
|---|---|
| Sustainable / secure access to energy | Net energy import |
| Access to affordable energy | Share of household income spent on energy and electricity |
10. Net Energy Import
Net energy import is formulated as the total primary energy supply minus the amount of energy imports (often measured in kilowatt hours, kWh). It can also be presented as a percentage of total consumption, or a ratio of energy imports to energy exports, specifically, the amount of surplus energy that a community feeds into an external grid. Communities that engage in energy production are less at risk of suffering from energy shortages and market fluctuations.
Rationale
The degree to which a community is dependent on outside energy sources reflects, in part, its basic capacity to function on its own as a viable community in the longer-term. In this way, net energy import acts as an indicator for the energy dependence of a community.
Assessment
Net energy import is a useful indicator for the level of dependence that a community has on external sources of energy. However, one of the major weaknesses is that this information is not readily available at a local level, particularly for Aboriginal communities and reserves. As Aboriginal reserves often use diesel-powered generators for electricity, data collection would require contacting the power utility company serving that community as well as the main fuel exporter for that community. Off-grid Aboriginal and northern households or communities may require alternative means of data collection (i.e. surveys). However, once available, the information can be used to assess the varying levels of energy dependence of a community over time, as well as compared with other Aboriginal or non-Aboriginal communities.
11. Share of household income spent on fuel and electricity
This indicator is represented in the form of a percentage that can be used to assess the affordability of energy – specifically for fuel and electricity.
Rationale
The basic availability of energy is not sufficient in determining whether residents of the community are able to actually access energy as resource for private use. In this way, the share of household income spent on fuel and electricity acts as a measure on the relative level of affordability of energy for the community at a household level.
Assessment
The share of household income spent on fuel and electricity is a good indicator of the affordability of electricity since it is a relative measure specific to each household's expenditure on energy, rather than simply being the absolute price of energy. For the purposes of analysis and reporting, the measure is also relatively easy to use and understand, as it does not involve intensive mathematical formulations to reach the result. However, a significant weakness is that the information is not readily available at the household level. While average household income for communities may be available from census data, information is often suppressed for low population communities to maintain confidentiality. Household surveys may be required to obtain information on how much is spent on fuel and electricity.
11.3 Overall Analysis of All Indicators
An overall examination of the indicators discussed in this chapter reveals some gaps in terms of the indicators that are available in the literature and other jurisdictions. First, it was found that it was often the case that indicators on infrastructure were discipline or infrastructure-type specific. Few indicators allow for an assessment of the state of infrastructure more generally. Thus, more holistic or cross-cutting indicators related to community-level infrastructure systems were found to be a gap in the research. Second, while there are many operational and technical measures on infrastructure, few are direct indicators of higher-level performance and outcomes.[Note 184]
Though there are significant gaps in the information that is collected and available, this project's research revealed some overlap in data collection. As an example, British Columbia's First Nations Technology Council conducts a very similar survey as the federal government's Aboriginal Connectivity Survey. Examples such as this signal unnecessary reporting requirements from Aboriginal communities. As well, costs in time and money could potentially be saved if efforts in data collection are better coordinated across government (at all levels) and organizations. Another broad limitation is that most indicators target First Nations and do not reach other Aboriginal communities.
12. Mapping of the Indicators to the PAA
12.1 Mapping and Synthesis
As outlined in the methodology section, the thematic indicators were chosen based on a scan of international and national sources and accepted best practices. Departmental priorities were considered broadly in the selection of thematic areas, but beyond that, the literature guided the selection of indicators. Once the research was complete, the indicators were mapped to the PAA in order to identify indicators that could be applied to INAC programs. This approach has the advantage of moving the focus of the research past the specific activities and objectives of individual programs to emphasize indicators that target the broader needs of Aboriginal and northern communities. Since the priorities and programs of the Department are continuously evolving, the selected indicators are more likely to be applicable for new initiatives as well as existing programs.
The mapping exercise included the following goals:
- Determine the extent to which the full set of researched indicators matched up to various SOs and program activity areas across the PAA.
- Determine, from this comprehensive list, indicators that could be applied to multiple SO and Program Areas (PAs) outlined in INAC’s PAA.
In order to map thematic indicators across the PAA, the project team primarily consulted the following two documents:
- INAC 2009-2010 PAA Element Description
- INAC 2009-2010 Performance Measurement Framework
The mapping exercise took place over the course of two days. Working in pairs, the project team members assigned the entire suite indicators to the Program Areas where they were most applicable based on the description of the activity in the 2009-2010 PAA Element Description. Once complete, the team was divided in two groups to debate the applicability of each of the indicators previously assigned to the program areas. Although there was no limit on the number of indicators that could fall under each activity area, one objective of the exercise was to retain only those indicators that strongly correlated to the scope and nature of activities listed for each area in the 2009-2010 PAA Element Description. The final suite of selected "headline" indicators were subsequently analyzed in terms of their relationship to each other as well as their relationship to the PAA.
12.2 Mapping Exercise
Economy
Indicators under the Economic Development thematic area appear most frequently in the SOs of The Economy and The North. However, this thematic area also includes indicators that cut across the SOs of The Government, The People and The Office of the Federal Interlocutor. Indicators that appeared most frequently include "technology/research and development innovation"’ and "good governance."
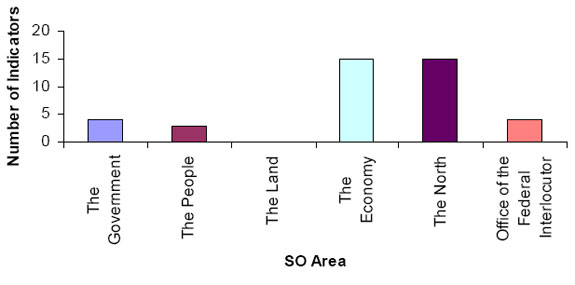
The chart above details the number of Economic Development indicators that were mapped to each of the Strategic Outcome Areas of the PAA.
Chart 2 details the number of Economic Development indicators that were mapped to each of the Strategic Outcome Areas of the PAA as follows: The Government: 4; The People: 3; The Land: 0; The Economy: 15; The North: 15; Office of the Federal Interlocutor: 4
Environment
Indicators under the Environment thematic area appear most frequently under the SOs of The Land and The North. Specific indicators with the highest frequency across these SOs are "Environmental Vulnerability," and "Management Effectiveness of Protected Areas/ Biodiversity."
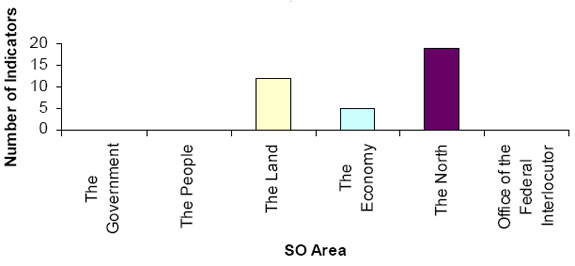
The chart above details the number of Environmental Protection and Sustainable Development indicators that were mapped to each of the Strategic Outcome Areas of the PAA.
Chart 3 details the number of Environment indicators that were mapped to each of the Strategic Outcome Areas of the PAA as follows: The Government: 0; The People: 0; The Land: 13; The Economy: 6; The North: 20; Office of the Federal Interlocutor: 0.
Health and Well-Being
The indicators under the Health and Well-Being thematic area appear most frequently under the Strategic Outcomes of The People, The North and the Office of the Federal Interlocutor (OFI). Almost half of the indicators developed in this thematic area were found to be applicable in The SO areas of The People and OFI. The Health and Well-Being "housing" indicator (appearing three times) crosses all three of the SOs. The "Community Engagement" indicator (appearing three times) is the only Health and Well-being indicator to show up in The Government SO while at once cross-cutting to the SOs of The People and OFI.

The chart above details the number of Health and Well-being indicators that were mapped to each of the Strategic Outcome Areas of the PAA.
Chart 4 details the number of Health and Well-being indicators that were mapped to each of the Strategic Outcome Areas of the PAA as follows: The Government: 1; The People: 9; The Land: 0; The Economy: 1; The North: 5; Office of the Federal Interlocutor: 7.
Infrastructure
Infrastructure is most directly tied to The Economy SO. Three indicators related to housing cut across The Economy and The People SOs. Interestingly, however, no single Infrastructure indicator appeared more than three times in any of the SOs.

The chart above details the number of Health and Well-being indicators that were mapped to each of the Strategic Outcome Areas of the PAA.
Chart 5 details the number of Infrastructure indicators that were mapped to each of the Strategic Outcome Areas of the PAA as follows: The Government: 0; The People: 6; The Land: 1; The Economy: 30; The North: 2; Office of the Federal Interlocutor: 1.
Governance
Indicators under the Governance thematic area appear most frequently under The Government SO. However, Governance indicators also appear frequently under The Land, The North and OFI SOs. The Governance indicators cut across more SOs than those in other thematic areas. Two indicators, Self Determination" (Appearing eight times) and "Intergovernmental Relationships" (appearing 11 times), cut across each of the six SOs.
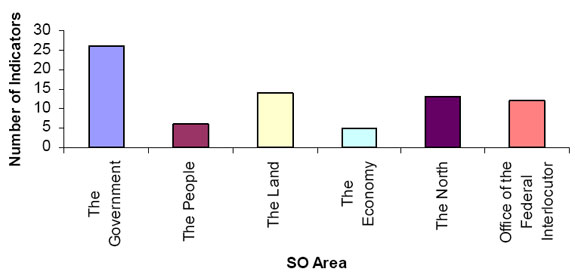
The chart above details the number of Governance indicators that were mapped to each of the Strategic Outcome Areas of the PAA.
Chart 6 details the number of Governance indicators that were mapped to each of the Strategic Outcome Areas of the PAA as follows: The Government: 26 The People: 6; The Land: 14; The Economy: 5; The North: 13; Office of the Federal Interlocutor: 12.
Education
The majority of Education indicators were aligned with the SO of The People. The three indicators that appeared most often were "Education and Relative Earnings" (appearing four times), "Financial Assistance" (appearing three times) and "Post Secondary Enrolment" (appearing three times).These three indicators cross cut with The People and OFI, highlighting the importance of education in the development of urban Aboriginal programming.
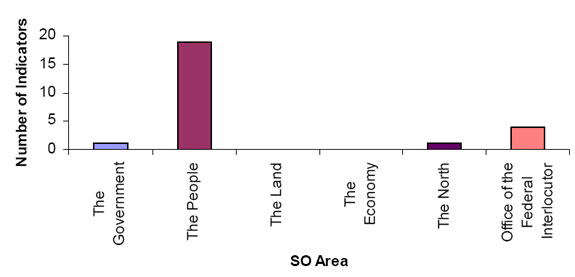
The chart above details the number of Education indicators that were mapped to each of the Strategic Outcome Areas of the PAA.
Chart 7 details the number of Education indicators that were mapped to each of the Strategic Outcome Areas of the PAA as follows: The Government: 2 The People: 19; The Land: 0; The Economy: 0; The North: 2; Office of the Federal Interlocutor: 4.
12.3 Analysis of Headline Indicators
A second level of analysis was undertaken of the frequency of the headline indicators for each thematic area as they apply to the SO areas of the PAA. Headline indicators were aligned with Program Areas to identify those indicators that have the strongest application to INAC programs. Indicators that were found to have application across multiple SO areas offer an opportunity for the department to better coordinate data collection activities, save costs of data collection and reduce the reporting burden on communities. The analysis is particularly useful for assisting program managers to identify priority areas for performance measurement as they apply to the broad objectives of specific programs.
The following chart depicts the frequency of the headline indicators for each thematic area across the PAA:
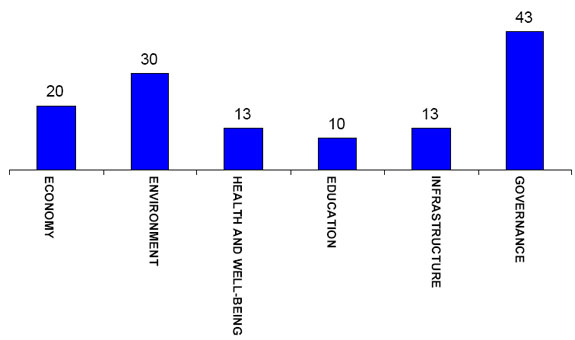
Chart 8 outlines the frequency of the headline indicators from each thematic area across the PAA. The chart shows the number of indicators from each thematic area that were aligned with indicators that could can be used to measure activities within each SO. The chart shows the following frequencies for each SO: Economy: 20; Environment: 30; Health & Well-being: 13; Education: 10; Infrastructure: 13; Governance: 43.
The horizontal x-axis of the chart shows headline indicators that were identified as applicable in each SO area. The vertical y-axis indicates the number of headline indicators that were found to be directly applicable to numerous program activity areas. A high frequency of applicability across the PAA suggests that these are important indicators to consider in high-level performance measurement that seeks to measure outcomes across program areas.
It is noteworthy that several of the headline indicators discussed in the report show little applicability when mapped to the PAA. This can be explained by the fact that the headline indicators were selected to depict an ideal state of performance measurement in a given thematic area. In some instances, they may exceed INAC’s scope and mandate of activities. Regardless, these indicators may prove useful when considering the many different contextual factors contributing to community well-being, or when conducting horizontal evaluations that seek to measure the performance of a suite of programs from across government.
The mapping exercise revealed that indicators for the thematic areas of Governance and the Environment remain particularly relevant for INAC’s Strategic Outcomes and Program Areas and suggests that the Department can benefit from integrating indicators outlined in these Thematic Chapters into multiple levels of departmental performance measurement initiatives. Interestingly, however, the headline indicators for the thematic areas of Health and Well-being and Education did not appear as frequently as one might expect. This suggests that there are a number of contextual and other factors at play that exceed the scope and mandate of INAC’s activities. Despite not being directly linked to the PAA, attention should still be given to these indicators as they reveal important points of analysis when measuring cross-cutting issues.
13. Conclusion & Recommendations
This report has presented performance indicators across six thematic areas identified as essential elements of holistic well-being of Canada’s Aboriginal and northern communities: Health and well-being, environment, education, economy, governance and infrastructure. Taken together, the indicators that emerged from research in the thematic areas can assist the Department to develop a broad perspective of the challenges and success taking place across communities and respond with meaningful measures of program activities. Ultimately, this framework contributes to the measurement of INAC’s vision of a future in which First Nations, Inuit, Métis and northern communities are healthy, safe, self-sufficient and prosperous.
To a large extent, the selected indicators are outcome-oriented, enabling analysis that goes beyond activities and outputs to focus on comprehensive issues and needs specific to Aboriginal and northern communities. Focusing on what is meaningful for measurement at the community-level, however, is a multi-faceted and challenging task. The diversity of Aboriginal and northern communities across Canada limits the extent to which performance information can capture the unique and complex condition of each community. The literature generally agrees on a number of factors to consider when designing a culturally-relevant performance measurement plan. Drawing from this knowledge, this report provides a starting point for the further development of indicators that meet individual community needs while simultaneously addressing the broader performance measurement goals of government.
Research for this project reveals several challenges and opportunities for the Department to consider in pursuit of meaningful and effective performance measurement. The reader is encouraged to consult The State of Performance Measurement Programs in Support of Evaluation at INAC also produced by the Audit and Evaluation Sector – for further detail on the context of the Department in relation to these challenge and opportunities. The recommendations which follow set out important steps the Department can take in this direction.
Recommendation 1: Differentiate between indicators related to community well-being and program success
The dual goal of the research has been to provide a list of indicators applicable both to Aboriginal / northern communities and departmental programs, which together contribute to an understanding of the Department’s role in achieving outcomes at the community-level. This has meant that some indicators relate to the general well-being of communities, while others may be better suited to measuring program performance. Measures of program performance can be used to measure immediate outcomes, while measures of community well-being can be used to measure intermediate and long-term success. Differentiating between these two types of indicators contributes to an understanding of attribution between program activities and outputs and community outcomes.
Recommendation 2: Engage communities and other stakeholders in a culturally appropriate manner that integrates gender-based perspectives in developing performance measures.
Developing performance measurement indicators that are relevant at the community level requires extensive consultation with Aboriginal and northern communities to ensure that the proposed indicators and measures have meaning for the community, are appropriate to culture and gender, and are rooted in the vision Aboriginal and northern peoples have for their communities. Importantly, this requires engaging community members that represent the many different groups in a community including men, women, elders, youth and others. Attempts to collect data in Aboriginal communities should also be sensitive to the community’s principles of research and data collection. One example are the principles of Aboriginal ownership, control, access, and possession of information (OCAP).
In addition, performance measurement requires consultation and partnership with other stakeholders, namely other federal departments and governments that are working toward similar outcomes. Preliminary contact made with external stakeholders during this project revealed that there are similar efforts in indicator work underway, offering opportunities for sharing of best practices, harmonizing data collection, and ultimately, creating more sophisticated performance measurement systems.
Recommendation 3: Continue to work towards harmonized data collection
The shortage of data sources focusing on Aboriginal people, within and outside the Department, makes collecting information on a number of the indicators selected for this study costly, time-consuming and in some cases unfeasible, despite their relevance at the community level. Existing data are often unable to be disaggregated to analyze the broad spectrum of variables contributing to the well-being of individual Aboriginal and northern communities. The research also found evidence of increasing data collection and indicator work already underway in Aboriginal and northern communities. While this demonstrates a growing commitment to performance-based programming, it also increases the reporting demand on individual communities.
In some cases, the same or similar data is currently being collected by multiple sources. The fact that these and other organizations share similar outcomes and goals further demonstrates the need to harmonize data collection. Coordinated collection between the federal government, other levels of government and Aboriginal/community organizations, would reduce the reporting burden. In addition to benefiting communities, increased coordination of data collection would decrease the time and cost that data collection agencies and communities face.
Recommendation 4: Develop community-based targets
Few of the indicators reviewed in this report have included targets to assess substantive progress in Aboriginal and northern communities. For the most part, the selected indicators use benchmarks to define progress as an increase of parity between Aboriginals and non-Aboriginal populations. While this approach illustrates Aboriginal community well-being in relation to national standards, it comes at the cost of observing progress from the perspective of the community itself. To gain a better understanding of community well-being, the Department should engage communities in developing benchmarks that reflect their goals and aspirations, enabling analysis of a single community’s progress over time.
Recommendation 5: Pursue measurement strategies that focus on building capacity
The research identified a strong relationship between community capacity and the achievement of outcomes. However, few indicators exist for measuring the state of capacity across multiple thematic areas. The literature indicates that capacity is a function of a range of variables contributing to community well-being. In an effort to draw attention to community capacity, this report has emphasized the relationships between these variables as they surface in each Thematic Chapter. Users of this report are encouraged to adopt a holistic approach to performance measurement to capture the broad factors contributing to community capacity. Similarly, the Department is advised to continue to work towards developing programming that cuts across outcome areas to address the many unique needs of communities.
Recommendation 6: Continue the pursuit of outcome-based indicators
A major focus of this report has been to help address the shortage of outcome-oriented indicators in the Department. A key consideration in the selection of indicators has been to identify those that go beyond descriptive measures of departmental activities to include the longer-term impacts of programs. Other selected indicators roll-up operational-level data to provide an understanding of the performance of community systems, such as various types of infrastructure. Collecting performance data on outcome indicators may necessitate engaging program recipients in continuous dialogue regarding the cumulative effects of programs.
Appendix A - List of Indicators
| Indicator | Description |
|---|---|
| Economy Indicators | |
| Real GDP & Adjusted Net Savings | GDP: Real GDP per capita Adjusted Net Savings: traditional net savings – cost of resource depletion + expenditures on education |
| Access to Markets | communities ability to access markets both physically (ie: ability to transport via: roads, airport, rain, water, etc.) and competitively (markets) |
| Presence of a Commercial Economic Development Organization | government organizations (not private or NGO) |
| Coordination and Consultation | coordination with other projects and consulting with all possible stakeholders for economic projects |
| Construction | construction activity (residential and non-residential building) |
| Infrastructure | existence and management of infrastructure across the community, including: education, housing, and commercial buildings. Road access/ air/ train for the transportation of goods and services |
| Employment-to-population ration/ vulnerable employment | number of people that are vulnerable to economic risk because of weak institutional employment arrangements (no formal work arrangements) |
| Aboriginal communities’ involvement in non-Aboriginal economy | mechanisms to match the Aboriginal labour force with employment equity and anti-discrimination policies and programs. Aboriginals employed in economies that are not traditionally Aboriginal (i.e. oil) |
| Technology Research and Development | existence of Research and Development programs and initiatives |
| Good Governance | assesses if the government climate that is conducive to economic development |
| Access to learning opportunities | average travel time required to reach a range of learning institutions and services |
| Sufficient Resources | measures physical and community resources available which enhance learning both inside and outside of the classroom |
| Pan-Canadian Assessment Program | standardized testing program that examines student achievement in mathematics, reading and science. |
| Supportive Family Context | parental participation in children’s education including homework assistance and exposure to reading: |
| Satisfaction with Quality of Basic Education System | percentage of First Nations, Métis and Inuit high school students, parents and other community representatives satisfied with the quality of the basic education system including First Nations, Métis and Inuit language learning and teaching resources |
| Community Involvement in Education | level of participation of First Nations, Métis and Inuit people in governance activities (e.g. parents councils, boards of trustees, post-secondary boards, provincial education committees, task forces, school administration) |
| Early Development (School Readiness) | extent that children in early stages of development (pre Kindergarten or grade 1) are ready to pursue primary education, |
| Participation in Job Related Training | proportion of residents/community members who participate in any form of job-related training, either at or outside the workplace |
| School Life Expectancy (SLE) | total number of years of schooling which a child of a certain age can expect to receive in the future, assuming that the probability of enrolment in school at any particular age is equal to the current enrolment rate for that age |
| Civic Conceptions and Attitudes | students’ conceptions and attitudes towards citizenship and government. |
| Greenhouse Gas Emissions | human-made greenhouse gas emissions at either the provincial/territorial, sectoral level (more complex and comprehensive) or the community level (simpler, carbon emissions only) |
| Air Quality | exposure to ground-level ozone and fine particulate matter, the two most widespread pollutants |
| Water Quality | the frequency and extent to which selected parameters exceed water quality guidelines at select monitoring sites |
| Land Degradation | the share of land which due to natural processes or human activity is able to sustain neither economic nor ecological function |
| Climate Change Research | coordinated research, observation, monitoring and modeling based on natural. social, and health sciences and Aboriginal knowledge |
| Environmental Risk Management | The development of an environmental risk assessment (ERA) and the implementation of an environmental response action plan |
| Management Effectiveness of Protected Areas | planning and design, resource inputs, management processes, delivery of goods and services, and conservation outcomes of protected areas |
| Area of forest under sustainable forest management | forest health, the extent to which forests fulfill targets related to their environmental, economic and social functions, and forest management practices |
| Proportion of Fish Stocks within their Safe Biological Limits | fish stocks exploited within their level of maximum biological productivity , i.e., "Underexploited", "Moderately exploited", "Fully exploited" |
| Community Support for Environmental Programming and Sustainable Development | community’s openness, engagement, and attitudes toward local environmental programming and sustainable development |
| Governance Indicators | |
| Strategic Vision | measures the degree to which a community has a vision that is developed in conjunction with community members and that is articulated in a short and long-term plan |
| Authority and Capacity for Solving Community Problems | measures the extent that a community is able to use appropriate methods to identify problems and implement solutions to problems arising in the development and implementation of an activity or program. |
| Transparency and Accountability | measures the degree to which government decision making is transparent to citizens and the extent to which government is accountable to the public. |
| Rule of Law | measures the degree that the community government develops and applies the law fairly and without prejudice |
| Government Effectiveness | measures the extent that a government or community organization can effectively and equitably deliver services and programs to the community. |
| Self Determination | measures the degree to which communities have control over their own education, health services, police and fire services, and cultural facilities. |
| Intergovernmental Relationships | measures the extent that Aboriginal communities and other stakeholders are making a joint commitment to strengthen community well-being |
| Health & Well-being Indicators | |
| Physical Health | measures include Morbidity and Mortality, Disability and Chronic Disease. |
| Mental/Emotional Health | places significant emphasis on measuring for the effects of residential schools on individuals as well as the intergeneration impacts that persist today |
| Quality of Health Services | measures the quality of a health care system and its appropriateness (that is, the extent to which it meets community needs), to determine if a community’s physical and emotional health and healing needs are being met |
| Accessibility and Use of Health Services | assesses the extent to which health services are usable by the population which they are meant to serve |
| Community Engagement | measures the extent that community members are connected to one another through a variety of activities that promote cultural continuity, civic engagement and knowledge transmission in an effort to preserve culture while at the same time measuring community progress |
| Community Safety | measures standard rates of violence and crime and extent that culturally appropriate forms of justice and healing are available to community members |
| Social Support and Community Services | measures availability of programs and services |
| Adequate Housing | measures housing trends related to size, affordability and environmental impacts on health |
| Literacy and Language | assesses literacy levels in a population and the presence and use of indigenous language |
| Food Security | measures the extent that a community may be considered "food secure" in terms of traditional food practices, food cultivation and food knowledge transmission |
| Infrastructure Indicators | |
| Total infrastructure index | weighted measure of quality and quantity of telecommunications, transport, and electricity infrastructure |
| Infrastructure deficit | estimates the required funding to address capital infrastructure needs |
| Service life | time during which a structure fulfills all of the requirements placed upon it |
| Housing units requiring major repair | proportion or number of housing units requiring major repair |
| Service life of housing structure and components | service life, specific to housing structures |
| Housing safety and accidents | measures safety of the design, quality and general conditions of a home as it relates to accidents and injuries |
| Canadian Water Sustainability index | includes indicators for the key policy areas of human health, infrastructure, capacity, environment, and resource |
| Internet access | tracks whether communities have dial-in, high-speed, other type of internet access, or no access |
| Degree of isolation | classifies First Nations communities into one of four degrees of isolation |
| Travel time | measures amount of time required travelling for day-to-day activities |
| Net energy import | total primary energy supply minus the amount of energy imports |
| Share of household income spent on energy and electricity | average share of household disposable income spent on fuel and electricity |
Bibliography
Overview and Scope & Research Approach
Besleme, K. & Mullin, M. (1997, Spring). Community indicators and healthy communities. National Civic Review 86(1), pp. 43-52.
Cajate, G. Native science: Natural laws of interdependence. Santa Fe: Clear Light Press.
Canada, Royal Commission on Aboriginal Peoples. (1996). The north. In Report of the Royal Commission on Aboriginal Peoples, Vol. 4, Perspectives and Realities, pp. 387-497.
Centre for Aboriginal Economic Policy Research. Working paper database. (2009). Retrieved July 23, 2009.
Chino, M. & Debruyn, L. (2006, April). Building true capacity: Indigenous models for Indigenous communities. American Journal of Public Health 96(4). pp. 596-599.
Fraser, E.D.G. et al. (2006). Bottom up and top down: Analysis of participatory processes for sustainability indicator identification as a pathway to community empowerment and sustainable environmental management. Journal of Environmental Management 78, pp.114-127.
Golds, et. Al. (1997). Healthy Aboriginal communities. Australian and New Zealand Journal of Public Health 21(4), pp. 386-390.
Health Canada Population and Public Health Branch. (2002). What determines health? Ottawa, ON: Health Canada. Retrieved March 8, 2004.
Hertzman, C. (2000). The case for an early childhood development strategy. ISUMA: Canadian Journal of Policy Research, 1(2), pp. 11-18.
Higgins, C. 2000. Indigenous knowledge and occidental science: How both forms of knowledge can contribute to an understanding sustainability. In Proceedings, from science to management and back: a science forum for southern interior ecosystems of British Columbia.
Hollstedt, K. Sutherlandand T. Innes (eds.). Southern interior forest extension and research partnership, pp. 147–151.
Hunt, J. & Smith, D.E. (2007). Indigenous community governance project: Year two research findings. (CAEPR Working Paper No. 36/2007). The Australian National University.
Kishk Anaquot Health Research. (2008, June). Taking a pulse on the quality of indigenous community life: Considerations and challenges in measuring "successful" First Nations’ community.
McMurray, A. (2006). Community health and wellness: A socio-ecological approach.
Mussell, B, Cardiff, K., & White, J. (2004). The Mental health and well-being of Aboriginal youth and children: Guidance for new approaches and services. Vancouver: University of British Columbia.
Plumptre, T. & Graham, J. (1999). Governance and good governance: International and Aboriginal perspectives. Institute on Governance. Retrieved July 23, 2009.
Prescott-Allen, R. (2001). The well-being of nations: A country-by-country index of quality of life and the environment. Washington, D.C.: Island Press. Retrieved October 13, 2009
Richmond, et al. (2004). The political ecology of health: Perceptions of environment, economy, health and well-being among Namgis First Nation. Health and Place 11, pp. 349-365.
Sawicki, D.S. (2002). Improving community indicator systems: Injecting more social science into the folk movement. Planning Theory and Practice 3(1), pp. 13-32.
Statistics Canada (2001). Harvesting and community well-being among Inuit in the Canadian Arctic. Preliminary findings from the 2001 Aboriginal Peoples Survey – Survey of Living Conditions in the Arctic, Cat. no. 89-619-XIE.
Statistics Canada. (2009). Health indicators. Retrieved August 17, 2009.
United Nations. (2008). Millennium development goals indicators: Official UN site for the MGD indicators. Retrieved August 15, 2009.
Wilson, A. (2004, March). Living well: Aboriginal women, cultural identity and wellness. Winnipeg: Prairie Women’s Health Centre of Excellence
Health & Well-Being
Aboriginal Health Foundation. (2003). Aboriginal people, resilience and the residential school legacy. Ottawa: Aboriginal Healing Foundation.
Andelson, Naomi. (2005, March-April). The embodiment of inequity – Health disparities in Aboriginal Canada. Canadian Journal of Public Health.
Anderson, M., Smylie, J.anderson, I., Sinclair, R., & Crengle, S. (2006, March). First Nations, Métis and Inuit health indicators in Canada. Retrieved May 25, 2009.
Agri-Food Canada. (1998). Canada ’s action plan for food security: In response to the World Food Summit Plan of Action. Ottawa, ON.
Assembly of First Nations. (2006, March). First Nations’ wholistic approach to indicators. Retrieved August 7, 2009.
Assembly of First Nations Health and Social Secretariat. (2006, May). The development of a First Nations health reporting framework. Retrieved June 3, 2009.
Assembly of First Nations. (2007). First Nation regional longitudinal health survey RHS 2002/03: Results for adult, youth and children living in First Nation communities. Retrieved July 23, 2009.
Assembly of First Nations. (n.d.). Health policy areas. Retrieved May 21, 2009.
Canadian Institute for Health Information. (2005). Creating an index of healthy Aboriginal communities. In Developing healthy communities index: A collection of papers. Ottawa, ON.
Cardinal, N. (2006). The exclusive city: Identifying, measuring and drawing attention to Aboriginal and Indigenous experiences in an urban context. Cities, 23 (3), pp. 217-226.
Centre for Native Policy and Research. (2005). An urban Aboriginal life: The 2005 indicators report on the quality of Aboriginal people in the Greater Vancouver Region.
Cardinal, N. & Emilie K. (2002, Sept). Comparable health and health system performance indicators for Canada, the provinces and territories. Retrieved July 15, 2009.
Correctional Services Canada. (2004). Strategic plan for Aboriginal corrections: Facts and figures. Retrieved August 15, 2009.
Demographic and Health Surveys. (n.d.). Understanding survey statistics. Retrieved July 15, 2009.
Department of Justice Canada. (2005). Aboriginal justice strategy formative evaluation: Summary, recommendations and management response. Ottawa, ON: Evaluation Division.
First Nations Centre. (2007). Understanding health indicators. Ottawa: National Aboriginal Health Organization.
Frohlich, K. L., Ross, N., & Richmond, C. (2006). Health disparities in Canada today: Some evidence and a theoretical framework. Health Policy 70, pp. 132-143.
Frohlich, N. & Mustard, C.. (1996). A regional comparison of socioeconomic and health indices in a Canadian province. Social Science & Medicine 42 (9), pp. 1273-1281.
Hallett, D., Chandler, M., & Lalonde, C. (2007). Aboriginal language knowledge and youth suicide. Cognitive Development 22 (3), pp. 392-399.
Health Canada. (2004). Canadian Community Health Survey Cycle 2.2, nutrition: income-related household food security in Canada. Ottawa: Office of Nutrition Policy and Promotion Health Products and Food Branch.
Health Canada (2005). First Nations, Inuit and Aboriginal health: First Nations comparable health indicators. Retrieved July 16, 2009.
Health Canada (2006). Healthy Canadians: A federal report on comparable health indicators. Retrieved July 15, 2009.
Health Council of Canada. (2005). The health status of Canada’s First Nations, Métis and Inuit peoples. Retrieved July 17, 2009.
Human Resources and Skills Development Canada. (n.d.). Indicators of well-being in Canada. Retrieved July 16, 2009.
Kishk Anaquot Health Research. (2008, June). Taking a pulse on the quality of indigenous community life.
Lalonde, C. E. (2006). Identity formation and cultural resilience in Aboriginal communities. In Promoting Resilience in Child Welfare, Flynn, R.J., Dudding, P., & Barber, J. (Eds.), pp 52-71. Ottawa: University of Ottawa Press.
Lalonde, C.E. (2005). Creating an index of healthy Aboriginal communities. In Developing a Healthy Communities Index: A collection of papers, pp. 21-27. Report prepared for the Canadian Population Health Initiative, Canadian Institute for Health Information.
Marks, E., Cargo, M. D, & Daniel, M. (2007). Constructing a health and social indicator framework for Indigenous community health research. Social Indicators Research, 82, pp. 93-110.
Millar, J.S. & C. Hull. (1997). Measuring human wellness. Social Indicators Research, 40, pp. 147-158.
Minore, B. and Katt, M. (2007). Aboriginal health care in Northern Ontario – Impacts of self-determination and culture. IRPP Choices, 13 (6), pp. 1-19.
Newbold, B. K., (1998). Problems in search of solutions: Health and Canadian Aboriginals. Journal of Community Health, 23 (1), pp. 59-73.
Northwest Territories Health and Social Services. (2003, Jan.). NWT health and social services performance measurement reporting. Retrieved June 22, 2009.
Northwest Territories Bureau of Statistics. (2003, Aug.). NWT social indicators consultation report. Retrieved June 22, 2009.
Northwest Territories Health and Social Services. (2004, Nov.). Report to residents of the Northwest Territories on comparable health and health system indicators. Retrieved June 22, 2009.
O’Donnell, V. & Tait, H. (2004, Spring). Well-being of the non-reserve Aboriginal population. In Canadian Social Trends. Statistics Canada- Catalogue no 11-008.
Office of the Auditor General of Canada. (2008). Chapter 8—Reporting on health indicators. Retrieved July 15, 2009.
Office of the Provincial Health Officer. (2007). Pathways to health and healing – 2nd report on the health and well-being of Aboriginal people in British Columbia. Retrieved August 12, 2009.
Reading, C. Loppie & Wien, F. (2009). Health inequalities and social determinants of Aboriginal peoples’ health. National Collaboration Centre for Aboriginal People’s Health.
Richmond, C.A.M. & Ross, N. A. (2009). The determinants of First Nations and Inuit health: A critical population health approach. Health & Place, 15, pp. 403-411.
RHS Cultural Framework. (2005). Retrieved June 3, 2009.
Royal Commission on Aboriginal Peoples. (1996). Social and Emotional Health, 3 (2). Retrieved Aug 5, 2009.
Smylie, J. & Anderson, M. (2006). Understanding the health of Indigenous peoples in Canada: Key methodological and conceptual challenges. CMAJ, 175 (6), pp. 602-605.
Statistics Canada. (2000). Health indicators definition and data sources. Retrieved July 16, 2009.
Statistics Canada, (2004). Canada Community Health Survey. Retrieved June 3, 2009 .
Statistics Canada. (2006 A). Aboriginal peoples in Canada in 2006: Inuit, Métis and First Nations, 2006 Census. Retrieved July 14.
Statistics Canada. (2006 B). Aboriginal Peoples Survey: Questionnaire(s) and reporting guide(s). Retrieved Aug 10, 2009.
The Transformative Change Accord: First Nations Health Plan. (n.d.) Retrieved August 10, 2009.
Treasury Board of Canada (2005). Aboriginal Affairs: program and spending. Retrieved July 15, 2009.
Treasury Board of Canada (2005). Canada ’s performance report 2005. Retrieved July 16, 2009,
Unicef. (2009). Canadian supplement to the state of the world’s children, 2009: Aboriginal children’s health: Leaving no child behind. Retrieved July 29, 2009.
United Nations, Department of Economic and Social Affairs. (2006). Meeting on Indigenous peoples and indicators of well-being: First Nations’ wholistic approach to indicators. Ottawa: Assembly of First Nations.
United Nations, Department of Economic and Social Affairs. (2006). Meeting on Indigenous peoples and indicators of well-being: framework and summary of key issues for the development of cultural indicators for food security, food sovereignty and sustainable development. Ottawa: International Indian Treaty Council.
White, J. P. & Maxim, P. S. (2007). Community well-being: A comparable communities analysis. Ottawa: Strategic Research and Analysis Directorate Indian and Northern Affairs Canada.
Wilson, K. & Rosenberg, M. (2002). Exploring the determinants of health for First Nations peoples in Canada: Can existing frameworks accommodate traditional activities? Social Science & Medicine 55, pp. 2017-2031.
Environment
European Environment Agency. (2009). Environmental risk assessment – Approaches, experiences and information sources: Chapter 2 : The use of risk assessment in environmental management. Retrieved August 2, 2009.
Five Winds International. (2004). Tools and concepts for environmental sustainability - Environmental risk assessment. Retrieved August 2, 2009.
Fraser Basin Council. (2003). A snapshot on sustainability: State of the Fraser Basin report. Retrieved June 29, 2009.
Global Footprint Network. (2009). Footprint basics – Overview. Retrieved June 25, 2009.
Government of Canada. (2008). Canadian environmental sustainability indicators 2008. Retrieved June 1, 2009.
Government of Canada. (2005). State of the environment infobase. Retrieved August 24, 2009.
Government of Canada Program for International Polar Year (2007). IPY science and research projects: Call for proposals: Program description. Retrieved August 16, 2009.
Hockings, M. Stolton, S. & Dudley, N. (2000). Evaluating effectiveness. A framework for assessing the management of protected areas. In IUCN World Commission on Protected Areas Best Practices Area Guidelines No. 6. (Ed. Phillips, A.).
Indian and Northern Affairs Canada (2008). Evaluation of INAC’s contaminated sites management policy and programming. Retrieved July 30, 2009.
Sustainable Measures. (2009). Database. Retrieved August 3, 2009.
United Nations Economic and Social Affairs. (2007). Indicators of sustainable development: Guidelines and methodologies. New York: United Nations publication.
Yale Center for Environmental law and Policy & Center for International Earth Science Information Network. (2008). Environmental Performance Index 2008. Retrieved July 20, 2009.
Education
Aboriginal Education Council, School District 71 (Comox Valley) and the British Columbia Ministry of Education. (2006). Aboriginal enhancement agreement. Retrieved July 20, 2009.
Alberta Education. (2009). Performance measures. Retrieved August 6, 2009.
British Columbia Provincial Government. (n.d.) New relationships with Aboriginal peoples and communities in BC: Measuring outcomes. Retrieved July 15, 2009.
Canadian Council on Learning. (2009a). Composite learning index. Retrieved July 15, 2009.
Canadian Council on Learning. (2009b). Indicator fact sheet 6: Participation in job-related training. Retrieved August 4, 2009.
Cappon, P. (2008). Measuring success in First Nations, Inuit and Métis learning. In Options Politiques.
Cardinal, N. and Emilie A. (2005). The 2005 indicator report on the quality of life of Aboriginal people in the Greater Vancouver Region. Centre for Native Policy and Research. Retrieved June 3, 2009.
Education Quality Accountability Office. (n.d.). Completing the picture: The education quality indicators framework. Retrieved July 15, 2009.
Council of Ministers of Education, Canada. (2009). Pan-Canadian assessment program. Retrieved July 22, 2009.
European Commission Joint Research Centre Institute for the Protection and Security of the Citizen Centre for Research on Lifelong Learning (CRELL). Retrieved July 13, 2009.
First Nations School Association. Progress towards First Nations education jurisdiction. Retrieved August 6, 2009.
Government of Alberta. (2009). Education performance measures. Retrieved July 20, 2009.
Henchey, N. (2009). Moving forward on Aboriginal education: Proceedings of a national policy roundtable. Concordia University Society for the Advancement of Excellence in Education. Retrieved July 15, 2009.
IES National Centre for Education Statistics. (2007). Education indicators: An international perspective. U.S. Department of Education Institute of Education Sciences. Retrieved June 10, 2009.
IES National Centre for Education Statistics. (2009). Comparative indicators of education in the United States and other G-8 countries. Retrieved June 10, 2009.
IES National Centre for Education Statistics. (1997). International education indicators: A time series perspective. Retrieved July 14, 2009.
Indicators of a Successful Aboriginal Education Program in your school A Simple Checklist retrieved July 14, 2009.
International Association for the Evaluation of Educational Achievement. (n.d.). Completed studies. Retrieved June 8, 2009.
Keenan T. (2009). Indigenous education and social policy development in NSW. Australian Social Policy Conference 8-10 July 2009. University of New South Wales
Matheson, N., et al. Education indicators: An international perspective. Pevalin Research Institute, National Center for Education Statistics. Retrieved July 13, 2009.
Mendelson, M. (2006) Aboriginal peoples and post-secondary education in Canada. Caledon Institute of Social Policy.
OECD. (2009), Society at a glance 2009 - OECD social indicators. Retrieved July 13, 2009.
Offord Centre for Child Studies. School readiness to learn project. Retrieved August 6, 2009.
Ontario Ministry of Education. (2007). Ontario First Nation, Métis and Inuit education policy framework: Delivering quality education to Aboriginal students in Ontario’s provincially funded schools. Retrieved July 30, 2009.
Pevalin Policy Institute/National Centre for Education Statistics (2009). Education Indicators – An international perspective. Retrieved July 5, 2009.
Productivity Commission, Australia Government. (2008). Overcoming Indigenous disadvantage: Key indicators 2007. Retrieved July 15, 2009.
R.A. Malatest & Associates Ltd. (2004, Jan.). Aboriginal peoples and post-secondary education – What educators have learned? Canadian Millennium Scholarship Foundation. Retrieved July 14, 2009.
Saskatchewan Provincial Government. (2008). Saskatchewan Education Core Indicators. Retrieved July 13, 2009.
Scott, T. (2007). Aboriginal learning: A review of current metrics of success. Canadian Council on Learning, Aboriginal Learning Knowledge Centre.
Society for the Advancement of Excellence in Education. (2005, Feb.). Moving forward in Aboriginal education – Proceedings of a National Policy Roundtable. Montreal: Concordia University.
Statistics Canada (2007). Education indicators in Canada: Report of the Pan-Canadian education indicators program, 2007. (StatsCan 81-582).
White, et al., (eds). (2009). Aboriginal education: Current crisis, future alternatives. Toronto: Thompson Education Publishing Inc.
UNESCO Institute for Statistics. (n.d.). Education indicators technical guidelines. Retrieved July 15, 2009.
UNESCO. (1997). International standard classification of education. Retrieved July 13, 2009.
UNESCO Institute for Statistics (2004). Global education digest: Comparing education statistics across the world. Retrieved July 13, 2009.
UNESCO Institute for Statistics. (2008). Education indicators – Mechanisms to gather data from national sources: Workshop on MDG monitoring, Bangkok, Thailand. Retrieved on July 13, 2009 from, UNESCO Institute for Statistics.
Economy
Anderson, R. B., Kayseas, L. P. D., & Hindle K. Indigenous land claims and economic development: The Canadian experience.
Atlantic Canada Opportunities Agency. (2003). Aboriginal economic development in Atlantic Canada: Lessons learned and best practices. Moncton: Atlantic Canada Opportunities Agency.
Bolt, K., Matete, M., & Clemens, M. (2002).Manual for calculating adjusted net savings. Retrieved July 20, 2009.
Damus, Sylvester, Liljefors & Kristin. (2004). Analysis of some indicators of economic development of First Nation and northern communities. Ottawa: Institute on Governance.
DB Caldwell Research Associates Inc. (2007). Provincial and territorial approaches to economic development of Aboriginal peoples. Prepared for Indian and Northern Affairs Canada.
Government of Canada. (2007). Economic concepts: Employment rate. Retrieved August 5, 2009.
Statistics New Zealand. (2008). Economic indicators. Retrieved July 20, 2009.
United Nations Economic and Social Affairs. (2007). Indicators of sustainable development: Guidelines and methodologies. New York: United Nations publication.
Watson, B. (2009). Analysis of economic development indicators." Audit & Evaluation Sector, Indian and Northern Affairs Canada.
Governance
Canada, Standing Senate Committee on Aboriginal Peoples. (2007). Sharing Canada’s prosperity – A hand up, not a handout: Special report on the involvement of Aboriginal communities and business in economic development activities in Canada. Retrieved June 10, 2009.
Cornell, S. & Kalt, J. (1998). Sovereignty and nation building: The development challenge in Indian country. The Harvard Project on American Indian Economic Development. Retrieved July 12 2009.
Indian and Northern Affairs Canada. (2009a). About INAC. Retrieved August 15, 2009.
Indian and Northern Affairs Canada. (2009b). General briefing note on self-government and claims policy of Canada and the status of claims.
Indian and Northern Affairs Canada. (2009c). Program Activity Architecture 2009-2010, Retrieved May 16, 2009.
Institute on Governance. (1999). Understanding governance in strong Aboriginal Communities: Phase One: Principles and best practices from the literature. Ottawa, ON.
Institute on Governance. (2009). In search of common ground: Reconciling Western-based governance principles and First Nations traditions. Ottawa: Jodi Buhn.
Kishk Anaquot Health Research. (2008). Taking the 'pulse’ on the quality of Indigenous community life. Considerations and challenges in measuring 'successful’ First Nations Community. Health Canada: First Nations and Inuit Health Branch.
National Centre for First Nations Governance. (2008a). Principles to support good governance. Retrieved August 10, 2009.
National Centre for First Nations Governance. (2008b). Governance think tank summary report. Retrieved July 20, 2009.
National Centre for First Nations Governance (NCFNG). (2009a). The people. Retrieved August 13, 2009.
National Centre for First Nations Governance. (2009b) Toolkit. Tsteil-Waututh Nation. Retrieved August 15, 2009.
National Centre for First Nations Governance. (2009c). Governance best practices report. Retrieved July 12, 2009.
Native Nations Institute for Leadership, Management and Policy. (2003) The concept of governance and its implications for First Nations. Retrieved May 20, 2009.
Royal Commission on Aboriginal Peoples. (1996). Governance, Vol. 2, Chap. 3. Retrieved Aug 15, 2009.
Taylor, J. (1992). Negotiating a vision: Principles of comprehensive resource planning and a planning process for the White Mountain Apache Tribe. Malcom Weiner Center for Social Policy. Retrieved August 15 2009.
Taylor, JB. (2008). Determinants of development success in the Native nations of the United States. Native Nations Institute for Leadership, Management and Policy Retrieved Aug 5, 2009.
Infrastructure
Assembly of First Nations. (2007). First Nation regional longitudinal health survey RHS 2002/03: Results for adult, youth and children living in First Nation communities. Retrieved July 23.
Australian Institute of Health and Welfare, Government of Australia. (2009). Indigenous housing indicators 2007-08. Retrieved August 11, 2009.
Barney, D.D. (2005). Communication Technology. Volume 8 of Canadian democratic audit Community Technology. UBC Press.
Bennett, G.G., McNeil, L.H., Wolin, K.Y., Duncan, D.T., Puleo, E., Emmons, K.M. (2007, Oct.). Safe to walk? Neighborhood safety and physical activity among public housing residents. PLoS Medicine 4(10), pp. 1599-1607.
Bethune, D.N. (1997). Environmental damage and Aboriginal health: Contamination of Aboriginal water resources. National Indian & Inuit Community Health Representatives Organization. Retrieved July 23, 2009.
Blair et al. (2005). The Western Australian child health survey: Findings to date on adolescents. Medical Journal of Australia 183 (8), pp. 433-35.
Burridge, R. & Ormandy, eds. (1993). Unhealthy housing: Research, remedies and Reform. New York: E & FN Spawn.
Canadian Architect. (n.d.). Durability implications. Retrieved August 13, 2009.
Cardinal, N. (2005, Nov). An urban aboriginal life: The 2005 indicators report on the quality of life of Aboriginal people in the Greater Vancouver region. Vancouver: Centre for Native Policy and Research. Retrieved August 11, 2009.
Canadian Mortgage and Housing Corporation (2006). Definitions of variables. Retrieved August 07, 2009.
CMHC/INAC. (2004, November). Aboriginal housing background paper. Retrieved August 03, 2009.
Conversation on Health. (2007). Summary of Input on the Conversation on Health Victoria, B.C.: Conversation on Health. Retrieved August 14, 2009.
Department of Finance Canada. (2009). Canada’s economic action plan – Budget 2009. Retrieved August 11, 2009.
Environment Canada. (2008). Water and Canada’s Aboriginal peoples. Retrieved 13, 2009.
Federation of Canadian Municipalities and National Research Council. (2002). Developing Indicators and Benchmarks – A Best Practice by the National Guide to Sustainable Municipal Infrastructure. Retrieved July 12, 2009.
First Nations Information Governance Committee. (2006, June). First Nations regional longitudinal health survey (RHS) 2002-03: Report on First Nations’ housing. Retrieved July 30, 2009.
Government of Canada. (2005). Taking action on federal contaminated sites: An environmental and economic priority. Retrieved August 13, 2009.
Health Canada. (2009). A Statistical Profile on the Health of First Nations in Canada: Determinants of Health, 1999 to 2003. Retrieved August 11, 2009.
Housing Corporation. (2007, April). Housing quality indicators: Version 4. Retrieved July 23, 2009.
Indian and Northern Affairs Canada. (2008). First Nations water management strategy. Retrieved August 11, 2009.
Indian and Northern Affairs Canada (INAC). (2009). Element descriptions. (Internal document).
Indian and Northern Affairs Canada (INAC). (2003). National Assessment of Water and Wastewater Systems in First Nations Communities: Summary report.
Indian and Northern Affairs Canada (INAC). (2005). 2004 Report on Aboriginal Community Connectivity Infrastructure. Retrieved July 11, 2009.
Indian and Northern Affairs Canada (INAC). (2008a). Community infrastructure. Retrieved August 12, 2009.
Indian and Northern Affairs Canada (INAC). (2008). Plan of action for drinking water in First Nations communities – Progress Report, January 17, 2008. Retrieved August 11, 2009.
Indian and Northern Affairs Canada (INAC). (2008.) Backgrounder - First Nations water and wastewater action plan.
International Atomic Energy Agency. (2005). Energy indicators for sustainable development: guidelines and methodologies. United Nations Publications.
Jernberg, P., Haagenrud, S.E., Sjöström, C & Lacasse, M.A. (2004). Guide and bibliography to Service life and durability research fro building materials and components. Retrieved August 13, 2009.
Masters, L.W. & Brant, E. (1989). Systematic methodology for service life prediction of building materials and components. Materials and structures 22, pp. 385-392.
Muoghalu, L.M. (1991). Measuring housing and environmental quality as an
indicator of quality of urban life: A case traditional city of Benin. Social Indicators Research 25, pp. 63-98.
National Aboriginal Health Organization. (2006, June). Resources for First Nations on injury prevention: An annotated bibliography. Retrieved August 11, 2009.
National Research Council of Canada. (1993). Durability of civil engineering structures – Annotated bibliography. Internal document.
Nicoletti, G, et al. (2003). Policies and International Integration: Influences on Trade and Foreign Direct Investment. OECD Economics Department Working Papers, No. 359. Retrieved June 12, 2009.
Nunavut Broadband Task Force. (2002). Sivumuuqpallianiq, Moving Forward: Strengthening for Self-Reliance in the Information Age - Report of the Nunavut Broadband Task Force. Retrieved August 14, 2009.
Paperny, A.M. (2009, August 16). Building the Arctic. The Globe and Mail.
Pembina Institute (2007). Sustainable communities. Retrieved August 13, 2009.
Pembina Institute. (2008). Aboriginal Energy Alternatives: Summary Report.
Policy Research Initiative, Government of Canada. (2007, February). Canadian water sustainability index (CWSI): Project report. Retrieved July 25, 2009.
PWGSC (Public Works and Government Services Canada). (2005). Canadian Community Infrastructure – An Analysis of First Nations on Reserve Versus Canadian Off Reserve Community Infrastructure Deficit. Retrieved August 7, 2009.
Roberts, P., K.C., S.and Rastogi, C. (2006). Rural Access Index: A Key Development Indicator. The World Bank Group Transport Papers. Retrieved August 13, 2009.
SFU (Simon Fraser University). (2008). First Nations Communication Research: Final Report. Retrieved August 13, 2009.
Shohet, I.M. (2003, October). Building evaluation methodology for setting maintenance priorities in hospital buildings. Construction Management and Economics 21, pp. 681-92.
Statistics Canada. (2006a). Aboriginal peoples in Canada in 2006: Inuit, Métis and First Nations, 2006 Census. Retrieved July 14.
Statistics Canada. (2006b). The General Social Survey: An Overview. Retrieved August 12, 2009.
Transportation Tomorrow Survey. (2006). Transportation Tomorrow Survey Website. Retrieved August 13, 2009.
Unicef. (2009). Canadian supplement to the state of the world’s children, 2009: Aboriginal children’s health: Leaving no child behind. Retrieved July 29, 2009.
Vera, I.A. et al. (2005). Indicators for sustainable energy development: An initiative by the International Atomic Energy Agency. Natural Resources Forum 29, pp. 274-283.
WHO Europe. (2004). WHO technical meeting on "housing health indicators": Results of review and data availability screening in member states. Retrieved August 12, 2009.
Footnotes:
- Chino & DeBruyn (2006) (return to source paragraph)
- Mussell, Cardiffand White (2004); Kishk Anaquot Health Research (2008) (return to source paragraph)
- Wilson (2004) (return to source paragraph)
- Higgins (2000) (return to source paragraph)
- Royal Commission on Aboriginal Peoples (2006) (return to source paragraph)
- Royal Commission on Aboriginal Peoples (2006) (return to source paragraph)
- Statistics Canada (2001) (return to source paragraph)
- Hunt & Smith (2007); Plumptre & Graham (1999) (return to source paragraph)
- Hunt & Smith (2007) (return to source paragraph)
- Kishk Anaquot Health Research (2008) (return to source paragraph)
- United Nations (2008) (return to source paragraph)
- See for instance Statistics Canada (2009) (return to source paragraph)
- Belseme & Mullin (1997) (return to source paragraph)
- Kishk Anaquot Health Research (2008) (return to source paragraph)
- Cajate (2000) (return to source paragraph)
- RHS (2005) (return to source paragraph)
- RHS (2005), p. 146 (return to source paragraph)
- McMurray (2006) (return to source paragraph)
- Richmond, et al. (2004) (return to source paragraph)
- Prescott-Allen (2001) (return to source paragraph)
- Chouinard & Cousins (2007) (return to source paragraph)
- INAC (2009) (return to source paragraph)
- Royal Commission on Aboriginal People Volume 3 (1996), p. 184 (return to source paragraph)
- Reading and Wien (2009), p. 3 (return to source paragraph)
- First Nations Regional Longitudinal Health Survey (2003) (return to source paragraph)
- Minore & Katt (2007) (return to source paragraph)
- Minore & Katt (2007); Health Canada (2005) (return to source paragraph)
- Statistics Canada (2006a) (return to source paragraph)
- Royal Commission on Aboriginal People Volume 3 (1996) (return to source paragraph)
- Lalonde (2005) (return to source paragraph)
- Lalonde (2005) p. 23 (return to source paragraph)
- Health Council of Canada (2005) (return to source paragraph)
- Aboriginal Healing Foundation (2003), p. 33 (return to source paragraph)
- Reading & Wien (2009) (return to source paragraph)
- Assembly of First Nations (2006) (return to source paragraph)
- Report on the Royal Commission of Aboriginal People (1996) (return to source paragraph)
- Lalonde (2005), p. 23 (return to source paragraph)
- Health Canada (2006) (return to source paragraph)
- Aboriginal Peoples Survey (2006); Health Canada (2006) (return to source paragraph)
- First Nations Centre (2007), p. 38 (return to source paragraph)
- CNPR (2005) (return to source paragraph)
- Correctional Services Canada (2009) (return to source paragraph)
- Correctional Services Canada (2004), p. 60 (return to source paragraph)
- Department of Justice Canada (2005) (return to source paragraph)
- Office of the Provincial Health Officer BC (2007), p. 60 (return to source paragraph)
- UNICEF (2009) (return to source paragraph)
- Statistics Canada (2006) (return to source paragraph)
- First Nations Centre (2007) (return to source paragraph)
- Statistics Canada (2006) (return to source paragraph)
- First Nations Centre (2007) (return to source paragraph)
- First Nations Centre (2007) (return to source paragraph)
- Office of the Provincial Health Officer BC (2007) (return to source paragraph)
- Chandler (2007) (return to source paragraph)
- Hallet (2007), p. 3 (return to source paragraph)
- Agriculture and Agri-Food Canada (1998) (return to source paragraph)
- Statistics Canada (2004) (return to source paragraph)
- United Nations Department of Economic and Social Affairs (2006) (return to source paragraph)
- Smylie & Anderson (2006) (return to source paragraph)
- Smylie & Anderson (2006) (return to source paragraph)
- Lederman (1999), p. 60 in Minore & Katt (2007), p. 6 (return to source paragraph)
- Smylie & Anderson (2006), p. 604 (return to source paragraph)
- Environment Canada (2009) (return to source paragraph)
- Ibid. (return to source paragraph)
- Ibid. (return to source paragraph)
- Ibid. (return to source paragraph)
- United Nations (2007) (return to source paragraph)
- Ibid. (return to source paragraph)
- European Environment Agency (2009) (return to source paragraph)
- Five Winds International (2004) (return to source paragraph)
- United Nations (2007) (return to source paragraph)
- Ibid. (return to source paragraph)
- Ibid. (return to source paragraph)
- Sustainable Measures (2009) (return to source paragraph)
- Environment Canada (2009) (return to source paragraph)
- International Polar Year (2008) (return to source paragraph)
- The primary greenhouse gases assessed are carbon dioxide, methane, nitrous oxide, sulfur hexafluoride, perfluorocarbons and hydrofluorocarbons. Environment Canada (2009) (return to source paragraph)
- Environment Canada (2009) (return to source paragraph)
- Ibid. (return to source paragraph)
- Ibid. (return to source paragraph)
- United Nations (2007) (return to source paragraph)
- United Nations (2007) (return to source paragraph)
- Yale and Columbia Universities (2008) (return to source paragraph)
- White et al. (2009), p. 3 (return to source paragraph)
- Statistics Canada (2007) (return to source paragraph)
- Statistics Canada (2007), p. 71 (return to source paragraph)
- Saskathewan Core Indicators (2008), p. 5 (return to source paragraph)
- White et al. (2009) (return to source paragraph)
- White et al. (2009) (return to source paragraph)
- Saskatchewan Core Indicators (2008) (return to source paragraph)
- Statistics Canada (2007) (return to source paragraph)
- IES National Centre for Education Statistics (2007) (return to source paragraph)
- Alberta Education (2009) (return to source paragraph)
- Offord Centre for Child Studies (2009) (return to source paragraph)
- White et al. (2009) (return to source paragraph)
- Bolt, Matete, & Clemens (2002) (return to source paragraph)
- Atlantic Canada Opportunities Agency (2003) (return to source paragraph)
- Ibid. (return to source paragraph)
- Ibid. (return to source paragraph)
- Ibid. (return to source paragraph)
- Ibid. (return to source paragraph)
- Ibid. (return to source paragraph)
- Government of Canada (2007) (return to source paragraph)
- Ibid. (return to source paragraph)
- United Nations (2007) (return to source paragraph)
- Ibid. (return to source paragraph)
- Statistics New Zealand (2008), p.5 (return to source paragraph)
- Ibid. (return to source paragraph)
- National Centre for First Nations Governance (2009a), p. iv (return to source paragraph)
- RCAP, V. 2, Chapter 3 (1996) (return to source paragraph)
- Lalonde (2001) (return to source paragraph)
- 2007 Standing Senate Committee on Aboriginal Peoples (2007), p. 52 (return to source paragraph)
- INAC (2009-2010) (return to source paragraph)
- National Centre for First Nations Governance (2009a) (return to source paragraph)
- Buhn (2009) (return to source paragraph)
- Cornell & Kalt (1998) (return to source paragraph)
- Taylor (1992) (return to source paragraph)
- National Centre for First Nations Governance (2009b) (return to source paragraph)
- National Centre for First Nations Governance (2008b) (return to source paragraph)
- Ibid (return to source paragraph)
- Kishk Anaquot Health Research (2008, June) (return to source paragraph)
- National Centre for First Nations Governance (2009a) (return to source paragraph)
- Ibid. pg 13 (return to source paragraph)
- Ibid. (return to source paragraph)
- National Centre for First Nations Governance (2009b) (return to source paragraph)
- Cornell & Kalt (1998) (return to source paragraph)
- Kishk Anaquot Health Research (2008, June) (return to source paragraph)
- Ibid. (return to source paragraph)
- Cornell and Kalt (2008), p.11 (return to source paragraph)
- Taylor (2008), p.2 (return to source paragraph)
- Cornell, Curtis and Jorgensen (2003), p.8 (return to source paragraph)
- National Centre for First Nations Governance (2008b). p. 3 (return to source paragraph)
- Taylor (2008), p. 3 (return to source paragraph)
- INAC (2009) (return to source paragraph)
- Institute on Governance (2009), p.16 (return to source paragraph)
- National Centre for First Nations Governance (2008b) (return to source paragraph)
- Cornell and Kalt (2008), p. 19 (return to source paragraph)
- National Centre for First Nations Governance (2008), p. 12 (return to source paragraph)
- Institute on Governance (2009), p. 19 (return to source paragraph)
- Cornell, Curtis and Jorgensen (2003), p.8 (return to source paragraph)
- Institute on Governance (1999), p. 47 (return to source paragraph)
- Ibid, p. 33 (return to source paragraph)
- Bethune (1997) (return to source paragraph)
- INAC (2005) (return to source paragraph)
- Unicef (2009); Blair (2005); Muoghalu (1990) (return to source paragraph)
- Unicef (2009) (return to source paragraph)
- Pembina Institute (2007) (return to source paragraph)
- Nicoletti, G, et al. (2003) (return to source paragraph)
- PWGSC. (2005) (return to source paragraph)
- National Research Council of Canada (1993) (return to source paragraph)
- Ibid. (return to source paragraph)
- Shohet (2003) (return to source paragraph)
- See for instance Jernberg, Sjöström & Lacasse (2004) (return to source paragraph)
- Ibid. (return to source paragraph)
- Jernberg, Sjöström & Lacasse (2004) (return to source paragraph)
- Masters & Brant (1989) (return to source paragraph)
- Jernberg, Sjöström & Lacasse (2004); National Research Council of Canada (1993) (return to source paragraph)
- Canadian Architect (n.d.) (return to source paragraph)
- First Nations Information Governance Committee (2006) (return to source paragraph)
- Indian and Northern Affairs Canada. (2003) (return to source paragraph)
- Bethune (1997); Government of Canada (2005) (return to source paragraph)
- Policy Research Initiative (2007) (return to source paragraph)
- SFU. (2008). (return to source paragraph)
- Now managed by Indian and Northern Affairs Canada (return to source paragraph)
- "Even after connectivity is established, people experience serious inequalities in terms of how they use this medium (as passive consumers or as active contributors)…" (Barney, 2005) (return to source paragraph)
- Assembly of First Nations (2007) (return to source paragraph)
- First Nations Information Governance Committee (2006). Similarly, data from the 2006 Census indicates that Aboriginal households are more than three times as likely to live in a dwelling in need of major repairs than non-aboriginal households (Statistics Canada, 2006a). (return to source paragraph)
- Ibid., p. 6 (return to source paragraph)
- National Aboriginal Health Organization (2006) (return to source paragraph)
- Australian Institute of Health and Welfare (2009); Cardinal (2005); CMHC/INAC (2004); First Nations Information Governance Committee (2006); Statistics Canada (2006a) (return to source paragraph)
- CMHC (2006) (return to source paragraph)
- CMHC/INAC (2004); First Nations Information Governance Committee (2006) (return to source paragraph)
- Minor repairs include missing or loose floor tiles, bricks, shingles, railings, siding, defective steps, etc (return to source paragraph)
- i.e. Cardinal (2005) (return to source paragraph)
- Australian Institute of Health and Welfare (2009) (return to source paragraph)
- Housing Corporation (2007) (return to source paragraph)
- WHO Europe (2004) (return to source paragraph)
- Bennett, et al. (2007) (return to source paragraph)
- Burridge & Ormandy (1993); Housing Corporation (2007) (return to source paragraph)
- Roberts, P., K.C., S.and Rastogi, C. (2006) (return to source paragraph)
- Conversation on Health (2007) (return to source paragraph)
- Health Canada. (2009) (return to source paragraph)
- Roberts, P., K.C., S.and Rastogi, C. (2006) (return to source paragraph)
- Transportation Tomorrow Survey (2006) (return to source paragraph)
- Pembina Institute (2008) (return to source paragraph)
- The Federation of Canadian Municipalities and National Research Council (2002) consider indicators as being operational, tactical, or strategic. Strategic indicators are those indicators that assist in decision-making for higher-level officials. (return to source paragraph)
"Page details"
- Date modified: