Archived - Faro Mine Remediation Project: Surface Water Quality Monitoring Baseline Report, Winter 2018
Archived information
This Web page has been archived on the Web. Archived information is provided for reference, research or record keeping purposes. It is not subject to the Government of Canada Web Standards and has not been altered or updated since it was archived. Please contact us to request a format other than those available.
This report contains information on the key contaminants of concern at the Faro Mine site. These four contaminants have been known to exceed existing water quality guidelines in the past:
Surface water around the site is also tested for concentrations of many other potential contaminants including lead and mercury. Testing shows concentrations of lead and mercury are low and within water quality guidelines. The contaminants we focus on in this report were chosen since they are key indicators of deteriorating water quality on the Faro Mine site.
Concentrations of contaminants fluctuate with the seasons, falling in the spring as water flows increase and rising in the winter as water flows decrease. Concentrations of contaminants are higher at testing stations that are closer to the site, and are lower farther downstream.
Testing shows that ultimately the mine site has had little to no impact on contaminant levels in the Pelly River.
We provide detailed measurements for each contaminant at a number of monitoring stations in the sections below.
For more information please contact:
Faro Mine Remediation Project Team
415C-300 Main St Whitehorse, YT Y1A 2B5
aadnc.faromine.aandc@canada.ca
Telephone: 1-800-661-0451
Website: Remediating Faro Mine in the Yukon
About this report
This report shows the reported levels of each contaminant at several of our water monitoring stations located on the Faro Mine site over a period of 4 years, from 2014-2017. By comparing the data over these years we can see the changes in the amount of contamination that is occurring at each monitoring station.
This report will be published twice annually and is intended to provide a plain language summary of key surface water quality conditions at and around the Faro Mine area. A more detailed annual monitoring report which covers all water quality (surface, ground and seepage) will be available in 2018. Any questions regarding the content of this report can be directed to aadnc.faromine.aandc@canada.ca.
Background
The Faro Mine site was once the largest open pit lead-zinc mine in the world. Today, it is the site of one of the biggest abandoned mine remediation projects in Canada. It is located in south-central Yukon, near the Town of Faro, on the asserted traditional territory of Ross River Dena Council, Liard First Nation, and Kaska Dena Council and upstream of the traditional territory of the Selkirk First Nation. The Faro Mine site is 25 sq. km – an area roughly the size of Victoria, British Columbia. Processing the ore at the mine left behind 70 million tonnes of tailings and 320 million tonnes of waste rock, which have the potential to leach heavy metals and acid into the surrounding land and water.
The Faro Mine has several distinct areas, and falls within the watersheds of Rose Creek and Vangorda Creek, which drain into the Pelly River. Three major areas comprise the Faro Mine:
- Faro Mine site, including the Faro Pit, waste rock dumps and former mill
- Rose Creek tailings impoundment
- Grum and Vangorda mine areas and a road from Faro Mine site to these areas
Environmental monitoring at the Faro Mine is conducted on a regular basis for surface water and groundwater quality and quantity. Surface water quality is sampled monthly at about 60 locations and is sampled 7 times per year at some remote sites that are only accessible by helicopter.
Because of the volume of data generated in any given month, this report summarizes only key information from selected sites upstream, on site, and downstream from the site. The report focuses on the key contaminants of potential concern. Full reports from monitoring activities at the Faro Mine site can be downloaded at Waterline – Yukon Water Board filed under expired license #QZ95-003-1.
The table and map below outline the sampling stations selected for this report. Reference stations are not affected by mine contamination, and act as a baseline to which we can compare other sampling stations.
| Station | Description |
|---|---|
| Faro Creek/Rose Creek Area | |
| FC | Reference station (not impacted by the mine): Faro Creek upstream of the Faro Mine |
| X14 | Rose Creek immediately downstream of the mine site |
| R5 | Rose Creek downstream of its confluence with Anvil Creek (about 15 km from the mine site) |
| Vangorda-Grum Area | |
| V1 | Reference station (not impacted by the mine): Vangorda Creek upstream of mine site |
| V2 | Vangorda Creek, downstream of mine |
| VGMAIN | Vangorda Creek, downstream of mine, 1 km upstream from the town of Faro. |
| Pelly River | |
| P1 | Reference Station (not impacted by the mine): Pelly River upstream of Town of Faro |
| P4 | Pelly River downstream from confluence of Anvil Creek |

Description of Figure 1: Locations of sampling stations presented in this report
Locations of sampling stations presented in this report. The map outlines monitoring reference stations (which are not affected by contamination on the Faro Mine site) and receiving stations, which are potentially affected by contamination from the Faro Mine site. The reference stations shown are:
- Station P1, which is located in the Pelly River upstream/South of the Town of Faro.
- Station VR, which is located Northeast of the town of Faro in West Vangorda Creek upstream of Vangorda site.
- Station FC which is North of the Town of Faro, located in Faro Creek upstream of the Faro Mine Complex.
- Station V20A, which is located in main branch of Vangorda Creek, upstream of the Vangorda section of the site.
The receiving stations shown are:
- Station VGMAIN which is located in Vangorda Creek, close to the Town Of Faro.
- Station X14, which is North of the Town of Faro. It is located in Rose Creek, Rose Creek immediately downstream of the mine site discharges.
- Station R5, which is Northwest of the Town of Faro. It is located in Rose Creek downstream of the mine site and after the confluence of Anvil Creek (approximately 15 km from the mine site).
- Station P4, which is Northwest of the Town of Faro. It is located in the Pelly River downstream from the confluence of Anvil Creek.
At each of these locations, we provide a summary of the presence and changes over time in sulphate, zinc, iron and manganese. We selected these contaminants of potential concern as they are key indicators of deteriorating water quality on site and have been observed to exceed existing water quality guidelines in the past. The following four sections present the concentration of each of these at the sample stations listed in Table 1. They are located on:
- Faro Creek
- Rose Creek
- Vangorda Creek, and
- Pelly River
These watercourses were chosen because they have been, or potentially could be, affected by the site.
Sulphate
Sulphate in water results from natural weathering of minerals, atmospheric deposition, and human activity. Sulphates are discharged into the aquatic environment in waste from industrial sources such as mining and smelting operations. Metal mines, like Faro, can be significant sources of sulphate as a result of oxidation of sulphide minerals. High sulphate levels are often used as an early indicator of increased acid rock drainage. The effects of sulphate on aquatic organisms is closely related to water hardness (sulphate is less toxic in hard water). Toxic effects linked to sulfate are rarely observed in the natural environment. We monitor sulphate at the Faro Mine site more because it can indicate acid rock drainage rather than for its potential toxic effects on the aquatic environment.

Description of Figure 2: Sulphate concentrations in Faro Creek and Rose Creek
Figure 2 provides data from early 2014 to 2017 for three water monitoring stations, FC, X14 and R5. Station FC shows consistently low and stable levels of sulphate over the entire period presented in the chart. This is expected for a reference station that is not affected by the mine site. Station X14, the first monitoring station located immediately downstream of the Faro Mine in Rose Creek, shows a seasonal signal of increasing concentrations mainly during winter lower flows, and decreasing concentrations when flow increases again in late spring. The figure also illustrates that during the winter months the concentrations of sulphate approach or exceeds the British Columbia Ministry of Environment (BCMOE) guideline level of 309 mg/L. It is also clear that sulphate concentrations have increased in 2017 and this is likely due to elevated sulphate levels from X13 (a seep located upstream of X14 and near the toe of the Cross Valley Dam). Station R5 located downstream of the confluence with Anvil Creek, shows a stable trend with a moderate seasonal variability similar in timing to station X14 but at much lower concentrations. The concentrations of sulphate at station R5 are below the guideline.

Description of Figure 3: Sulphate concentrations in Vangorda Creek
Figure 3 provides data from early 2014 to 2017 for three stations, V1, V2 and VGMAIN. These stations are in the Vangorda watershed which is influenced by the Vangorda-Grum side of the property. Station V1 is a reference station not impacted by the mine site. We can see that concentrations of sulphate at this reference station are consistently low and show very little seasonal variability. The sulphate concentrations are well below the guidelines for sulphate which is to be expected for a reference station. Station V2 is located on Grum Creek downstream of the Grum waste dump. We can see that concentrations of sulphate at this site are quite elevated, well above the BCMOE guideline of 309 mg/L. Station VGMAIN is located downstream of the mine site on Vangorda Creek, near the town of Faro upstream of its confluence with the Pelly River. The concentrations of sulphate at station VGMAIN show a seasonal trend like station X14, but unlike X14, this station rarely exceeds the guideline for sulphate and appears to show a downward trend in sulphate concentrations.
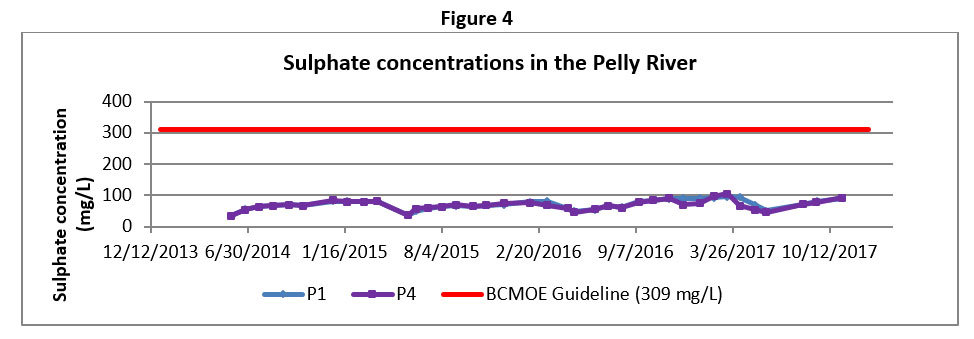
Description of Figure 4: Sulphate concentrations in the Pelly River
Figure 4 provides data from early 2014 to 2017 for two stations, P1 and P4. Station P1 is the reference station for the Pelly River and is located upstream of the town of Faro. This station is not affected by the Faro Mine site. Station P4 is the furthest station in the monitoring program located on the Pelly River downstream of the confluence of Anvil Creek. It is notable that both station P1 and P4 show nearly identical sulphate concentrations. They both show a seasonal signal similar to other stations with increasing concentration of sulphate in the winter months and decreasing in the summer. Both stations are well below the guideline for sulphate. Comparing results from these two stations provides an indication of the mine potential impact, or lack of impact, on the broader Pelly River watershed. The figure shows that the mine has had no impact on sulphate levels in the Pelly River.
Zinc
Zinc, in trace amounts, is an essential element for plants and animals. In mammals, it plays a vital role in the healing processes of tissues in the body. Like many essential elements, too much zinc can lead to toxic effects in humans (most commonly from acidic foods stored in galvanized containers). Several factors such as water hardness, salinity, temperature, and the presence of other contaminants influence zinc toxicity in aquatic environments. The concentration of zinc in natural waters is generally low, but on occasion, high levels have been measured in natural environments. High levels of zinc are often found in waters flowing through bedrock containing zinc deposits. Elevated concentrations of zinc in the surface waters around the Faro Mine site have been measured over recent years; this is an indication of metal leaching through tailings or waste rock piles. As one of the key contaminants of potential concern, monitoring of zinc and other metals will continue throughout the remediation, closure and care and maintenance of the Faro Mine site.

Description of Figure 5: Zinc concentrations in Faro Creek and Rose Creek
Figure 5 provides data from early 2014 to 2017 for three stations, FC, X14 and R5. Station FC shows consistently low and stable levels of zinc over the entire period presented in the chart. This is expected for a reference station that is not impacted by the mine site. Station X14, the first monitoring station located immediately downstream of the Faro Mine in Rose Creek, shows a seasonal signal of increasing concentrations of zinc in late fall, winter and early spring, and decreasing concentrations in late spring, summer and early fall. The figure also illustrate that zinc levels at station X14 rarely fall below the Canadian Council of Ministers of the Environment (CCME) guideline (for the protection of aquatic life) of 0.03 mg/L. It also clearly shows that zinc concentrations were the highest for the period 2014-2015. These elevated levels of zinc during this period (2014-2015) could be explained by the discovery of a highly concentrated seep located upstream in the North Fork of Rose Creek. Station R5 located 15 km downstream of station X14 on Anvil Creek, shows a stable trend with very few instances when the concentration of zinc exceeds the guideline value.

Description of Figure 6: Zinc concentrations in Vangorda Creek
Figure 6 provides data from early 2014 to 2017 for three stations, V1, V2 and VGMAIN. These stations are in the Vangorda watershed which is influenced by the Vangorda-Grum mines. Station V1 is a reference station not impacted by the mine site. We can see that concentrations of zinc at V1 are consistently low and show very little seasonal variability. The zinc concentrations are well below guidelines for zinc which is to be expected for reference stations. Station V2 is located on Grum Creek downstream of the Grum Waste dump. We can see that concentrations of zinc at this location show some seasonal variability and are elevated compared to the reference station. It is also apparent that concentrations of zinc at this location are often well below the CCME guideline (for the protection of aquatic life) level of 0.03 mg/L with one observation since 2014 exceeding this level. Station VGMAIN, is located downstream of the mine site on Vangorda Creek and upstream of its confluence with the Pelly River. The concentrations of zinc at station VGMAIN show a seasonal trend like station X14, but unlike X14, this station rarely exceeds the guideline for zinc. The elevated zinc concentrations at VGMAIN compared to V2 are likely caused by sources located in the vicinity of the Vangorda Dump. This uncertainty will be addressed this upcoming field season as two more monitoring stations will be added to get a more complete picture of the influence the Vangorda/Grum site is having on water quality in Vangorda Creek.
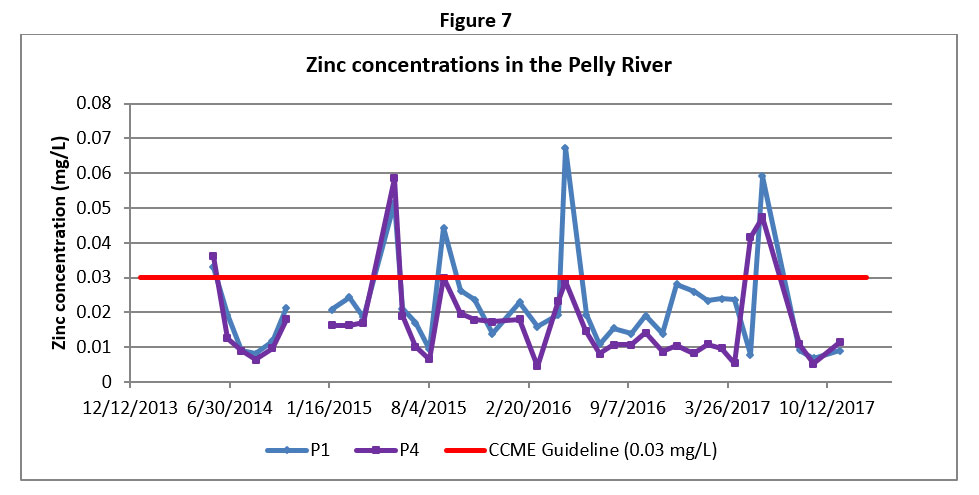
Description of Figure 7: Zinc concentrations in Pelly River
Figure 7 provides data from early 2014 to 2017 for two stations, P1 and P4. Station P1 is the reference station for the Pelly River and is located upstream of the town of Faro. This station is not affected by the Faro Mine site. Station P4 is the final receiving station in the monitoring program located on the Pelly River downstream of the confluence of Anvil Creek. It is notable that zinc concentrations at both station P1 and P4 follow very closely. They both show a seasonal signal similar to other stations with increasing concentration of zinc in the spring and decreasing in the summer. In addition, both stations are below the guideline for zinc except in the spring when concentrations exceed the guideline levels even at the reference station P1. This is significant given that station P1 is not influenced by the mine. This implies that even in areas not influenced by the Faro Mine site, zinc concentration in the Pelly watershed can exceed the guideline level. The water quality results at these two stations ultimately show that the Faro Mine currently has little to no impact on zinc levels in the Pelly River.
Iron
Iron is a key element for all forms of life. It is a necessary component of a healthy diet, and low levels of iron can lead to anemia and other health concerns. Like all things, too much iron can also be potentially toxic. Iron can affect fish by clogging gills and reducing the fish's ability to breathe, which can lead to its death. It can also alter the structure and quality of fish habitat. Iron can be found in various forms in the environment; it can range from very soluble (i.e. dissolves in water very easily) to almost insoluble (does not dissolve and appears as suspended particles with a red colouration). Iron is the fourth most abundant element by weight in the earth's crust and is often a major component of soils (often giving soil a reddish tinge). Mining activities are also another related source of iron in surface water. Iron is often released through the weathering of waste rock and tailings. Iron will continue to be monitored throughout the remediation, closure and care and maintenance of the Faro Mine site.
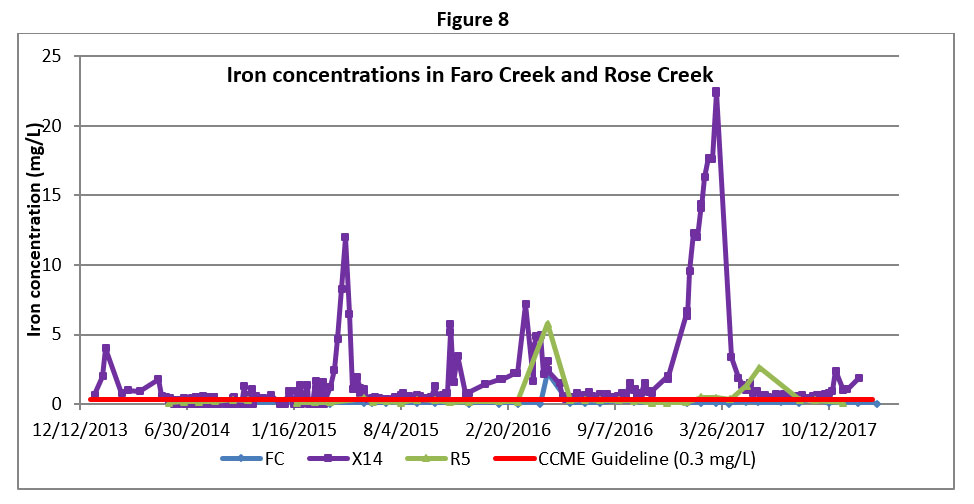
Description of Figure 8: Iron concentrations in Faro Creek and Rose Creek
Figure 8 provides total iron data from early 2014 to 2017 for three stations, FC, X14 and R5. Station FC shows consistently low and stable levels of iron over the entire period presented in the chart. This is expected for a reference station that is not impacted by the mine site. Station X14, the first monitoring station located immediately downstream of the Faro mine area in Rose Creek, shows a seasonal signal of maximum concentrations in spring, and decreasing concentrations in late spring, summer and early fall. The figure also shows that iron levels at station X14 rarely fall below the CCME guideline (for the protection of aquatic life) of 0.3 mg/L. It also appears that iron concentrations were the highest for the period of record during spring of 2017. In comparison, station R5 located 15 km downstream of station X14 on Anvil Creek, shows a stable trend with very few instances when the concentration of iron exceeds the guideline value.
The highest concentrations of iron are immediately downstream of the Rose Creek Tailing Area. The project team is presently designing a capture system to ensure that this water does not reach Rose Creek. This contaminated water will be directed to the Faro Pit for storage until it can be treated by the on-site water treatment plant. Once this contaminated water is captured, the concentration of iron at station X14 should reduce significantly.

Description of Figure 9: Iron concentrations in the Vangorda Creek
Figure 9 provides data from early 2014 to 2017 for three stations, V1, V2 and VGMAIN. These stations are in the Vangorda watershed in the Vangorda-Grum side of the property. Station V1 is a reference station unimpacted by the mine site. The figure illustrates that concentrations of iron at V1 are consistently low with peaks during spring freshet. The iron concentrations are well below the guideline which is to be expected for a reference station. Station V2 is located on Grum Creek downstream of the Grum Waste dump. We can see that, for the most part, iron concentrations are below the CCME guideline (for the protection of aquatic life) except for a few occasions which may be associated with periods of high flow (i.e. freshet). Station VGMAIN, is located downstream on Vangorda Creek upstream of the confluence of the Pelly River. The concentrations of iron at station VGMAIN has been consistently low and follows a similar trend as station VR, except more recently, where data show an increase in iron concentrations that have exceeded the guideline values on a few occasions. The elevated iron concentrations at VGMAIN compared to V2 are likely caused by sources located in the vicinity of the Vangorda Dump. This will be investigated further during the upcoming field season as two more monitoring stations will be added to get a more complete picture of the influence the Vangorda/Grum site is having on water quality in Vangorda Creek.

Description of Figure 10: Iron concentrations in the Pelly River
Figure 10 provides data from early 2014 to 2017 for two stations, P1 and P4. Station P1 is the reference station for the Pelly River and is located upstream of the town of Faro. This station is not affected by the Faro Mine site. Station P4 is the final receiving station in the monitoring program located on the Pelly River downstream of the confluence of Anvil Creek. It is notable that both station P1 and P4 follow very closely in iron concentrations. They both show a seasonal signal similar to other stations with increasing concentration of iron in the late spring and decreasing in the late summer/early fall. In addition, both stations are below the guideline for iron except in the spring when concentrations exceed the guideline levels even at the reference station P1. This is significant given that station P1 is not influenced by the mine. This implies that even in areas not affected by the Faro Mine, the background levels of iron can exceed the guideline levels in the Pelly Watershed. These two stations ultimately show that the mine site has had little to no impact on iron levels in the Pelly River.
Manganese
Manganese is a naturally occurring substance contained in rock and soils. Metal mining and refining can also lead to increasing levels of this metal in the environment. Manganese is an essential trace element for plants and animals, assisting in the digestion and absorption of food. Like most trace elements, too much manganese can be harmful to plants/animals and humans.

Description of Figure 11: Manganese concentrations in Faro Creek and Rose Creek
Figure 11 provides data from early 2014 to 2017 for three stations, FC, X14 and R5. Station FC shows consistently low and stable levels of manganese over the entire period presented in the chart. This is expected for a reference station that is not impacted by the mine site. Station X14, which is the first monitoring station located immediately downstream of the Faro Mine in Rose Creek, shows a seasonal signal of maximum concentrations in spring, and decreasing concentrations in late spring, summer and early fall. The figure also shows that manganese levels at station X14 are often at or slightly above the guideline level of 1.0 mg/L during the summer/fall, but clearly above the guideline during the winter low flow. It also shows that manganese concentrations were the highest for the period of record during spring of 2017. In contrast, station R5, located 15 km downstream of station X14 on Anvil Creek, shows a stable trend with very few instances when the concentration of manganese exceeds the guideline value.
The highest concentrations of manganese are immediately downstream of the Rose Creek Tailing Area. The project team is presently designing a capture system to ensure that this water does not reach Rose Creek. This contaminated water will be directed to the Faro Pit for storage until it can be treated by the on-site water treatment plant. Once this contaminated water is captured, the concentration of manganese at station X14 should reduce significantly.

Description of Figure 12: Manganese concentrations in the Vangorda Creek
Figure 12 provides data from early 2014 to 2017 for three stations, V1, V2 and VGMAIN. These stations are in the Vangorda watershed influenced by the Vangorda-Grum side of the property. Station V1 is a reference station not impacted by the mine site. The figure shows that concentrations of manganese at V1 are consistently very low and stable. The manganese concentrations are well below guidelines for manganese (1.0 mg/L) which is to be expected for a reference station. Station V2 is located on Grum Creek downstream of the Grum Waste dump. We can see that manganese concentrations are also very low at station V2 with a few peaks over the past 3 years. Station VGMAIN, is located downstream of the mine site on Vangorda Creek upstream of its confluence with the Pelly River. The concentrations of manganese at station VGMAIN are consistently low and follow a similar trend as station VR.
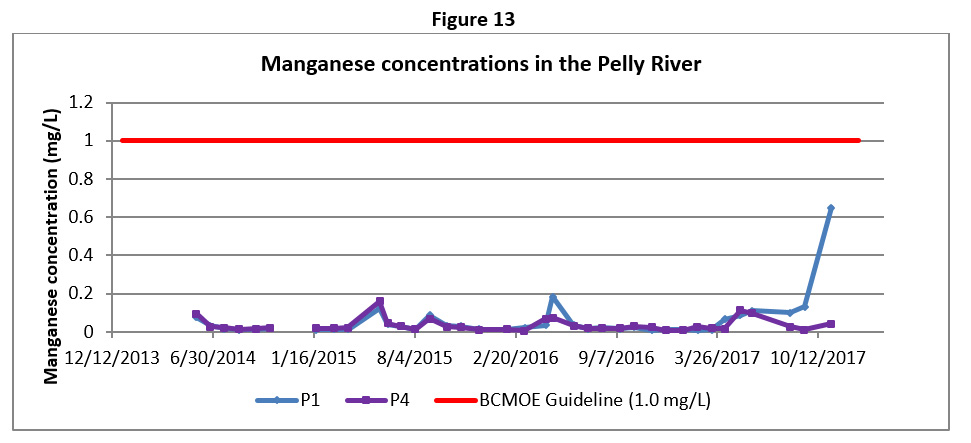
Description of Figure 13: Manganese concentrations in the Pelly River
Figure 13 provides the data from early 2014 to 2017 for two stations, P1 and P4. Station P1 is the reference station for the Pelly River and is located upstream of the town of Faro. This station is not affected by the Faro Mine site. Station P4 is the final receiving station in the monitoring program located on the Pelly River downstream of the confluence of Anvil Creek. It is notable that both station P1 and P4 follow very closely in manganese concentrations. They both show a seasonal signal similar to other stations with increasing concentration of manganese in the late spring (lowest flow) and decreasing in the late summer/early fall (higher flow). In addition, manganese concentrations at both stations are well below the guideline of 1.0 mg/L. These two stations ultimately show that the Faro Mine site has had little to no impact on manganese levels in the Pelly River.