Evaluation of Recruitment, Development and Retention Activities at Indigenous and Northern Affairs Canada
Final Report
January 2016
Project Number: 1570-7/14096
PDF Version (832 Kb, 99 Pages)
Table of contents
- List of Acronyms
- Executive Summary
- 1. Introduction
- 2. Evaluation Methodology
- 3. Context
- 4. Findings – Recruitment
- 5. Evaluation Findings – Development
- 6. Evaluation Findings - Retention
- 7. Conclusion and Points for Consideration
- Appendix A: Key Informant Interview Methodology
- Appendix B: Data Analysis of Public Service Employee Survey Methodology
- Appendix C: Average Number of Days to Staff Positions
- Appendix D: Indigenous and Northern Affairs Human Resources Risk Analysis
List of Acronyms
| DRAP |
Deficit Reduction Action Plan |
|---|---|
| EPMRB |
Evaluations, Performance Measurement and Review Branch |
| EPMRC |
Evaluations, Performance Measurement and Review Committee |
| HRWSB |
Human Resources Workplace Services Branch |
| HR |
Human Resources |
| INAC |
Aboriginal Affairs and Northern Development Canada |
| MAF |
Management Accountability Framework |
| PSES |
Public Service Employment Survey |
| PSPM |
Public Service Performance Management Agreements |
| SCARF |
Staffing and Classification Action Request Form |
Executive Summary
Overview and Scope
From 2010-11 to 2014-15, four of INAC's Annual Corporate Risk Profiles assessed Indigenous and Northern Affairs' (INAC) ability to recruit, develop and retain sufficiently qualified, experienced and representative human resources in a timely manner as high risk. As a result, INAC identified in its 2014-15 departmental approved Five Year Evaluation and Performance Measurement Plan an evaluation of recruitment, development and retention activities. The evaluation was carried out in 2015-16 and covered the period April 2010-11 to 2014-15. It was carried out as an internal services evaluation.
Fundamentally, recruitment refers to the activities involved in recruiting human resources, including planning for and attracting applicants, assessing, selecting and deploying candidates, and integrating new employees. Development refers to activities and transactions that facilitate employee development, including planning, and designing and delivering professional development. Retention refers to activities and transactions for retaining human resources, such as the provision of terms and conditions, benefits, employee assistance, and workplace health and safety. Each of these areas was examined as part of the evaluation.
Methodology and Lines of Evidence
The study was designed as a 'multi-method descriptive evaluation'. It was conducted by documenting processes, outputs and outcomes. Information was gathered using document review, interviews, discussion groups, regional site visits, administrative data, a comparative analysis of INAC's Public Service Employment Survey (PSES) results, and a review of corporate risk profiles.
Findings and Points for Consideration
The evaluation identified fifteen key findings and a dozen points for consideration meant to help improve the efficiency and effectiveness of recruitment, development and retention activities. Formal recommendations were not identified given that the evaluation reflects a review of internal services processes. As responsibilities for recruitment, development and retention are shared by management across INAC, the main themes and considerations outlined what might emerge as a departmental action plan to address key areas for improvement.
Findings – Recruitment
Workforce Decline – INAC's workforce population experienced a decline comparable to other departments, with increased vacancies particularly in northern regions. In terms of composition, the proportion of middle-aged employees at INAC has increased, while the proportion of younger employees has decreased. This is consistent with the average workforce of the public service.
Given the above, the evaluation suggests that the Department consider closely monitoring and assessing vacancy levels in the North in order to manage the risk that high vacancies in these regions negatively impact northern staff and programming.
Indigenous Recruitment – While the Department has not yet achieved 50 percent representation by Indigenous peoples, their level of representation is significantly higher than the general workforce market availability for this population, and INAC has made progress on its objective. However, in the absence of a positive change in Indigenous hiring trends, development and retention, under the assumption that INAC's workforce stabilizes, the Department may not experience an increase in Indigenous workforce representation as per departmental targets.
The evaluation observes that the aspirational 50 percent target is a long-term objective hence no timeframe for achievement of this objective was set; this makes meaningful measurement of the Department's progress challenging as it continues to advance in making every effort to ensure that Aboriginal people are equitably represented across all occupational groups and levels in the Department, including management positions. Expanding current Indigenous recruitment initiatives, such as an outreach program for Indigenous students and workers focused on opportunities to work at INAC and the federal government as a whole will contribute to the aspirational objective of 50 percent representation.
Human Resources Service Delivery and Hiring Processes – Human Resources (HR) service delivery at INAC underwent major restructuring during the time period examined by the evaluation, particularly with regards to activities and processes related to recruitment and related activities. The evaluation found that the roles and responsibilities of employees and hiring managers under the Common Human Resources Business Process implemented at INAC as of 2014 remain unclear, and hiring managers find staffing processes to be lengthy and cumbersome with excessive oversight. In addition, the creation of Service Centres has resulted in challenges to timely service delivery in regions, including confusion over roles and responsibilities for all parties involved in the staffing process, and unintended gaps in expertise.
Given the above, the evaluation suggests:
- Providing staff and INAC managers involved in hiring with additional training and support to enhance understanding of and compliance with the Common Human Resource Business Process;
- Improving service delivery by Service Centres to regional offices by creating new methods of triaging service requests from regional offices to Service Centres, or realigning the distribution of request by volume rather than by region; and
- Re-evaluating staffing oversight bodies as recommended in the 2013 Audit of Management Services.
Development
Employee Training Opportunities – The Department has increasingly relied on lower cost online training for their employees to access career-related training. While INAC's employees tend to have higher levels of satisfaction with training than comparable departments, there are opportunities for improvement.
The evaluation suggests strengthening development activities through improved monitoring of planned versus actual training as identified in employee Public Service Performance Management agreements (PSPM) and learning plans, and tracking development and training requests of staff and managers to help both INAC and the Canada School of Public Service tailor its course offerings employee needs.
Use of Performance Management Tools – While completion of performance management agreements and learning plans have consistently met target levels, regional use of PSPM agreements tends to be lower than rates observed in the National Capital Region.
Given the above, INAC may wish to consider completing a trend analyses based on the content of employee learning plans by province/territory to promote consistent and effective employee development planning across the Department.
Retention
Departure Rate – While the departure rate remained relatively stable between 2010-11 and 2014-15, it has consistently exceeded the entry rate. This gap coupled with an increase in the departure rate from approximately nine percent in 2013–14 to just under 13 percent in 2014–15 may indicate a need for improved activities aimed at retaining an experienced, qualified and representative workforce.
Employee Wellness – INAC has taken concrete steps to improve workplace wellness for its employees. In addition, INAC's Human Resources and Workplace Services Branch is working to address the discrepancy between incidents of harassment and conflicts reported to the Centre for Integrity, Values and Conflict Resolution and self-declared harassment in the anonymous Public Service Employment Survey.
Given the above, the Department may wish to consider:
- Promoting vacation use rather than 'banked' vacation through effective communication to help employees maintaining work-life balance, and monitor sick leave utilization and vacation utilization as proxies for wellness across the Department.
- Ensuring managers are proficiently informed and communicate regularly and effectively with staff about actions that may constitute harassment, the impacts of disrespectful behaviour in the workplace, and options for employees seeking conflict resolution.
1. Introduction
1.1 Overview
The Evaluation, Performance Measurement, and Review Branch (EPMRB) at Indigenous and Northern Affairs Canada (INAC) undertook an evaluation of recruitment, development and retention activities within the Department. The decision to conduct this evaluation was supported by evidence gathered as part of INAC's Corporate Risk Profile from fiscal year 2010-11 to 2014-15. For four of these five years, the Corporate Risk Profile assessed the Department's ability to recruit, develop and retain sufficiently qualified, experienced and representative human resources in a timely manner as a high risk.Footnote 1
INAC's corporate Human Resources Capacity Risk area within the Corporate Risk Profile speaks to the fundamental need to accomplish INAC's organizational goals through its people. INAC must succeed in attracting, recruiting and retaining sufficiently qualified, experienced and representative employees in a timely manner in order to support achievement of its strategic outcomes.
This evaluation aimed to examine the efficiency and effectiveness of the structures and processes within INAC that support recruitment, development and retention activities, as well as the Department's performance in each of these areas. Findings and the points for consideration contained in this evaluation provide an understanding of the factors that contribute to INAC's high Human Resources (HR) risk environment, support the development of risk mitigation strategies, and are designed to help improve the design and delivery of future activities associated with recruitment, development and retention.
1.2 Organization of the Report
The report is organized into seven sections. The remainder of this section briefly profiles the Department's vision for recruitment, development and retention activities and describes the roles and responsibilities of both sub-delegated managers and Human Resources and Workplace Services Branch (HRWSB). Section 2.0 – Methodology outlines how the evaluation was conducted, including limitations and mitigating strategies. In order to help set the stage for the evaluation, Section 3.0 – Context, provides an overview of the policy landscape in which recruitment, development and retention activities occur in the federal public sector and how these influenced INAC's recent approach to service delivery. Findings related to each of the major themes of the evaluation are presented in Section 4.0 – Findings: Recruitment, Section 5.0 – Findings: Development, and Section 6.0 – Findings: Retention. Conclusions are presented in Section 7.0, as well as points for consideration by INAC management.
Findings and points for consideration are interspersed throughout the text, to provide senior management with key points for consideration. The intention is that some of these points may lead to changes that enhance the performance of the Department's recruitment, development and retention activities, to further contribute to the achievement of departmental objectives.
1.3 Indigenous and Northern Affairs Canada Mandate
INAC is one of 34 federal departments responsible for meeting the Government of Canada's obligations and commitments to First Nations, Inuit and Métis, and for fulfilling the federal government's constitutional responsibilities in the North. INAC's mandate is to support Indigenous people (First Nations, Inuit and Métis) and Northerners in their efforts to:
- Improve social well-being and economic prosperity;
- Develop healthier, more sustainable communities; and
- Participate more fully in Canada's political, social and economic development — to the benefit of all Canadians.Footnote 2
1.4 Vision for Recruitment, Development and Retention at INAC
The Department's vision for recruitment, development and retention activities is outlined in its Corporate Human Resources Business Plan for 2014 – 2020. The Plan outlines a vision for people management of "Ensuring that the right person is in the right job, at the right time, to support leadership at all levels, efficiency, productivity, excellence and engagement." Within this plan, four priorities are identified:
- Enhance performance, productivity and talent management;
- Create a culture of continuous learning;
- Provide a healthy and respectful workplace; and
- Innovate and make use of modern human resources tools.
Within INAC, the primary responsibility for recruitment, development and retention activities rests with managers who have been given the sub-delegated authority for staffing and -related actions.Footnote 3 Additionally, the Department's Human Resources and Workplace Services Branch hereafter referred to as HRWSB or 'The Branch', plays a major role in supporting these activities.
The remainder of Section 1.0 briefly describes the roles and responsibilities of sub-delegated managers, HRWSB, its structure and resources, and its roles and responsibilities, as they pertain to recruitment, development and retention.
1.5 Roles and Responsibilities for Recruitment, Development and Retention at INAC
The primary accountability for recruiting, developing and retaining staff rests with all members of a department's management team to whom the Deputy Minister has granted the relevant authorities. INAC has a Sub-Delegation Instrument for Human Resources, which lays out the levels of responsibilities according to managerial level. The Instrument is developed and updated by the HRWSB, and approved by the Deputy Minister. The role of non- managers is important to consider when assessing overall strengths and weaknesses of INAC's performance in its recruitment, retention and development activities.
For its part, INAC's human resources function, the HRWSB, provides strategic information and advice to INAC managers with respect to all -related activities. The HRWSB is headed by a director general who reports directly to the Deputy Minister. The Branch has six directorates, five of which undertake activities directly linked to recruitment, development and retention. These include:
- Human Resources Planning, Executive Group Services and Performance Management;
- Human Resources Policies;
- Human Resources Services Delivery and Data Integrity;
- Learning and Well-being; and
- Integrity, Values, Ethics and Conflict Resolution.Footnote 4
The sixth directorate, Security, Occupational Health and Safety, and Accommodation, is not discussed in the report given that its activities do not have a strong linkage to recruitment, development and retention activities.
1.6 Human Resources and Workplace Services Branch Structure and Service Delivery
Between 2011-12 and 2013-14, human resources service delivery changed significantly throughout the public service when all departments implemented the Treasury Board's Common Human Resources Business Process. Implementation of the Common Human Resources Business Process was completed across Government in March 2014.Footnote 5 Treasury Board Secretariat's objective in implementing the Common Human Resources Business Process was to increase the efficiency of human resources management government-wide by delineating a more streamlined human resources management business process. The Common Human Resources Business Process detailed the roles and responsibilities for all employees involved in -related activities. Non- managers assumed increased responsibilities in the process, and personnel assumed an increased monitoring function within federal departmentsFootnote 6
The function in federal departments performs activities related to recruitment and staffing under the constraints of a multitude of laws, directives and regulations. With respect to staffing, Advisors are responsible for ensuring that managers' staffing actions conform to current regulations; and HRWSB and the Human Resources Operations Committee (described below) monitors and approve high risk actions. Additionally, HRWSB safeguards the Deputy Minister's delegated authority for human resources, which was conferred via the Public Service Employment Act, and is sub-delegated to INAC managers via the Departments' Sub-Delegation Instrument (2014) for human resources. This document is developed and updated by the HRWSB and signed by the Deputy Minister. Of note, the Common Human Resources Business Process, implemented between 2013 and 2014, increased the supervisory role of HRWSB over the staffing process at INAC.Footnote 7
The Department also reengineered its delivery model between 2012 and 2014, in response in part to the Deficit Reduction Action Plan (DRAP), and to align human resources service delivery with the Common Human Resources Business Process.Footnote 8 A general illustration of the transition can be found in figures 1 and 2.Footnote 9
The above factors resulted in several significant changes, including:
- The establishment of a Workforce Management Board (later renamed the Human Resources Operations Committee), created at INAC's National Headquarters in the National Capital Region to ensure that public servants affected by DRAP were prioritized for appointments within the Department, and to approve sectoral plans and higher risk staffing/classification actions.
- The development of a central National Administrative Unit at National Headquarters in order to relieve advisors time by processing administrative staffing and classification actions for them, leaving advisors to focus on processing non-administrative actionsFootnote 10.
- The relocation of functions and staff located within each of INAC's ten regional offices to three Service Centres located in Alberta, Quebec and Ontario. The Centres became operational in September 2013. Regional offices retained two positions (a Human Resources Manager and a Human Resources Specialist), often referred to as 'footprints'. The intent was to have these positions remain to support labour relations and planning functions in the regions.
Figure 1: Indigenous and Northern Affairs Human Resources Function (Pre Reengineered, circa 2012-13)
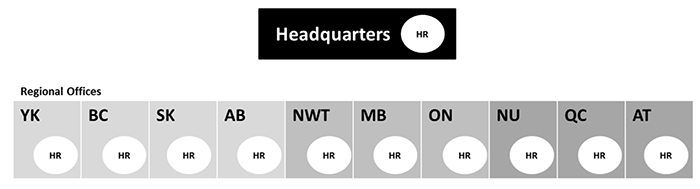
Text alternative for Figure 1: Indigenous and Northern Affairs Human Resources Function (Pre Reengineered, circa 2012-13)
This diagram describes the structure for provision of Human Resource services at the Department of Indigenous Northern Affairs Canada. At the top of the diagram, a box for "Headquarters" indicates there is an HR branch in the department’s central headquarters location. Below this 10 separate boxes below this indicate human resource branches in each regional office in Yukon, British Columbia, Saskatchewan, Alberta, Northwest Territories, Manitoba, Ontario, Nunavut, Quebec, and the Atlantic region.
Figure 2: Human Resources Function (Reengineered, 2013-14)
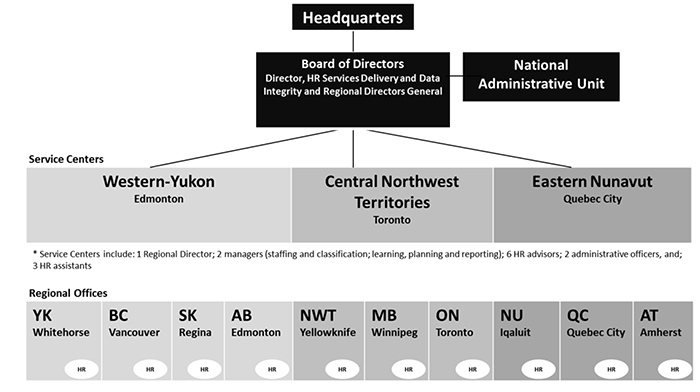
*Regional Offices contain Regional Footprints who handle labor relations and planning
Text alternative for Figure 2: Human Resources Function (Reengineered, 2013-14)
This diagram describes the structure of the Human Resources Function at INAC following the implementation of streamlining initiatives in 2013-14. The diagram is oriented top to bottom, showing the relationship between headquarters and the ten regional offices. At the top of the diagram, "headquarters" flows to the "Board of Directors" including the Director, HR Services Delivery and Data Integrity and Regional Directors General. To the right, the board of directors flows to the "National Administrative Unit."
The board of directors flows downward to the three Service Centres. Each Service centre employs one regional director, two managers (staffing and classification; learning, planning and reporting); six HR advisors, 2 administrative officers, and 3 HR assistants. Each Service Centre liaises with 3-4 regional offices, each of which contains a "Regional Footprint" responsible for labour relations and planning.
The "Western Yukon" service centre in Edmonton is responsible for the regional offices in Whitehorse, YK; Vancouver, BC; Regina, SK; and Edmonton, AB. The "Central Northwest Territories" service centre in Toronto is responsible for the regional offices in Yellowknife, NWT; Winnipeg, MB; and Toronto, ON. The "Eastern - Nunavut" service centre is responsible for regional offices in Iqaluit, NU; Quebec City, QC; and Amherst, NS for the Atlantic Provinces.
In addition, all federal departments had to adjust to the loss of their pay administration services through the consolidation of the pay function within the Public Service Pay Centre at Miramichi, New Brunswick.
The three newly created Service Centres were established in Alberta, Quebec and Ontario. Each Centre was given the responsibility of serving between two and three of INAC's 10 regional offices, including one northern regional office, as follows:
- Western-Yukon Service Centre, located in Edmonton, Alberta - Serves the Yukon, British Columbia, Saskatchewan and Alberta;
- Central-Northwest Territories Service Centre located in Toronto, Ontario - Serves regional offices in the Northwest Territories, Manitoba and Ontario; and
- Eastern-Nunavut Service Centre, located in Quebec City - Quebec and serves regional offices in Nunavut, Quebec and the Atlantic region.
The Service Centres were tasked with providing non-administrative -related services to the regions, such as advice, and also of participating in some parts of the processes involved in collective staffing actions, reclassifications, and the creation of new positions.
In terms of Governance, Service Centres are led by regional directors. They report to the Director of Services Delivery and Data Integrity, who reports to the Director General of HRWSB. The Service Centres are managed by a board of directors that includes the Director General of HRWSB and the regional directors general.Footnote 11
1.7 Recruitment, Development and Retention Stakeholders
Recruitment, development and retention activities are implemented or influenced by a number of stakeholders, both internal and external to the Department. Internal stakeholders include: executives; managers; individual employees; the Chief Financial Officer; Communications; and Legal Services.Footnote 12
Externally, HRWSB maintains partnerships with federal government stakeholders to support the fulfillment of its duties. The Treasury Board Secretariat, the Public Service Commission, and the Canada School of Public Service are all external stakeholders that contribute policies, programs and development activities that influence the implementation of recruitment, retention and development within the public service.
1.8 Governance of Recruitment, Development and Retention Activities
Over the time frame covered by the evaluation, INAC has had in place several committees that play various roles with respect to recruitment/staffing, development and retention activities. Key ones of relevance to the evaluation and referred to later under evaluation findings include:
- The Human Resources Workplace Services and Management Committee – Human Resources Workplace Services and Management Committeeassists senior management in fulfilling its obligations related to overall human resources management. This includes executive resourcing and workforce and workplace related matters.
- Human Resources Oversight Committee (formerly the Workforce Management Board) – Human Resources Operations Committee operates as a senior management forum to ensure that workforce management mechanisms and planning for non-EX positions and personnel are aligned with departmental priorities and remain consistent with the Human Resources Management Framework.Footnote 13
- National and regional workforce adjustment committees – Workforce Adjustment Committees exist at regional and national levels in order to share information and suggest recommendations for the effective application of the Workforce Adjustment Directive.
2. Evaluation Methodology
2.1 Objective and Scope
The objective of the evaluation was to determine the extent to which there are appropriate systems and processes in place to facilitate the recruitment, development and retention of staff in support of the achievement of HRWSB's vision, and the work completed by the Department. Recruitment, development and retention activities are fundamental components of the standard business process model for the human resources management function, as illustrated in Figure 3.
Figure 3: Human Resource Management function – Management Business Process (Sub-functions)Footnote 14

Text alternative for Figure 3: Human Resource Management function – Management Business Process (Sub-functions)
This diagram describes the management business process sub-functions in the Human Resource Management function. A circular arrow shows a cyclical relationship between five phases:
- Recruit: Attracting, assessing, selecting, staffing and integrating human resources.
- Develop: Developing the knowledge and capabilities of human resources.
- Retain: Providing the terms and conditions of employment, ensuring a safe and healthy workplace, and managing the separation of employees.
- Measure (performance): Evaluating the effectiveness of human resource functions.
- Plan: Determining how human resources will be used to achieve goals and objectives.
Based on the accountabilities outlined in the Common Human Resources Business Process, as well as other models used in the public service to describe the business activities associated with recruitment, development and retention, each of these can be defined to include the following set of activities:
- Recruitment – Refers to the activities or transactions that relate to or affect, in a specific manner, the recruitment of human resources, including the selection and deployment of new employees.Footnote 15 These activities are described sequentially in the Common Human Resources Business Process under the category 'Staffing and Employee Integration'. They include: the process of planning a recruitment approach; attracting applicants; assessing applicants and candidates; selecting candidates; and documenting and integrating new employees.Footnote 16 As a result, this evaluation covers the theme of staffing processes within the theme of recruitment.
- Development – Refers to activities and transactions that relate to or affect, in a specific manner, the development of human resources. This may include planning, designing and delivering professional development for employees within an organization.Footnote 17 Development may also include those activities described in the Common Human Resources Business Process under the category 'Employee Performance, Learning, Development, and Recognition', including: the process of addressing organizational learning requirements; developing performance agreements; managing employee performance; managing employee learning and development; and managing employee recognition.Footnote 18
- Retention – Refers to activities and transactions that relate to or affect, in a specific manner, retaining human resources such as the provision of the terms and conditions of employment, including: payment, benefits and employee assistance programs; creating a safe and healthy workplace; administering collective agreements among various groups; and releasing employees from employment at an institution or the public service in general.Footnote 19 These activities are described in the Common Human Resources Business Process under the category 'Workplace Management' and include the process of managing grievances, complaints and discipline, and managing scheduling and modified work arrangements.Footnote 20
In terms of the period of activity examined, the evaluation covers the five fiscal year period from April 2010 to March 2015. At a minimum, five years provides a sufficient timeline to examine changes to recruitment, development and retention within INAC, influenced notably by external and internal factors that have been established to drive a reduction in federal resource utilization.
The evaluation therefore focuses on:
- The external and internal factors that lead to a high-risk rating for Human Resources Capacity at INAC;
- The key structures and processes established and monitored by the Branch, which support recruitment, development and retention within the Department; and
- The performance of these structures and processes, and any positive or negative impacts that they have had on recruitment, development and retention.
2.1.1 Scope Exclusions
Given that responsibilities for recruitment, development and retention activities are shared between management, HRWSB and other key stakeholders, the evaluation does not assess the performance of professional, administrative and technical human resources in the organization.
Also, given the initial Terms of Reference for the evaluation, and the need to manage the scope and level of effort of the study, executive level recruitment, development and retention was not a focus of the work. While highly important to achieving organizational objectives, the executive cadre (representing just under four percent of INAC's workforce) participate in recruitment and development activities that are distinct from those used by the majority of employees at the Department.Footnote 21 Instead, the evaluation focused primarily on these activities as they relate to the four major occupational groups at INAC, namely the PM, AS, EC and CR groups.
2.1.2 Design
The evaluation was conducted as an internal services evaluation at INAC. While it appears on the departmental approved Five Year Evaluation and Performance Measurement Plan, as per Treasury Board Secretariat's Guide to Developing a Departmental Evaluation Plan, internal services are part of the total cost of delivering a program. This gives INAC the flexibility to conduct the evaluation according to issues that are most relevant to evaluation stakeholders. Evaluation issues outlined further in this section reflect primarily the interests of the Department, its management, and stakeholders. However, the evaluation does aim to take into consideration the principles of the Policy on Evaluation with a focus on the relevance and performance recruitment, development and retention activities.
The design used for this evaluation can best be described as a 'multi-method descriptive evaluation', wherein the information gathered is examined to determine the degree to which recruitment, development and retention activities are effective and supporting INAC in achieving its objectives. This was achieved by documenting processes, outputs and outcomes.Footnote 22
2.2 Evaluation Management and Quality Assurance
The Terms of Reference for the Evaluation was approved by Evaluation, Performance Measurement and Review Committee on November 28, 2014. Fieldwork and analysis was undertaken from November 2014 to November 2015. The final draft report was presented to INAC's Evaluation, Performance Measurement and Review Committee on January 25, 2016.
2.3 Lines of Evidence
The following lines of evidence were used to collect data and undertake evaluative work.
Document Review – Over 150 documents were reviewed in support of the evaluation. Internal and external documents were selected based on their relevance to the evaluation research questions pertaining to the themes of recruitment, development and retention at INAC and across the federal government. Documents were categorized as follows: reports (31 percent); planning documents (20 percent); websites (17 percent); guidance documents (seven percent); data tables (three percent); and minutes and presentations (two percent).
Departmental Risk Assessments – Risk assessments conducted between fiscal year 2010-11 and 2014-15 at the program, regional and corporate level were reviewed to provide insight into the human resources risks affecting departmental operations at each level. A sector-based risk assessment for the Northern Affairs Organization was included in the review to account for the challenges and risks specific to meeting the needs of remote northern clients and funding recipients. The complete analysis can be found in Annex A.
Data Review – Internal INAC performance data that detail recruitment, development and retention activities within the Department were reviewed. Data sources included quarterly reports on corporate indicators, HRWSB dashboard reports, and historical data extracted from internal data management systems. Also examined were open-source data for the public service as a whole, available through Treasury Board Secretariat, Statistics Canada and the Public Service Commission. This data was examined in order to compare INAC's performance to other medium-sized federal departments.
Key Informant Interviews and Group Interviews – Interviews and group interviews were conducted with both staff and non- managers. In the conduct of evaluative work, the evaluation distinguished between staff (i.e., employees whose substantive positions are to provide internal services) and non- managers (i.e., managers who engage in -related activities).
Non- managers included regional directors general, directors, managers, and Business Management Units heads. key informants included advisors and assistants located at National Headquarters and in regional offices, as well as the three Service Centres, and employees within HRWSB. Approximately one third (50) of the internal key informant interview and management group interview participants were HRWSB staff, and two thirds of all interviewees (97) were non- directors, managers, advisors and Business Management Unit heads.
Efforts were made to engage other government departments in the evaluation in order to gain an external perspective of recruitment, development and retention activities across the federal government and identify potential lessons learned and best practices. Due to lack of resources and availability of invited parties, only the Public Service Commission was able to participate as an external stakeholder. Four key informants from Public Service Commission participated in interviews.
For a detailed overview of qualitative data collection conducted in support of the evaluation, refer to Appendix A: Key Informant Interview Methodology.
The majority of interviews were completed in person, with some feedback being received via email. Several group interviews were conducted via teleconference and telephone. Feedback was coded using NVIVO, a qualitative software analysis tool used to identify qualitative research trends based on interviewee and group interview findings.
Public Service Employee Survey Analysis – EPMRB commissioned Statistics Canada's Social Analysis and Modeling Division to produce comparative analysis of INAC's Public Service Employment Survey (PSES) results from surveys conducted in 2008, 2011 and 2014.
Statistics Canada compared INAC's results to a sample of five departments of similar size, mandate and composition in order to obtain a sense of performance in the areas under evaluation among a comparator group. Existing PSES analysis compared aggregate departmental results by question and theme; to support this evaluation, a more detailed analysis comparing the differing results of employees within the Department based on identity characteristics, employee tenure, geographic location, and other variables was completed. This commissioned work allowed for more in-depth comparison of INAC performance than what was available in open-source data on the Treasury Board Secretariat website. Additional information on this analysis can be found in Appendix B: Data Analysis of Public Service Employee Survey Methodology.
Site Visits – Service Centres were visited between March and June 2015. Concurrent with each site visit, key informant interviews were held with the Regional Director of Services and group interviews were held with advisors and assistants. In total, 23 informants participated in the facilitated sessions. Relevant documents were also collected during site visits and were included in the document review.
2.4 Strength and Limitations
The following strengths and limitations relevant to the evaluation are worth noting.
2.4.1 Strengths
Contextualization and Clarification of Roles and Responsibilities – The evaluation examined both non- manager activities and HRWSB's activities and provision of services related to recruitment, development and retention. It also considered the context within which these activities were being undertaken over the period covered by the evaluation given changes at a whole-of government level, and within INAC. This contextualization provides an important counterweight to the qualitative results arising from key informant interviews and group discussions, which revealed an often strained relationship between non- managers and staff within the Department. Understanding the context within which recruitment, development and retention activities were carried out allowed evaluators to better interpret findings and provide appropriate considerations to support continued improvement of these activities by the Department.
Balanced Feedback – Evaluators ensured that both and non- staff were represented in interviews and group discussions. Feedback was also elicited from all INAC sectors, including Service Centres and regional offices. Human Resources managers and advisors could speak to human resource service standards, the policy and legislative framework under which services are delivered, and the challenges of supporting hiring managers in their staffing and planning processes. Non- managers, directors, and directors general were able to speak to processes that they are directly involved in on a daily basis. They were also able to speak to the challenges that they face with respect to recruiting the right people in a timely manner and developing and retaining their staff.
2.4.2 Limitations
Comparative Data – The confidential nature of activities makes obtaining comparative data on common recruitment, development and retention metrics, and associated functional costs and outcomes, challenging. Little comparative information on the performance as an Internal Service within and among federal government departments was available to support comparative analysis.
In order to mitigate this challenge, open source data was analyzed, including data available from Treasury Board Secretariat, the Public Service Commission and Statistics Canada. The comparative analysis of INAC's PSES results over the most recent three surveys, performed by Statistics Canada, was also used to assess INAC's performance related to recruitment, development and retention with other similar government departments.
Data Sources – The breadth of data and variability with which data can be analyzed (e.g., inclusion and exclusion of types of employees, etc.), means that determining which data to use for analysis can be challenging. Data available from internal and external sources was sometimes inconsistent and it was not always feasible to report on data from a single source over the full five years. To mitigate this, efforts were made to extract data primarily from internal service reporting tools, and to triangulate this information with secondary sources where possible.
Performance Measurement – While HRWSB does not have a performance measurement strategy similar to those used by programs to track progress, evaluators obtained performance measurement data from the Branch's quarterly corporate indicator reports, and examined documents, including the Plan, dashboards, INAC's Corporate Human Resources Plan (2014 – 2020) and departmental risk analyses.
Level of Availability of INAC Staff and Associated Information – The downward trend in the size of INAC's workforce, which has been affected by a number of cost-saving initiatives since 2012, and the demands to deliver programming and internal services with fewer resources, meant that the evaluation experienced difficulty securing time and information from evaluation participants. The timelines and workload with which the HRWSB at National Headquarters operates, delayed the evaluation team's receipt of evaluation-related material and data, and affected project timelines. The participation of HRWSB staff in group discussions and interviews, while extensive, required frequent rescheduling due to last minute unavailability by staff. This resulted in a more limited timeframe with which to assess data and information, and probe on or explore issues. To mitigate the constraints caused by limited availability, responses from interviews and group discussions were solicited in a variety of means, including e-mail, teleconference, and telephone.
Balance of Reporting – While evaluations can start out with a particular focus, the experiences and issues identified by stakeholders throughout the study process can result in a redefinition of issues or the exploration of other impacts. Given the changes occurring in the Department over the period examined by the evaluation, much of the qualitative feedback provided, regardless of area of enquiry, focused on issues such as hiring and staffing processes. While the focus of the evaluation was and remains recruitment, development and retention, there is a heavier emphasis on recruitment related themes (i.e., attracting, assessing, selecting, staffing and integrating human resources) given the results of fieldwork.
3. Context
The following section provides an overview of the legislative and policy landscape affecting human resources activities in the federal public service over the period covered by the evaluation, as well as the bodies that provide guidance and oversight to the administration of human resources activities in departments.
3.1 Human Resources Management in the Federal Government
3.1.1 Legislative and Policy Framework
Numerous acts, legislation, and various government-wide initiatives have influenced human resources activities across the federal public service over the recent past. Key legislation that sets the groundwork for recruitment, development and retention activities in the public service in Canada include the Financial Administration Act, the Public Service Employment Act, and the Public Service Labour Relations Act.Footnote 23
With respect to initiatives and frameworks, a few key ones are discussed here in order to provide context for the reader and reference when considering the findings of the evaluation.
Public Service Modernization – The Public Service Modernization, introduced in 2003, represented a significant reform of federal human resources management within the last four decades. Its objectives were to create a more flexible staffing framework to manage and support employees and to attract the best people, to foster more collaborative labour-management relations, and to clarify accountability for deputy heads and managers. The Public Service Modernization was crucial as it moved responsibilities and accountabilities for staffing from the Public Service Commission to deputy ministers. Most importantly, under this transition, deputy ministers were given the authority by the Public Service Commission to allocate a range of -related responsibilities by sub-delegating authorities to the lowest management level within departments. Departments were encouraged to pay as much attention to planning to meet their staffing needs as they did to their business cases and budgets. Ultimately, the Public Service Modernization was intended to streamline human resource management in the public service.
The Office of the Chief Human Resources Officer – The desire by Government to streamline management and internal services gave rise to the creation of the Office of the Chief Human Resources Officer in March of 2009. It centralized all human resource activities into a single new agency within the Treasury Board Secretariat.Footnote 24 The Office of the Chief Human Resources Officer's mandate is to represent the Government of Canada on all issues relating to human resources, pensions and benefits, labour relations, and compensation. It does so by developing broad policy direction and standards to enable deputy ministers to fulfill their responsibility for people management in their organizations. The Office of the Chief Human Resources Officer is also involved in monitoring and reporting on people management, providing guidance on performance management, and improving policies and processes.
Deficit Reduction Action Plan – DRAP was first introduced in the Federal Budget of 2011 as a strategy to contain resource activities into single ongoing savings by 2014-15.Footnote 25 In implementing cost containment and efficiency improvement strategies, DRAP ultimately influenced activities in terms of spending and hiring processes.Footnote 26 The overall impact of DRAP on INAC is discussed further in the report.
Canada School of Public Service – The Canada School of Public Service offers opportunities for managers across the federal government to develop skills needed to be effective leaders and for employees to develop skills needed to excel at their jobs. It aims to provide foundational development aimed at laying the groundwork for a common set of skills and values within the public service.
Public Service Commission – The Public Service Commission safeguards merit-based hiring, non-partisanship, representativeness (Indigenous people, visible minorities, women, and people with disabilities) and the use of both official languages in the public service. The Public Service Commission delegates to deputy ministers the appointment related authorities they require to execute their management responsibilities and human resources plan.
Blueprint 2020 – Blueprint 2020, released in June of 2013, defined a vision for Canada as having a world-class public service equipped to serve Canada and Canadians. In order to achieve this, four guiding principles were established including: an open and networked environment that engages citizens and partners for the public good; a whole of government approach that enhances service delivery and value for money; a modern workplace that makes smart use of new technologies to improve networking, access to data and customer service; and, a capable, confident and high-performing workforce that embraces new ways of working and mobilizing the diversity of talent to serve the country's evolving needs.Footnote 27
The next phase of Blueprint 2020, Destination 2020, was released by the Clerk of the Privy Council and Head of the Public Service in May of 2014. Within the report, the theme of People Management involves an improved approach to staffing, focused on results, simplified job descriptions, enhanced tools and capacity for learning official languages, and a government-wide commitment to learning.Footnote 28
The remainder of the report outlines the key findings from the evaluation as they relate to the themes of recruitment, development and retention. Where feasible, data and information has been included in areas of greatest relevance, recognizing that all three areas can be interconnected, as each represent a key component of the standard human resources business process model (refer to the model shown in Figure 3 earlier in the report).
4. Findings – Recruitment
As noted in Section 2.1, recruitment includes numerous activities such as: the process of planning a recruitment approach; attracting applicants; assessing applicants and candidates; selecting candidates, and documenting and integrating new employees. As a result, this evaluation covers a variety of themes within the theme of recruitment.
The following key evaluation questions with respect to recruitment and its related activities are addressed in this section:
- What is the state of INAC's workforce landscape?
- What are the Department's recruitment activities and are they effective?
- Will INAC's Indigenous recruitment strategy and activities enable the Department to fulfill its commitment to attain 50 percent representation by Indigenous peoples?
- Are processes to staff qualified recruitment candidates efficient?
- What impacts have external and change drivers (i.e., DRAP and the implementation Common Human Resources Business Process) and internal reengineering of the function (creation of the National Administrative Unit and Service Centres) had on staffing processes?
4.1 INAC Workforce Landscape
The Department ensures that it has sufficient human resources to achieve its business objectives through integrated planning. INAC's National Resourcing Strategy provides an overarching structure for integrated human resource planning, stating that "integrated, rigorous planning can mitigate the risks of business activities by forecasting and implementing strategies and activities for effective planning, recruitment, retention, career development and talent management (including diversity, employment equity and meeting official languages requirements)." By understanding the current and future human resource needs within the Department, managers and human resource professionals can determine which recruitment, development and retention activities are essential to ensure they meet their current and future staffing needs.
What follows is an overview of INAC's employee population, in order to contextualize the Department's human resources planning priorities, recruitment strategies, and staffing processes examined in the evaluation.
Finding: INAC's workforce population in National Headquarters and the regions have experienced a comparable decline. In terms of composition, the proportion of middle-aged employees at INAC has increased, while the proportion of younger employees has decreased. This is consistent with the general composition of the workforce of the public service.
During the period examined by this evaluation, there was a reduction in the number of full-time equivalents employed in the Department, mostly as a result of cost-containment changes implemented in response to the Deficit Reduction Action Plan announced in Budget 2011.Footnote 29 As a result, the Department's Human Resources Plan for 2014–2020, projected no growth in full-time equivalent levels, and forecasts some further reductions.
Changes in the Department's population during the period of this evaluation reflect this trend. In 2010–11, the number of indeterminate employees at INAC peaked at approximately 5,100. Between 2010–11 and 2014–15, the population of the Department shrank by approximately 16 percent to 4,100 employees. Figure 4 shows the change in regional employee levels as compared to the population in National Headquarters.
Figure 4: INAC Indeterminate Employee Population by Location, 2010-11 to 2014-15*
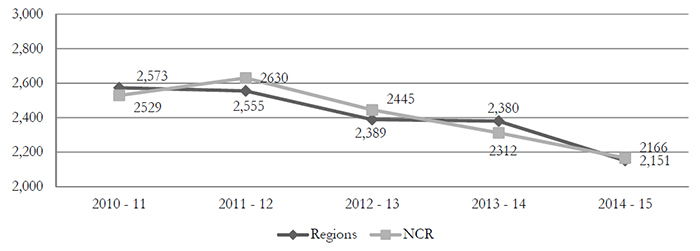
* Source: INAC internal program data. Provided by HRWSB, Services Delivery and Data Integrity Directorate.
Text alternative for Figure 4: INAC Indeterminate Employee Population by Location, 2010-11 to 2014-15*
This graph shows the change in INAC's Indeterminate Employee population in the National Capital Region and Regional offices from 2010-11 to 2014-15. The x-axis is labelled by fiscal year, and the y-axis shows the population count. From 2010-11 to 2014-15, both Regional and NCR indeterminate populations decreased.
For the Regional offices from 2010-11 to 2014-15 the population was 2,573; 2,555; 2,389; 2,380; 2,151. For the National Capital Region in the same years, the population was 2,573; 2,630; 2,445; 2,312; 2,166.
Qualitative evidence indicated a widespread belief that workforce reductions had a larger impact on regional offices than on National Headquarters; however, internal program data indicates that the difference between these two population changes was negligible. Regional populations were reduced by 16 percent whereas the National Headquarters population was reduced by 14 percent. The discrepancy between quantitative data and interviewee perception may be in part due to structural changes implemented in response to DRAP intended to streamline management in the Department.
| Age Cohort | 2010-11 | 2011-12 | 2012-13 | 2013-14 | 2014-15 |
|---|---|---|---|---|---|
| < 25 | 2.1% | 1.9% | 1.3% | 1.0% | 0.9% |
| 25 - 34 | 23.9% | 23.4% | 22.0% | 20.4% | 18.0% |
| 35 - 44 | 30.2% | 31.0% | 32.5% | 33.2% | 33.8% |
| 45 - 54 | 28.6% | 28.5% | 30.3% | 31.0% | 31.8% |
| > 55 | 15.0% | 15.0% | 13.9% | 14.4% | 15.5% |
| Average Age | 43.07 | 43.23 | 43.41 | 43.81 | 44.43 |
*Source: INAC, Service and Data Integrity Directorate |
|||||
In addition to a decrease in the number of its employees, the distribution of INAC's workforce has also changed. Table 1 shows that the average age of the workforce remained relatively constant from 2010–11 to 2014–15; however, the bulk of employees, who are concentrated in the middle age cohorts of 35 to 44 and 45 to 54 has grown from 59 percent in 2010–11, to 65 percent in 2014–15. Conversely, the number of employees between the ages of 25 and 34 has decreased by 5.9 percent: from 23.9 percent of the INAC population in 2010–11 to 18 percent in 2014–15.
This is consistent with trends in the public service's overall demographics, which has shifted towards employees being of older age groups, and fewer younger employees.Footnote 30 With respect to retirement activity, data in Figure 5 shows that the proportion of indeterminate employees that are eligible to retire both at present and into the future has remained relatively stable, with a marginal increase from 2010–11 to 2014–15.
Figure 5: Percentage of INAC's Indeterminate Population Eligible to Retire, 2010-11 to 2014-15
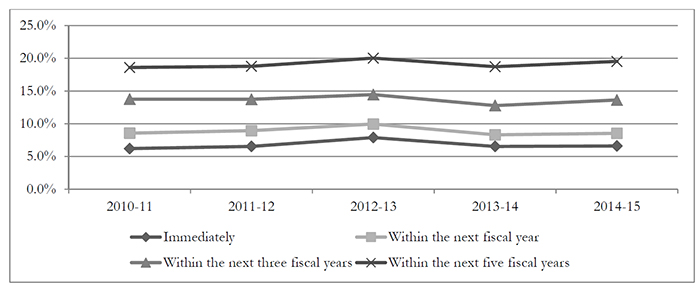
* Source: INAC, Service and Data Integrity Directorate
Text alternative for Figure 5: Percentage of INAC's Indeterminate Population Eligible to Retire, 2010-11 to 2014-15
This line graph shows change in INAC's indeterminate population eligible to retire in four cohorts: immediately; within the next fiscal year; within the next three fiscal years; and within the next five fiscal years. The x-axis is labelled by fiscal year form 2010-11 to 2014-15. The y-axis is labeled by percentage from 0% to 25%. Lines for all cohorts are nearly flat and horizontal across the graph: approximately 25% are eligible to retire in the next five years; approximately 14% are eligible to retire within the next three years; approximately 9% are eligible to retire in the next fiscal year; and approximately 6% are eligible to retire immediately. All cohorts experienced a slight increase of approximately 1 percentage point in fiscal year 2012-13.
4.1.1 Vacancies
Finding: Overall, vacancies are increasing across the country, particularly in the northern regions. Despite views by non- managers that time consuming staffing processes were resulting in the use of more determinate (term, casual, etc.) workers to fill vacancies, the ratio of indeterminate to determinate employees has remained constant in both National Headquarters and regions.
During the period covered by this evaluation, vacancy rates across the Department increased slightly. Figure 6 shows changes in vacancy rates over time. The average vacancy rate increased from 10 percent in 2011–12 to approximately 15 percent in 2014–15, leaving average vacancy rates below the levels observed in 2010–11. By contrast, vacancy rates in INAC's offices located in the northern territories have seen substantial increases from 15 percent in 2010–11 to 36 percent in 2014–15, as shown in Figure 6 below.
Figure 6: Northern and Regional Vacancy Rates Comparison, 2010 – 11 to 2014 – 15.
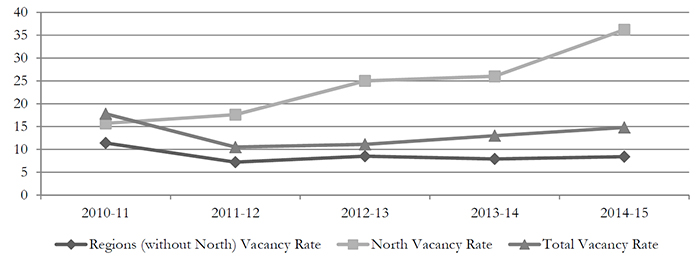
Text alternative for Figure 6: Northern and Regional Vacancy Rates Comparison, 2010 – 11 to 2014 – 15.
This line graph compares vacancy rates in the Northern Region; all Regions excluding the North; and departmental total vacancy rates on average. The x-axis is labeled by fiscal year form 2010-11 to 2014-15. The y-axis is labelled by percentage from 0 - 40%. The lines indicating Non-northern regional vacancy rates and departmental averages are relatively flat over the five year period. The line for Northern vacancy rates is highest on the graph and upward sloping, showing an increase from 15% vacancy in 2010-11 to 36% in 2014-15.
Figure 7: Vacancy Rates by Territory, 2010–11 to 2014–15.
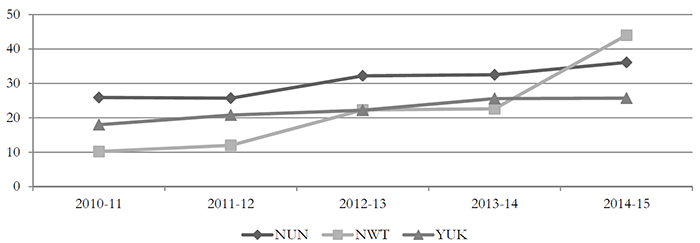
Text alternative for Figure 7: Vacancy Rates by Territory, 2010–11 to 2014–15
This line graph compares vacancy rates in the Northern Region by territory, including Nunavut, Northwest Territories and Yukon. The x-axis is labelled by fiscal year from 2010-11 to 2014-15. The y-axis is labelled by percentage from 0-50%. The lines indicating vacancy rates in each territory are upward sloping.
- Nunavut's vacancy rates increase from approximately 27% in 2010-11 to approximately 31% in 2012-13, and then to approximately 35% by 2014-15.
- Vacancy rates in the Yukon increase steadily from approximately 19% in 2010-11 to approximately 25% in 2013-14 and remain stable.
- Vacancy rates in the Northwest Territories are approximately 10% in 2010-11, then increase to approximately 20% in 2012-13. The vacancy rates increase again to approximately 43% in 2014-15.
While vacancies have increased in all three northern territories, the change was most significant in the Northwest Territories. Vacancies in this region spiked between 2013-14 and 2014-15, coinciding with devolution of additional responsibilities to the Government of the Northwest Territories. Devolution resulted in a loss of 30 percent of regional staff, as illustrated in Figure 7, and a number of these vacancies were at the senior management level. At the end of the time frame examined by the evaluation (2014–2015), the region was continuing efforts to develop and implement a post-devolution organizational structure and plan to fill vacancies.Footnote 31
Point for Consideration: The Department should closely monitor and assess vacancy levels in the North to manage the risk that high vacancies in these regions will negatively impact northern staff and programming.
Throughout these changes in population, the ratio of indeterminate to determinate staff (temporary or term staff, including students, seasonal, and casual employees), has remained constant and comparative in both the National Headquarters and the regions (See Figures 8 and 9 below). At National Headquarters, 88 percent of employees are indeterminate and 12 percent are determinate. In the regions, 85 percent of employees are indeterminate and approximately 15 percent are determinate.
Figure 8: Proportion of Indeterminate to Determinate Staff, National Headquarters (2010-11 to 2014-15)*
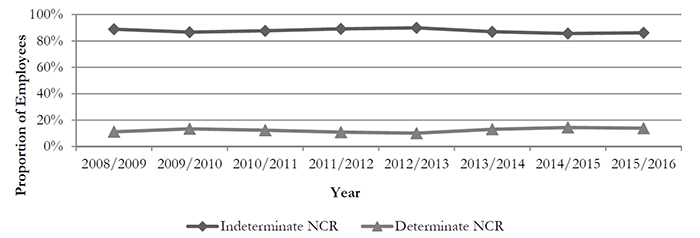
*Source: HRWSB Internal Program Data – Service and Data Integrity Directorate
Text alternative for Figure 8: Proportion of Indeterminate to Determinate Staff, National Headquarters (2010-11 to 2014-15)*
This line graph shows the proportion of INAC’s indeterminate staff compared to determinate staff at National Headquarters from 2010-11 to 2014-15. The x-axis is labelled by fiscal year from 2008-09 to 2015-16. The y-axis is labelled by percentage from 0 – 100%. The lines for both determinate and indeterminate staff proportions are flat over the 8 year period are flat. At National Headquarters, 88% of employees are indeterminate and 12% are determinate.
The consistent ratio of indeterminate to determinate (term or temporary) staff in both the National Headquarters and the regions suggests that where vacancies arise for indeterminate positions, they are being replaced with indeterminate employees or remaining vacant. This is contrary to the perceptions of non-HR manager interviewees and group discussion participants, some of whom suggested that indeterminate positions were either filled by determinate staff or remaining vacant, because the staffing process for indeterminate positions was too time-consuming, and hiring casual workers was easier.
Figure 9: Proportion of Indeterminate vs. Determinate Staff, Regions (2010-11 to 2014-15)
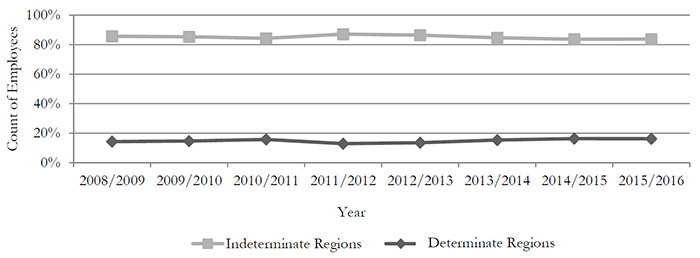
Text alternative for Figure 9: Proportion of Indeterminate vs. Determinate Staff, Regions (2010-11 to 2014-15)
This line graph shows the proportion of INAC’s indeterminate staff compared to determinate staff in the Regions from 2010-11 to 2014-15. The x-axis is labelled by fiscal year from 2008-09 to 2015-16. The y-axis is labelled by percentage from 0 – 100%. The lines for both determinate and indeterminate staff proportions are flat over the 8 year period are flat. In the Regions, 85% of employees are indeterminate and approximately 15% are determinate.
4.2 INAC’s Activities and Tools to Attract and Recruit Qualified and Experienced Employees
The Common Human Resources Business Process does not include a full definition for the term 'recruitment', but rather describes a series of processes in the category of "Staffing and Employee Integration." This step in the Common Human Resources Business Process value chain includes all activities related to renewal of departmental workforces: planning for recruitment, attracting applicants; screening applicants and assessing those who meet the selection criteria; selecting candidates for employment and extending offers; and, documenting and integrating new employees.Footnote 32 This section of the report reviews the phases of recruitment managers would undergo with support from professionals within the Department, moving from planning to attracting to hiring and staffing new employees.
INAC's National Resourcing Strategy emphasizes the importance of recruitment, both internal and external, to ensure workforce renewal as current employees leave their positions. The National Resourcing Strategy identifies the following key priorities for recruitment and staffing:
- the use of collective staffing pools and generic Statements of Merit Criteria to achieve efficiencies in staffing;
- increased bridging mechanisms to hire students where possible, and use of recent graduate recruitment programs offered by the Public Service Commission;
- support for Indigenous hiring, particularly outreach activities where there is strong representation of Indigenous students and other employment equity groups; and
- addressing the unique recruitment needs in northern regions.
Branches and regional offices across INAC achieve these goals by leveraging the recruiting activities described below.
Student Recruiting
INAC participates in student recruiting to help renew the workforce as employees leave their positions. The Department participates in Public Service Commission – recognized student employment programs, including the Federal Student Work Experience Program, co-operative education programs, and the Research Affiliate Program. Students who complete one of these Public Service Commission-recognized programs with the Department are eligible for "bridging" up to 24 months after the completion of their studies.Footnote 33 Student bridging allows managers to recruit individuals who already have valuable work experience and knowledge of the Department.Footnote 34
The Department also leverages recruitment programs designed to encourage departments to hire recent university graduates at all levels. Managers are encouraged to use the Public Service Commission Post-Secondary Recruitment inventory. The organization also participates in Recruitment of Policy Leaders Program and Financial Officer and the Internal Auditor Recruitment and Development Program run by Public Service Commission. These programs provide an inventory of pre-screened and qualified university graduates for different positions within INAC.
Northern Recruitment
As demonstrated by high vacancy rates in the northern territories, the Department often faces challenges recruiting for positions located in Canada's North. Lower rates of graduation in secondary and post-secondary programs, a younger and more mobile workforce, and elevated cost-of-living contribute to difficulties attracting qualified and representative candidates for northern-based positions.
INAC has taken several steps to support northern recruitment in the five years covered by this evaluation. In 2013, it established an internship program in partnership with the Nunavut Arctic College. The internship is a Public Service Commission-recognized student work program that provides the possibility of bridging for students, thus, building a pool of experienced and educated candidates in the North.Footnote 35 A similar pilot initiative targeted towards on-the-job training for Nunavut Land Claim Agreement beneficiaries called the Inuit Learning and Development Pilot Project was also launched in 2013; however, this initiative is not Public Service Commission recognized. Participants are therefore not eligible for student bridging.
4.3 Attracting and Recruiting Indigenous Employees at INAC
Finding: While the Department has not yet achieved 50 percent representation by Indigenous peoples, their level of representation is significantly higher than the workforce market representation, and INAC has made progress on its objective.
Indigenous recruitment levels within both INAC and the Government as a whole are driven by a number of factors. Under the Employment Equity Act, there are provisions to protect the rights of designated groups, including Indigenous peoples. To be eligible for participation in an appointment process targeted to designated groups, an individual is required to self-identify, i.e., declare as a member of a specific group.
INAC's Corporate Business Plan provides direction and focus with respect to human resourcing activities within the Department. One of its key strategic objectives is to "provide a cohesive and coordinated approach to AANDC's resourcing needs and planning to ensure a workforce that is competent, impartial and representative of the Canadian population with particular emphasis on critical needs and Indigenous peoples." By this, it is understood that the Department should seek to ensure that its workforce includes Indigenous representation.
In fact, going well beyond the stipulations of the Employment Equity Act, INAC committed to a 50 percent Indigenous Hiring Strategy in order to achieve a workforce that is representative of its Indigenous partners. The 50 percent commitment was an aspirational target; the result of a Letter of Understanding that INAC signed in 1994 with the Assembly of Manitoba Chiefs of First Nations. According to the document:
…the Department will make every reasonable effort to reach an objective of 50% hiring share for Aboriginal peoples until the Department meets this objective. The Department undertakes to make every effort to ensure that Aboriginal peoples are equitably represented across all of the occupational groups and levels in the Department, including management positions."Footnote 36
As shown in Table 2 – INAC workforce Employment Equity Representation, the Department has achieved workforce employment levels that exceed workforce market representation. It also shows that the Department experienced a slight increase in its Indigenous representation from 2010–11 to 2014–15. If compared to Indigenous representation when the Letter of Understanding was signed with Manitoba Chiefs in 1994, (i.e., 15 percent), the Department has achieved an increase of 14 percent from 1994, an approximate 1.5 percent increase per year. This suggests that if a similar trend were to continue and INAC experienced similar yearly increases in the future, it could achieve 50 percent representation in less than 15 years. This, therefore, could reflect a long-term objective for the Department.
| 2010-11 | 2011-12 | 2012-13 | 2013-14 | 2014-15 | |
|---|---|---|---|---|---|
| Number of Indigenous Employees | N/A | N/A | 1,352.00 | 1,303.00 | 1,242.00 |
| Percentage of Overall Employees | 28.4% | 28.7% | 30.0% | 29.1% | 29.3% |
| Workforce Market Availability of Indigenous Employees | 6.9% | 6.9% | 5.7% | 6.0% | 5.1% |
| Percentage of Indigenous Employment Levels Exceeding Market Availability | 21.5% | 21.8% | 24.3% | 23.1% | 24.2% |
* Source: INAC Human Resources Corporate Dashboards, 2010 to 2015Footnote 37 |
|||||
4.3.1 Indigenous Workforce Representation
While Indigenous representation in the INAC workforce has remained stable over the past five years given workforce adjustments, the absolute number of Indigenous people working in the Department has declined. As depicted in Table 3, there was a marked decline in Indigenous entries to the INAC workforce between 2011-2012 and 2013-2014, with a slight increase in 2014-15. Whereas Indigenous entries were at approximately 17 percent, they have declined to just over 13 percent.
| Workforce | 2010-11 | 2011-12 | 2012-13 | 2013-14 | 2014-15 |
|---|---|---|---|---|---|
| Entries | 17.17 | 17.22 | 15.76 | 12.65 | 13.45 |
| Departures | 22.81 | 23.71 | 26.32 | 24.89 | 22.53 |
*Source: HRWSB Quarterly Dashboard Reports. Q4, 2010-11 to 2014-15Footnote 38 |
|||||
Finding: In the absence of a positive change in Indigenous hiring trends, development and retention, under the assumption that INAC's workforce stabilizes, the Department may not experience an increase in Indigenous workforce representation as per departmental targets. In addition, there are a number of challenges to Indigenous recruitment, including a lack of awareness of opportunities, and the geographical remoteness of First Nations communities.
4.3.2 Challenges to Indigenous Recruitment
Interviewees and group interview participants identified that there was a lack of qualified Indigenous applicants for many positions. Many positions in the federal public service require undergraduate or graduate degrees. Based on Census data it is known that approximately 1.4 million Canadians self-identified as Indigenous, comprising approximately four percent of Canada's population. Forty-eight percent of Indigenous people aged 25 to 64 in Canada had a certificate, diploma or degree from a trade school, college or university. The comparable percentage for non-Indigenous counterparts was 65 percent.Footnote 39 Thus, fewer Indigenous are eligible for employment in the federal government.
Additionally, interviewees noted lower levels of Indigenous representation in student work placements. They described low numbers of Indigenous co-op students, resulting in fewer Indigenous employees available for bridging, and also low levels of Indigenous participation in the Federal Student Work Experience Program.
It was felt by evaluation participants that Indigenous youth, in particular, are not always aware of programs similar to the Federal Student Work Experience Program and other student employment programs that exist for the recruitment of Indigenous students. Interviewees based this assertion on firsthand experience obtained from conducting outreach at local universities. According to respondents, some Indigenous students did not view self-declaration as beneficial, or were not aware of the purposes and benefits of Employment Equity self-declaration.
Participants in focus groups and key informant interviews noted that gaps in information about Indigenous-specific recruitment programs exist within some First Nations communities. They felt that additional communications between the Department and Indigenous communities as a whole would be beneficial. These challenges, according to interviewees and focus group participants, are emphasized by difficulties contacting potential Indigenous employees as well as individuals being reluctance to move away from home communities for work.
4.3.3 Indigenous Recruitment Initiatives
INAC's role in the recruitment of Indigenous peoples, both to the Department and to Government as a whole, was an area touched on by the evaluation. Initiatives in which the Department participates include, as an example, the Indigenous Workforce Participation Initiative. The Indigenous Workforce Participation Initiative was launched in 1991 and responsibility for it is shared between INAC and the Treasury Board Secretariat. Its mandate is to increase the participation of Indigenous peoples in the labour market. It does this by supporting individuals and organizations that share the goal of breaking down barriers and overcomin the hurdles (real or imagined) that deter the employment of Indigenous peoples.
As part of its Human Resources Strategy, which includes an Indigenous Hiring Strategy that is developed in consultation with the Committee for the Advancement of Native Employment, INAC participates in career fairs, including those of colleges and universities. The participation in such activities is deemed by INAC as an efficient way to maintain a connection and visibility with potential Indigenous candidates for the future.Footnote 40 With its focus on recruitment, development, and retention, interviewees noted that the Committee for the Advancement of Native Employment prioritizes working toward the 50 percent Indigenous employee target. The Committee for the Advancement of Native Employment's prioritization also complements the Department's efforts to establish a workforce that reflects the diversity of Canada and is linked to the Deputy Minister's Aboriginal Workforce Initiative, which was implemented in 2007.
Through the Workforce Initiative was developed the Aboriginal Leadership Development Initiative, in 2009. Its goal is to build leadership capacity among Indigenous employees in executive feeder groups. The Aboriginal Leadership Development Initiative is further addressed under Section "5.0 Evaluation Findings – Development."
The Department maintains a Statement of Roles and Responsibilities for Hiring Aboriginal Peoples, accessible to all employees at the Department through its intranet. This document outlines key responsibilities of the Deputy Minister, the HRWSB, sub-delegated managers, and advisors towards achieving increased levels of Indigenous representation across INAC. Most importantly, this document supports some agreements, including the Letter of Understanding INAC signed with the Assembly of Manitoba Chiefs, and various land claim agreements.
Flexible work arrangements also exist to encourage recruitment of Indigenous employees where Indigenous peoples living on-reserve are allowed to work from a remote office. The Department also provides flexible work arrangements such as leave without pay and assignment opportunities to Indigenous employees who would prefer to take a leave from INAC and work in their communities.
Many sectors reported that other approaches taken include a focus on hiring Indigenous students in order to promote Indigenous employee hiring. Respondents note that this, however, is sometimes difficult due to the limitations in isolating self-identified individuals in the Federal Student Work Experience Program inventory. To enhance Indigenous recruitment, some INAC branches indicated that they are working closely with university cooperative education programs and university Indigenous student groups in order to improve the pool of Indigenous applicants. As noted by respondents, universities are also aware of this gap and have begun dedicating cooperative education positions or Indigenous peoples to help this partnership.
Currently, INAC National Headquarters has a Liaison with the Indigenous Centre of Excellence at the Public Service Commission. The Indigenous Centre of Excellence offers specialized staffing and assessment services aimed at recruiting Indigenous persons. INAC communicates with the Indigenous Centre of Excellence and discussions center on outreach and awareness (i.e., applying to the public service and to INAC employment offers). For example, the two entities attend job fairs at universities and conferences to recruit Indigenous students.
Regardless of the efforts made, some evaluation participants felt that Indigenous recruitment efforts have seen a decline since the implementation of DRAP. It was felt that the Department has not been in a recruitment mode, although also a sense that it might return to one in the near future. There was general interest in seeing the Department reengage and expand its activities in this area.
4.3.4 Indigenous Student Recruitment
The Department also leverages student recruitment to support Indigenous representation within INAC. In addition to the initiatives described above, the Department provides an "Indigenous student incentive" wherein managers who hire Indigenous summer students are eligible for a 50 percent reimbursement of the student's wages.
Regional approaches to Indigenous recruitment have also yielded some early success. A Quebec region student recruitment drive, aligned with the Iembaucheautochtone initiative, a project initiated under Blueprint 2020 and done mainly through the Federal Student Work Experience Program, allowed the region to achieve 50 percent Indigenous student hiring during the summer of 2014.Footnote 41 The region intends to build on the project to increase the representation of Indigenous youth within its workforce. A presentation made to the Human Resources Workplace Services and Management Committee in March 2015 stated that the Quebec region is depending on an Indigenous Student Ambassador Program and a video that promotes the diversity of jobs in the public service in help increase the number of Indigenous student hires.
4.3.5 INAC National Resourcing Strategy
INAC uses external and internal employment opportunity advertisements to target potential Indigenous employees. According to the Employment Equity Act, a department can include membership in a designated group in a job posting's Statement of Merit Criteria if required to support their organizational needs. INAC's National Resourcing Strategy affirms that managers are required to note that employment eligibility may be restricted to employment equity designated groups on external and internal postings.Footnote 42 Indigenous Status should be considered an asset when screening and selecting candidates. Through these practices, it is expected that INAC's hiring managers can contribute to increasing Indigenous representation within INAC and the wider federal public service. The presence of the Strategy is evidence of measures being taken by the Department to establish a workforce that reflects Canada's cultural diversity and that is representative of its Indigenous partners.
Point for Consideration: The Department should consider expanding its current Indigenous recruitment initiatives, such as an expanded outreach and communications programs for Indigenous students and workers focused on opportunities to work at INAC, and the federal government as a whole. Such efforts could increase the number of Indigenous entries and help the Department to achieve 50 percent Indigenous representation.
4.4 Timeliness and Efficiency of Processes to Staff Experienced and Qualified Candidates
Finding: Non- managers perceive the time to staff to be extremely lengthy, and this may be due in part to their involvement in all stages of the staffing process. However, according to HRWSB data, the length of time to staff has decreased for the majority of staffing actions, with the exception of the average number of days to staff Initial processes for External Advertised Collective processes.
According to the Risk Trend Analysis conducted by the Audit and Evaluation Sector in 2015, the length and complexity of the hiring process at INAC has been a consistent risk driver that is believed to have challenged the Department's ability to recruit qualified, experienced and representative employees.Footnote 43 In the regions, the length of the hiring process was also felt to have decreased regional offices' ability to meet workload demands in order to fulfill their mandates.Footnote 44
The importance of reducing the average time to staff was also a recurring theme among the majority of key informant and group interview participants. A majority of all senior management and middle management interviewed (both non- and employees) expressed frustration at the time that it took from the initiation of a staffing process, to the time a new hire began to work in the Department. Non- managers consistently believed that the time to staff positions at INAC was much longer on average than in other departments. Several non- senior managers linked lengthy staffing processes to the Department's reputation, ability to attract quality candidates, and its ability to remain competitive on the job market alongside other federal departments, provincial governments, and the private sector.
According to the Public Service Commission, which collects data from hiring managers in its annual Survey of Staffing, the time to staff is affected by several factors, including the turnover of personnel, security and language testing requirements, and the size of the organization. The Public Service Commission found that the length of time to staff all types of positions increased, with the number of personnel involved in the staffing process, e.g., with one advisor, the average time to staff was 4.9 months; this increased when two advisors were involved to 5.8 months; and when more than three advisors were involved, the average time to staff increased to seven months.Footnote 45
The opinions of non- senior management and middle managers with respect to perceived inefficiencies in the hiring process at INAC were more pronounced than those of respondents. However, several employees, including advisors, middle management and senior management also expressed frustration with the staffing system. personnel tended to speak more about inefficiencies related to structures introduced after 2012, like the National Administrative Unit, or about constraints due to too few human resources, and gaps in managers' knowledge of processes. The factors that have contributed to inefficiencies in staffing are discussed further in Section 4.3: Staffing Efficiency.
According to the Public Service Commission, it is common that managers perceive the staffing process to be lengthier than do employees, or applicants.Footnote 46 The Public Service Commission's Survey of Staffing compiles its average time to staff information from hiring managers' survey responses. Managers provide the month and year in which a process is initiated, and the month and year in which the new employee has begun work in the Department. However, INAC's estimated time to staff, as measured by HRWSB, may not account for the time required to process a staffing action and the time to recruit, select, and hire a candidate. HRWSB has provided staffing process maps, a Common Human Resources Business Process roles and activities matrix, and a Service Standards document, all of which provide information related to times taken to staff positions; however, these tools do not provide the overall picture of time required to staff a position as experienced by managers and documented in the Public Service Commission's Annual Report. Differing views of time to staff are primarily explained by the fact that non- managers are involved in the entire length of the staffing process; from the initiation of a process to the time in which a new hire begins work. To illustrate these points, see Figure 10 taken from the Public Service Commission's Public Service Commission of Canada, 2010-2011 Annual Report.Footnote 47
Figure 10: Differing Perspectives on Time to StaffFootnote 48
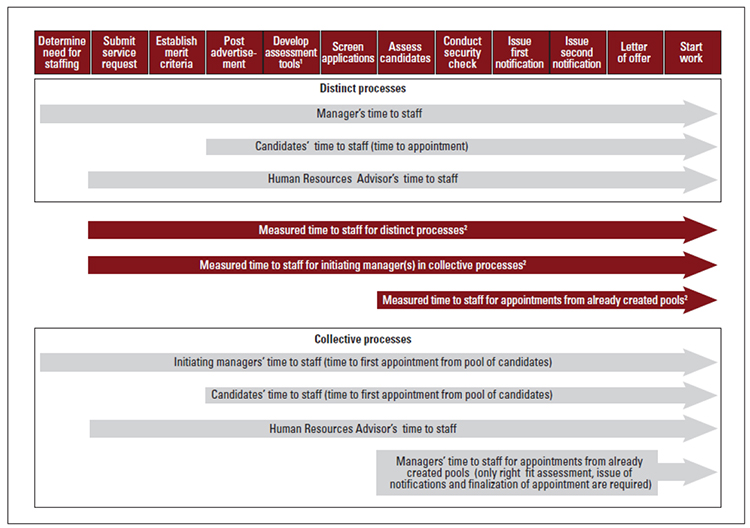
1 Where assessment tools are not developed in advance of posting.
2 Time to staff is measured using the Public Service Commission's Survey of Staffing - Managers.
Text alternative for Figure 10: Differing Perspectives on Time to Staff
Staffing tasks are listed at the top of the diagram in order: determining need for staffing, submit service request, establish merit criteria, develop assessment tools, screen applications, assess candidates, conduct security check, issue first notification, issue second notification, letter of offer, start work.
The diagram shows which staffing tasks are captured in Managers, HR advisors, and Candidates perceived and measured time-to-staff. It is divided into three sections: distinct processes, collective processes, and measurements. Horizontal arrows running parallel to the staffing tasks indicate which are included in each measurement and perceived time to staff.
Perceptions for Managers time to staff in distinct processes and Initiating manager's time to staff in collective processes capture all staffing tasks. Comparatively, Candidates' perceived time to staff in distinct processes and collective processes capture staffing tasks from "post advertisement" to "start work". Human Resources Advisors perceived time to staff in collective and distinct processes include the staffing tasks from "submit service request" to "start work". Finally, Manager's perceived "time to staff appointments from already created pools" in collective processes only captures the staffing tasks from "assess candidates" to "start work"
The measured time to staff for distinct processes and for initiating managers in collective processes capture the staffing tasks from "submit service request" to "start work". The measured time to staff for appointments form already created pools includes staffing tasks from "Assess candidates" to "start work".
Point for Consideration: The Department should consider conducting a business process study with a sample of non- and staff to help determine the deficiencies of the staffing processes and oversight structures and what improvements can be made.
Data acquired from HRWSB regarding average days/time to staff positions and compliance rates to national service standards were analyzed as part of the evaluation. The time to staff determinate (temporary) positions, e.g., casual and students, has decreased overall. However, several types of actions appear to be increasing from 2014-15, such as internal advertised collective (initial), and internal advertised (initial) processes. For example, initial externally advertised indeterminate positions have increased in time from 48 days in 2010-11 to 93 days in 2014-15.Footnote 49
While average days to staff positions appear to have decreased, an internal audit completed in November 2013 reported that service standards did not reflect total time to staff, from the time a request was received, to the time it was processed.Footnote 50 Parts of the staffing process that were not conducted by HRWSB staff, such as "the time it takes hiring managers to finalize the necessary paperwork or the time it takes for a security clearance request to be processed by Public Works and Government Services Canada" were omitted from average days to staff reports. The auditors also noted that the national service standards required updating following the creation of the Service Centres, and that there was a need for HRWSB to be more proactive in communicating its service standards to its stakeholders.
HRWSB acknowledged these gaps in service times in the National Service Standards document.Footnote 51 When listing service standards, the document states that some factors outside of the realm of HRWSB's control affect the service standards regarding time to staff. For example, a footnote states that delivery standards represent working days required "under normal circumstances". "Changes in the National Administrative Unit operations or incomplete applications or the need for additional information", may increase the time required to process staffing requests.Footnote 52 The document also indicates that these service standards do not include the time to process security clearances. In addition, HRWSB aims for an 80 percent compliance rate to its national service standards. This compliance target was chosen because some parts of -related processed are not controlled by HRWSB.Footnote 53 In the most recent data available in support of this evaluation, the Branch achieved 73 percent for administrative actions and 49 percent for non-administrative.Footnote 54 Unfortunately, as noted by the study, 70 percent of classification actions could not be measured due to errors in actions being processed (i.e. omitted data).
Regarding the metrics used by HRWSB to calculate the average time to staff positions, insufficient evidence was available within the scope of the evaluation to determine whether HRWSB's reporting was now incorporating the staffing process from start to finish, as recommended by the Audit of Management Services (2013). An update of the Audit, provided in March 2014 to the Evaluation, Performance Measurement and Review Committee, does not include a definition of "start to finish".
Point for Consideration: HRWSB may wish to reconcile the approaches being used to report time to staff at INAC. A holistic measurement of time to staff, as per the Public Service Commission’s definition, would provide hiring managers with information most relevant to their needs, and help INAC to better measure and report on improvements in the efficiency of the staffing process.
4.4.1 Staffing Oversight
The function in federal departments performs activities related to recruitment and staffing under the constraints of a multitude of laws, directives and regulations. With respect to staffing, advisors are responsible for ensuring that managers' staffing actions conform to current regulations; and HRWSB and the Human Resources Operations Committee monitors and approves high risk actions. Additionally, HRWSB safeguards the Deputy Minister's delegated authority for human resources, which was conferred by the Public Service Employment Act, and is sub-delegated to INAC managers in the Departments' Sub-Delegation Instrument (2014) for human resources, which is developed and updated by the HRWSB and signed by the Deputy Minister. However, the Common Human Resources Business Process, implemented between 2013 and 2014, increased the supervisory role of HRWSB over the staffing process at INAC.Footnote 55
Information gathered through the evaluation led to consideration of the role of staffing oversight mechanisms in the Department, including the Human Resources Operations Committee and the Workforce Management Board.
Finding: Human Resources Operations Committee's mandate is to approve high-risk staffing-related actions; however, non- senior management feels that the Committee continues to approve lower-risk staffing-related actions, lengthening the time to complete these actions. The processing of administrative staffing actions is felt to be more complicated now that they have been centralized in the National Administrative Unit.
The Workforce Management Board was established in 2012 as a temporary measure, to ensure that public servants who had been affected by workforce adjustment during DRAP were prioritized for new appointments. However, it became a permanent governance structure. The Classification and Staffing Associate Risks document, which provides a categorization of classification and staffing actions according to risk levels, indicates that many actions were subject to the Workforce Management Board's approval, including term extensions, and internal-external advertised processes. Some actions required Workforce Management Board's approval even if they were part of an plan that had already been approved by the Workforce Management Board.Footnote 56
In 2014, an internal audit suggested that its mandate be reevaluated, to ensure that managers understood its continued need and purpose.Footnote 57 In 2015, the Workforce Management Board was renamed the Human Resources Operations Committee and its mandate was refocused to improve staffing efficiencies.Footnote 58 According to Human Resources Operations Committee's Terms of Reference and interviews with staff, the Committee is to focus primarily on higher risk staffing and classification actions, such as staffing actions that require reporting/sharing with the Public Service Commission through the Departmental Staffing Accountability Report. It should also monitor areas of key concern, such as irregularities in merit-based hiring or employment equity that may lead to investigation by the Public Service Commission under the Public Service Employment Act.Footnote 59
In spite of the transition from the Workforce Management Board to the Human Resources Operations Committee, many respondents interviewed as part of the evaluation indicated that the Human Resources Operations Committee was still involved in the approval of what, according to them, should be low-risk actions. They questioned what they believed to be an excessive oversight function that delays staffing processes. A comparison of Workforce Management Board and Human Resources Operations Committee's respective Terms of Reference documents confirmed that more than half of the number of staffing actions that needed to be approved by the Workforce Management Board no longer need to be approved by the new Human Resources Operations Committee.Footnote 60 While the Workforce Management Board approved actions at a low risk level, the Human Resources Operations Committee monitors rather than approves many of these actions. A further change in the Terms of Reference was that where the Workforce Management Board was chaired by the Director General, HRWSB, the Human Resources Operations Committee is co-chaired by the Director General, HRWSB and INAC's Chief Financial Officer.
Despite the revised mandate held by the Human Resources Operations Committee, there remain many instances where HRWSB may use its authority over sub-delegated managers to bring forward staffing actions for more thorough consideration by the Committee. For example, advisors are still required to report any instances where managers have not followed their advice with staffing actions; and the Director General, HRWSB has a responsibility to advise the Deputy Minister if the Director General believes any sub-delegated manager is not complying with the many rules and regulations required in staffing in the public service.
Between 2008 and 2010, the Public Service Commission audited INAC's hiring practices in response to allegations within the Department that hiring activities were not being conducted within the rules established by the PSEA that govern merit-based, impartial hiring in the public service.Footnote 61 While several non- interviewees and group discussion participants indicated an awareness of this audit and its influence upon at INAC, they maintained that the risk-aversion at INAC was negatively affecting their capacity to complete their work; and they suggested that the need for the Human Resources Operations Committee should be reviewed. However, several interviewees indicated that Human Resources Operations Committee performed a necessary challenge function, and that its mandate had been changed to make lower-risk staffing and classification processes progress more quickly. The November 2013 Management Practices Audit of the Human Resources and Workplace Services Branch had recommended a review of the Branch's governance committees for redundancy.Footnote 62
Examples of monitoring activities, which are mandated and unchangeable and that may lead managers to believe that INAC is operating in risk-adverse atmosphere, include INAC's annual reporting requirements to the Public Service Commission. In 2003, when deputy ministers received delegated authority for -related activities within their departments, the Public Service Commission retained the authority to monitor and ensure compliance with the principles of merit and employment equity representation. To support the delegation process, the Public Service Commission developed a Staffing Management Accountability Framework, which identifies the necessary elements that organizations must have in place in order to benefit from the ability to sub-delegate staffing and human resources authorities.Footnote 63 The Commission also maintains a list in the Appointment Delegation and Accountability Instrument and the Staffing Management Accountability Framework of what it considers riskier appointments. Finally, to assist departments in their ongoing monitoring of organizational staffing, the Public Service Commission designed an annual reporting instrument, the Departmental Staffing Accountability Report.Footnote 64
HRWSB's responsibility to monitor the Deputy Minister's delegated authority also includes managing a database of all sub-delegated managers at INAC, including those who exercise acting authorities.Footnote 65
At INAC, the "sub-delegation of human resources authorities is granted on the understanding that the manager will consult with their respective human resources advisor for information, advice and guidance."Footnote 66 When hiring managers undertake a more risky staffing and classification action, they are required to submit a Staffing or Classification Action Request Form to their Advisor, who would then submit the request to the Workforce Management Board, now the Human Resources Operations Committee. Although some senior managers believed that they should be able to reject the advice from advisors, advisors are required to comment in writing on managers' staffing decisions, if they feel that these decisions are too risky and/or may not comply with relevant legislation or regulation.
Many non- directors and managers had the impression that their sub-delegated authority to make staffing decisions was being unduly challenged by advisors. They believed that should perform an advisory role, but that the true authority for staffing should lie in the hands of sub-delegated managers. Several directors referred to advisors and HRWSB as performing a 'policing' function, and identified excessive committee oversight as a source of unreasonable delay in the hiring process. These directors stated that the Workforce Management Board and its successor committee, Human Resources Operations Committee, have been operating in a highly risk-averse manner, and that even low-priority staffing actions were scrutinized. This, they felt, resulted in delays to even simple hiring processes. In interviews non – managers maintained that they are responsible enough to exercise this delegated authority and conduct their staffing actions with less supervision. Therefore, while the requirement to protect the Deputy Minister's delegated authority may be apparent to HRWSB employees; it appears that it has not been adequately communicated to sub-delegated hiring managers.
4.4.2 The National Administrative Unit
In alignment with Treasury Board Secretariat' Common Human Resources Business Process, the HRWSB identified the opportunity to re-engineer services delivery by separating administrative from non-administrative staffing and classification actions, and centralizing the processing of administrative actions into the National Administrative Unit located at National Headquarters. The National Administrative Unit was made responsible for administrative staffing actions, which include assignments, student hiring, changes to reporting relationships, and position reactivations. The National Administrative Unit consolidated Fast Track Staffing practices so that it could performs transactional staffing and classification actions nationally. The rationale behind making the National Administrative Unit responsible for administrative actions was to free advisors' time so that they could apply their expertise in guiding hiring managers on more complicated staffing actions.
Despite the National Administrative Unit's primary purpose, a majority of respondents in the regions and at Headquarters believed that the unit contributed to inefficiencies in the staffing process. Managers and staff noted that challenges have arisen as a result of dealing with different National Administrative Unit contacts for each staffing action that they have to undertake.
According to interview participants and Service Centre documentation, administrative officers at the National Administrative Unit are assigned by files or actions, in contrast to the process for non-administrative staffing actions, which are completed by advisors at Headquarters and in the Service Centres, who are assigned by sector or region.Footnote 67 As a result, non- managers stated that it was challenging to manage actions processed through the National Administrative Unit. advisors concurred, and stated that they were frequently called upon to assist with what should be routine actions, due to complications arising from the process between non- managers and the National Administrative Unit. advisors found that even with their expertise, they were unable to function efficiently with the National Administrative Unit. Non- managers stated that Staffing or Classification Action Request Forms sent to be processed by the National Administrative Unit sometimes either remained at the National Administrative Unit unprocessed or were returned to the hiring manager to be fixed, thereby delaying the entire process. In contrast, Staffing or Classification Action Request Forms for non-administrative actions were supported by advisors, who contacted hiring managers to fix any errors in the forms before processing each request.
There is a perception that unit staff is not familiar enough with its client groups' needs. During the course of interviews at Headquarters, several advisors suggested having an point-person charged with liaising with the National Administrative Unit, instead of multiple points of contact with requesting managers, in case follow-up action was required. Managers also suggested that having a dedicated contact for issues with generic Statement of Merit Criteria and pools, which suffer from over processing, would be of benefit. Operational efficiencies and effectiveness can be gained through standardization and centralization of business processes and organizational design.
Regional offices have made attempts to mitigate delays related to the National Administrative Unit. The Western Yukon Service Centre designated a developmental human resource advisor to act as a liaison between sub-delegated managers in the regions and the National Administrative Unit. This pilot project took place between April and June 2014. Designated Advisor was charged with tracking Staffing or Classification Action Request Forms sent to the National Administrative Unit. Within the first week, managers noted that "turnaround times had decreased significantly," and mistakes managers sometimes made filling out the forms sent to the National Administrative Unit were less frequent due to the dedicated resource's assistance.Footnote 68 The regional director recommended several courses of action, endorsing the creation of a position within the Service Centres to facilitate managers' requests and the creation of an electronic form for managers to track administrative actions.Footnote 69
Point for Consideration: The Department should consider exercising flexibilities to ensure that an appropriate level of oversight, based on risk, is applied to staffing actions.
4.4.3 Regional Offices
According to the 2013 INAC Corporate Risk Profile, the creation of Service Centres caused challenges for -related functions like staffing, due to confusion over roles and responsibilities for all parties involved in the staffing process, and unintended gaps in expertise. In the regions, these challenges have resulted in an incomplete implementation of the Common Human Resources Business Process.
At National Headquarters, the creation of Business Management Units within sectors led to Business Management Units employees' providing some -related functions (e.g., provision of advice to managers) instead of advisors; although some of these functions are often outside of the unit's expertise.
In comparison, regional offices were not provided with Business Management Units. Instead, they retained two or more -related positions that were to provide support for managers on issues related to labour and collective agreements, and planning. According to interviewees and documentation reviewed, these employees or 'footprints', have continued to perform activities related to staffing even though the staffing function was transferred to the Service Centres. Regional senior and middle management, as well as Service Centre interviewees, stated that there has been a need to develop new relationships between regional managers and employees at the Service Centres.
Managers now need to solicit most of their -related advice from Advisors at the Service Centres, which are not located geographically close to all regional offices (see Figure 11). Employees at the Service Centres now serve many new clients, and they may not have the regional expertise necessary to provide the most relevant advice.
Figure 11: Geographic Distribution and Reporting Relationships of Service Centres, Regional Offices, Satellite Offices, and National Headquarters
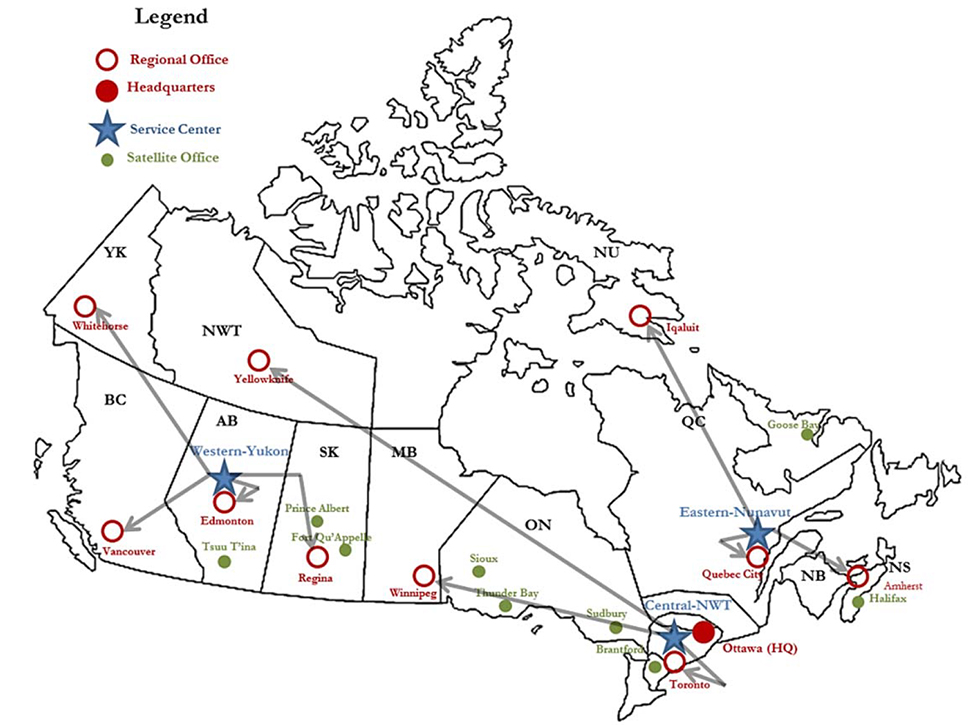
Text alternative for Figure 11: Geographic Distribution and Reporting Relationships of Service Centres, Regional Offices, Satellite Offices, and National Headquarters
This map of Canada indicates the physical location and reporting relationships of the Human Resource Service Centers, satellite offices, regional offices, and the department’s National Headquarters. There are nine satellite offices across Canada: 1 in Alberta, 3 in Saskatchewan, 4 in southern Ontario, and 2 in the Atlantic Provinces.
Generally, regional offices are physically located near the Service Centre to which they report. The regional offices in the three Northern territories are the furthest from their respective Service Centres. There is also a significant distance between the Winnipeg, MB regional office and the Central NWT Service Centre in Toronto, ON.
Other challenges that remain as a result of this structural change include the working relationship between the Service Centres and the regional offices due to the lack of clarity surrounding functions, and a lack of expertise felt on both sides. Further, both and non- managers discussed challenges that had arisen with the separation of the Planning function at the regional office and the staffing and classification responsibility resting with the Service Centre. Interviewees believed that for optimal strategic planning purposes and any large-scale reorganization exercises, these functions should be integrated.
According to regional management teams, given the separation of services, they lack a single contact that can see the 'whole picture'. As a result, regional managers use regional footprints for extensive services. This has occurred due to their regional expertise, familiarity, and as a means to expedite actions and reduce the draw on manager time. Many of these requests made to personnel in the regional office should now be the responsibility of the Service Centres.
Information gathered from interviews and group discussion participants indicates that non- directors and non- managers located further geographically from their respective Service Centres experience greater challenges obtaining service from their respective Service Centre than those located in closer proximity. Human resource staff corroborated this finding. staff in the Service Centres spoke to challenges in serving regions with which they were not familiar; having to develop relationships with regional office staff that they had not met face-to-face, and not having enough staff to adequately serve their client bases.
Point for Consideration: Consider options for improved service delivery by Service Centres to regional offices. This could involve changing service relationships such as creating new methods of triaging service requests from regional offices to Service Centres, or realigning the distribution of request by volume rather than by region.
4.4.4 Training and Support
Finding: There is a need for more -related training and support for non- senior and middle managers throughout the Department.
The Corporate Risk Profiles of 2010-11 and 2013-14 (see Annex A) identified a knowledge gap among hiring managers, particularly with respect to business processes related to hiring.Footnote 70 Evaluation interviewees and group interview participants admitted that their lack of expertise often added to the length of time it took to complete a staffing action. They cited barriers such as lack of developed tools to assist them and lack of expertise and guidance. respondents shared concern over hiring managers' lack of expertise and its contribution to the lengthening of staffing processes.
Qualitative evidence gathered from interviews and focus groups suggests that managers were unsatisfied with the availability of uniform tools during the implementation phase of the Common Human Resources Business Process at INAC. Respondents in in both and non- positions expressed a belief that the Common Human Resources Business Process was implemented throughout INAC before adequate tools and training were in place. Several respondents in the regions stated that they had expected tools to assist managers in their new -related responsibilities to be developed and provided to them by HRWSB. In some cases, tools and checklists were being developed on an ad hoc basis by regional offices, Service Centres, and sectors at Headquarters rather than coming from one central location. Several Business Management Unit representatives stated that they had created their own process maps to support managers in their hiring processes; and in the regions, some and non- employees have developed their own "checklists" for managers to navigate the hiring process. Tools developed by the Western-Yukon Service Centre over recent years to guide managers through the staffing process were leveraged by both Headquarters and other regions. Service Centres and the National Headquarters continue to face difficulties achieving uniform service delivery across the Department, with each entity operating as a unique unit with differing tools and services to serve their clients.
There is a remaining capacity gap among non- managers, which causes delays in the hiring process. This gap could be addressed by the introduction of uniform tools and increased training for non- managers.
Given transition, Managers expressed a general level of concern with the support and the availability of advisors to provide feedback and advice, as indicated by interviewees in non- management roles. Several senior and middle managers in both Headquarters and in the regions indicated that advisors were too slow to respond to questions and provide advice during the staffing process, causing delays.Footnote 71 At Headquarters and in the regions, there was a general feeling that advisors at Headquarters and in the Service Centres were not available; respondents stated that advisors were either physically absent from their posts and working remotely, off on sick leave, or at home on leave. Several respondents also stated that there were many advisors who were new to their positions, and that they too were becoming familiar with their roles. Both and non- respondents acknowledged that employees both at Headquarters and in the Service Centres were under-resourced and over-worked, and attributed lower service standards.
Further, Non- managers also reported that they feel they lack the expertise to complete responsibilities efficiently; as a result, they are making mistakes which may lengthen staffing processes. In both the interviews and group discussions, and the documentation, mistakes made by hiring managers when completing Staffing or Classification Action Request Forms, were identified as a contributing factor to lengthening staffing processes. This factor was most commonly cited by employees; the importance of accuracy appeared on internal training documentation for managers as well. Non- senior and middle management respondents agreed that they were feeling overwhelmed and under-resourced with respect to their responsibilities for staffing, especially under the Common Human Resources Business Process. Both non- and informants stressed the capacity gap.
Established priority lists of indeterminate employees who have been affected by workforce adjustment initiatives must be consulted to ensure these individuals are given first priority at open positions. This practice is applied across the whole of government. At the time when qualitative research was conducted, staffing actions were subject to two priority lists, namely the Public Service Commission's priority list and an internal priority list called the Job Market Unit. Non- managers also expressed lack of clarity about the various priority clearances required for different staffing actions, who was responsible for checking priority lists, and the service standards for each list. Several respondents mentioned delays that were significant enough to require the manager send staffing actions for clearance through priority lists more than once, potentially extending the length of the staffing process.Footnote 72
Additionally, several non- directors stated that it was inefficient for them to perform actions that required expertise that is already held by advisors, who had previously performed many of these activities. As a result, non- managers find it challenging to achieve an efficient and sustainable balance with their day-to-day duties.
Improved communication and department-wide tools and resources for recruitment processes may help address these inefficiencies. Efforts have been made to provide improved guidance to non- managers completing staffing processes. For example, the Western-Yukon Service Centre produced a presentation that described all potential sources of staffing delays, typically caused by incomplete, missing or incorrect information on forms sent to either the National Administrative Unit or the Service Centre.Footnote 73 The Western-Yukon Service Centre website, with its many staffing tools, including tip sheets, presentations, and check-lists, was used to assist managers in the regions that it serves.
Point for Consideration: Additional training should be provided to and non- employees to ensure a consistent understanding of roles and responsibilities and ability to perform their respective duties under Common Human Resources Business Process. In addition, common tools, such as common Statement of Merit Criteria, checklists, etc., developed by National Headquarters and the Service Centres could be consolidated, to help ensure consistent hiring practices and achievement of service standards. Service Centres should ensure that that centralized tools serve the differing needs of their regions.
5. Evaluation Findings – Development
This section provides key evaluation findings related to employee development activities at INAC. First, the use of learning plans and Public Service Performance Management agreements are analyzed, followed by an examination of the available resources for training opportunities to fulfill these required actions. Next, the evaluation discusses how employee performance is addressed within the Department, including available support and development tools for both low and strong performers. Particular attention on Indigenous employee learning and development activities at INAC is then provided. The section concludes by examining the differences between employee learning and development activities and satisfaction with development and training opportunities at National Headquarters and regional offices.
In the area of development, the following evaluation questions are addressed:
- What actions does the Department take to encourage employee development and training?
- Do employees complete the development/training opportunities identified in their learning plans?
- What is the level of training engaged in by employees?
- How much does the organization spend on developing and training its employees?
- What inhibitors may be in place that limit employee's level of development/training?
The evaluation looked at a number of processes designed to support these areas, including the presence and robustness of a performance management system and the presence of learning and development opportunities. Findings are discussed below.
5.1 Development
5.1.1 Employee Learning and Development
One of the key means to support employee development, as well as performance and productivity, is through the use of performance management programs. Such programs include activities that involve planning, developing, coaching and feedback to employees. The Treasury Board Secretariat's Directive on Performance Management replaced INAC's Employee Performance Management Policy on April 1, 2014. The new directive was introduced to support enhanced and consistent performance management in federal organizations. It outlines Deputy Heads' responsibility to, among other things; establish an employee performance management system. As a result, each department is responsible for ensuring that a number of actions occur on an annual basis, including the development of annual performance and learning plans for all employees.Footnote 74 This occurs through the development of Public Service Performance Management agreements (PSPM), which are established between managers and employees.
As part of the evaluation, and to gauge INAC's progress in the performance management and learning plan provisions of the Directive on Performance Management, information was sought on the level of implementation of PSPMs. Data indicates, as shown in Table 4, below, that from 2011-12 to 2013-14 INAC achieved a higher percentage PSPM completion rate than planned, and a slightly lower than targeted learning plan rate.Footnote 75
| Year | Target | Employee Performance Monitoring Rate | Learning Plan Rate |
|---|---|---|---|
| 2011-2012 | 90.0% | 93.2% | 89.3% |
| 2012-2013 | 90.0% | 94.7% | 88.8% |
| 2013-2014 | 90.0% | 91.1% | 87.8% |
*Source: INAC. HRWSB Corporate Indicators Reports (2011-12 to 2013-14).Footnote 76 |
|||
The most recent aggregate analysis of learning plan content was completed at department-wide, sectoral, and regional levels in fiscal year 2013-14. In this year, 88 percent of employees across the Department had a learning plan, though only 86 percent of these plans actually had at least one learning activity planned in their learning plan. Some regions, such as Ontario, Manitoba, and the Northwest Territories had no learning activities for 99 percent or more of their employees.Footnote 77 Learning plans promote the creation of an organizational culture of continuous learning at INAC. While it is possible that managers are engaging in informal or alternative methods of development planning outside the formal tools offered by HRWSB and Treasury Board Secretariat, the instances of empty learning plans may indicate that continuous employee development has not be prioritized to the extent desired.
While target levels have been maintained over the three year period for which data was available, there has been a slight decrease in the level of PSPMs and learning plans developed between managers and employees. Despite the high percentage of PSPMs in place, managers indicated concerns about the amount of time it takes to develop performance agreements and learning plans, and complete mid- and end-of-year performance assessments. Most concern centered on efforts needed to prepare action plans to develop poor performers, or talent management plans for strong performers. Both managers and human resources specialists suggested that additional guidance in these areas would be helpful. These concerns were echoed in the Branch's 2014 Review of Services.
5.1.2 Progress in Public Service Performance Management Agreements
Performance management systems are established to support employee performance and productivity. Implementing and following up on performance management agreements is meant to support employees in their development and to provide meaningful feedback on their progress at work.
Information collected from Public Service Performance Agreements, including work objectives and learning plans, are housed in an internal data management system managed by the corporate learning branch of HRWSB. While the previous reporting system was linked manually to the Department's human resources data management system, PeopleSoft, the new PSPM app is linked to pay information only, posing challenges for aggregate data analysis.
Using the new PSPM application, HRWSB can extract data about the content of learning plans. Managers are also able to view the content of all learning plans for employees under their authority through the app, but are not able to easily extract this data for aggregate analysis that would support integrated human resource planning. Key informants noted that analysis for the fiscal year 2014 – 15 was challenging due to issues related to data organization after extraction from the PSPM system.
Performance management tools provide data, which is integral to planning for future training and development activities. Managers can consider maximizing the utility of the PSPM and learning plans by leveraging data provided by HRWSB and housed in the online PSPM application. During the period of transition to a government-wide approach to performance management, departmental Human Resource Functions across the Government face difficulties extracting useable aggregate data from the PSPM application and linking it to employees to track outcomes. Interviewees in non-human resource management positions across INAC as well as professionals reported difficulties accessing useful aggregate data from the new performance management systems during this period of transition. Representatives from HRWSB have expressed an intention to continue producing trend analysis using this data as parallel data storage systems are integrated.
5.1.3 Resources for Learning and Development
Finding: The Department has increasingly relied on lower cost online training for their employees to access career-related training. While INAC's employees tend to have higher levels of satisfaction with training than comparable departments, there are opportunities for improvement.
INAC employees have access to any number of sources for development and training, including training and events offered by private, not-for-profit and public sector suppliers, offerings available directly from within the Department itself, and courses and training delivered by other government departments, particularly the Canada School of Public Service.
While information on the number of training days or courses attended by employees was not available, Table 5 provides a summary of departmental expenditures on training from Canada School of Public Service and other suppliers between 2011-12 and 2014-15.Footnote 78
| 2011-12 | 2012-13 | 2013-14 | 2014-15 | |
|---|---|---|---|---|
| Cost of Canada School of Public Service Training | $2,881,292 | $2,427,730 | $1,907,920 | $1,681,932 |
| Cost of Training from Other Suppliers | $4,365,064 | $3,371,105 | $3,408,755 | $3,059,333 |
| Total | $7,246,356 | $5,798,835 | $5,316,675 | $4,741,265 |
*Source: INAC Training Cost Analysis, Learning and Well-Being Directorate, August 13, 2015 |
||||
The data shows that the Department's expenditures for Canada School of Public Service and other supplier training dropped by approximately 10 percent per year over the four year period for which data were available. Average training cost per employee ranged between $1,050 and $1,400, of which between 35 percent and 42 percent was expended on Canada School of Public Service training, and between 58 percent and 65 percent went to other suppliers.
The Training Cost Analysis completed by the learning and wellbeing directorate states that there has been an increased use of self-paced online training. In 2014-15, classroom training sessions reached 1,827, and the number of online self-paced training sessions enrolled in was 2,181. As shown in Table 6 below, average spending on training per employee has declined by 21 percent since 2011–12, coinciding with the introduction of new training technologies and opportunities. No information on the outcomes of individuals who participated in training was available at the time of this evaluation.
| 2011-12 | 2012-13 | 2013-14 | 2014-15 | |
|---|---|---|---|---|
| Indeterminate PopulationFootnote 79 | 5,185 | 4,834 | 4,692 | 4,317 |
| Total Training SpendingFootnote 80 | $7,246,356 | $5,798,835 | $5,316,675 | $4,741,265 |
| Spending per Employee* | $1,398 | $1,200 | $1,133 | $1,098 |
*Spending per Employee is calculated as Total Spending divided by Indeterminate Population |
||||
In the absence of substantive quantitative data about training activities, qualitative information gathered as part of focus groups and interviews with INAC staff, as well as the analysis of employee responses to the PSES reveal that when comparing the responses of determinate employees, INAC performs similarly to other government departments when it comes to training and career development themes:
- In 2014, 62 percent of INAC's indeterminate staff agreed that they get the training they need to do their job, compared to 65.1 percent of indeterminate staff in comparable departments. These numbers are slightly higher than rates of agreement found in other government departments.
- 50.7 percent of INAC's indeterminate staff agrees that their department does a good job supporting employee career development, compared to approximately 50.5 percent agreement at similar and dissimilar government departments. Since 2011, the level of agreement to this statement has dropped by approximately 10 percentage points. Other departments also saw a decline in positive responses in this area, the rate of decline was smaller at approximately five percentage points.
- INAC's indeterminate employees who worked as supervisors were less likely to report that they received the support they need from senior management when compared to both similar and dissimilar other government departments. In both cases, the gap was approximately eight percentage points.Footnote 81
While INAC performs similarly to other government departments, positive views of development activities within the Department are lower than desired. Information gathered through focus groups and interviews about development, training and learning revealed the following:
- Overall, Human Resources professional who were interviewed reported that they were adequately trained to complete their jobs. Human Resource Professional at the Department expressed frustration with the level of training and expertise available for managers to complete their new responsibilities following widespread departmental changes.
- Respondents in regional offices and in the National Capital Region reported that they felt employees who received mid-level marks on their PSPM assessments were most in need of training opportunities to advance in their careers. Managers also expressed concern that there has been a lack of opportunity for promotions within the Department, which reduces the incentive for employees to develop their skills.
- Several barriers to development opportunities for employees were identified in key informant interviews: in particular, some interviewees stated that budget constraints restricted the amount of training available in some areas. Additional barriers cited included travel costs, particularly in some regional offices.
- There has been a shift in the Department to online training; initial potential challenges with this transition were identified as: bandwidth issues, user resistance to change and unwillingness to learn a new system. These challenges, however, have been mitigated by collaboration with Information Technology and an increase in training to support employees in the use of these new systems.
The movement towards informal learning mechanisms reflects priorities outlined in the Corporate Human Resources plan in support of Destination 2020 goals for public service innovation. Managers are encouraged to include 20 percent formal and 80 percent informal objectives in their employees learning plans, and to leverage online learning technology as the "default source" of training.Footnote 82 Managers at the program, regional and departmental levels have consistently noted that lack of available opportunities for training and development is a key risk for human resources business conditions.Footnote 83
By leveraging modern technologies and addressing barriers to training opportunities, the department can promote a culture of continuous learning. During the period between 2013 and 2015, the learning and wellbeing directorate at HRWSB has transitioned all orientation and INAC-required training online using the Learning Portal, hosted on the Department's intranet. The Learning Portal serves as a single-point of entry for INAC employees across the nation to receive online training, ensuring more consistent access to services outside the National Capital Region. The responsible directorate currently hosts learning roadmaps for employees on the learning portal, and hopes to use the website for learning activity promotion in the future.
5.1.5 Indigenous Employee Learning and Development
Finding: INAC has taken steps to encourage Indigenous representation in executive levels across the Department with targeted Indigenous leadership development initiatives.
INAC places an emphasis on development opportunities for Indigenous Employees in their 2014-2020 Corporate Human Resource Plan.Footnote 84 Indeed, two of the largest department-wide development initiatives at INAC are targeted towards employees who self-identify as Indigenous Persons.Footnote 85 According to the Public Service Employment Survey, Indigenous employees tended to have slightly lower views of INAC's development activities than non-Indigenous employees.
- On average, Indigenous employees gave positive responses to all development-related questions at slightly lower rates than their non-Indigenous colleagues. On two of seven questions, the gap between Indigenous and non-Indigenous employees was five percentage points or higher.
- Indigenous employees reported satisfaction with the training they receive to do their job at rates approximately five percentage points below their non-Indigenous colleagues at 59 percent agreement compared to non-Indigenous rates of 64 percent.
- In response to the statement "My department […] does a good job of supporting employee career development" 48 percent of Indigenous respondents stated that they agree – this rate is six percentage points lower than non-Indigenous employees.Footnote 86
The gap between Indigenous and non-Indigenous employee satisfaction with development activities is observable in comparable departments and in dissimilar departments. Overall, this trend indicates that Indigenous employees have similar or slightly lower levels of satisfaction with development activities as non-Indigenous employees at INAC.
Despite this gap, the Department has taken steps to promote Indigenous career development with targeted initiatives such as the Aboriginal Leadership and Development Initiative. Indigenous representation within the executive cadre in the Public Service tends to be below workforce availability levels.Footnote 87 In response to this challenge, the Department introduced a targeted development program to promote skills development for Indigenous employees. The Aboriginal Leadership Development Initiative was introduced in 2011 – 12. Aboriginal Leadership Development Initiative participants complete the Canada School of Public Service's Direction executive training program in combination with INAC's own Aboriginal Leadership Training.Footnote 88 Outcomes for participants in the Aboriginal Leadership Development Initiative's first cohort have indicated some positive impact on participant's upward mobility: three participants held acting assignments at the EX-02 level; and two were promoted to EX-01 positions.Footnote 89
Key Informant Interview respondents expressed that the Canada School of Public Service no longer offers Indigenous-focused development courses, which may indicate the continued need for programs such as the Aboriginal Leadership Development Initiative.
5.1.6 Learning and Development in the Regions and National Capital Region
Finding: While PSPM completion, including performance management agreements and learning plans – have consistently met target levels, regional use of PSPM agreements tends to be lower than rates observed in the National Capital Region.
As previously mentioned the Department has met or exceeded targets for performance management agreement and learning plan completion when considered as a whole. A review of trend data comparing regional completion rates to those in National Capital Region show that Employee Performance Monitoring completion rates were generally higher in the National Capital Region than in the regions. Since 2011–12, average Employee Performance Monitoring completion rates across the Department were above target levels. Despite this, there has been a decline in the aggregate average Performance Monitoring completion rate for employees located in regions outside the National Capital Region.
Figure 12: Employee Performance Monitoring Completion Rate by Physical Location.Footnote 90
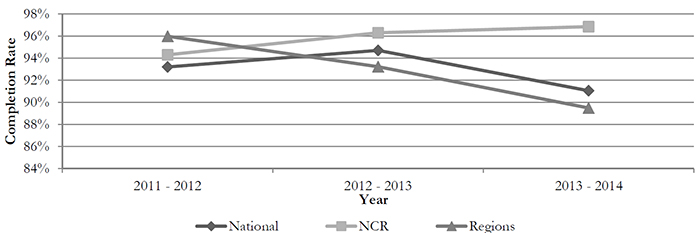
Text alternative for Figure 12: Employee Performance Monitoring Completion Rate by Physical Location
This line graph compares national average employee performance monitoring completion rates to those observed in the NCR and in the Regions. The x-axis is labeled by year from 2011-12 to 2013-14. The y-axis is labeled by percentage from 84 – 98%. Generally, completion rates in the NCR have increased over the three year period from 94% to approximately 97%. Completion rates in the Regions have decreased from approximately 96% to approximately 89%.
Similar trends are observable in relation to learning plan completion, as shown in Figure 12. While learning plan completion rates have hovered around 88 percent for the Department across the years, the average completion rate for employees working in regions outside the National Capital Region is markedly lower. Key informants indicated that time and budget constraints may contribute to the completion and implementation of learning plans. Figure 13 shows the divergent completion rates for learning plans in regional offices compared to the National Capital Region.
Figure 13: Learning Plan Completion by Physical Location and Year.Footnote 91
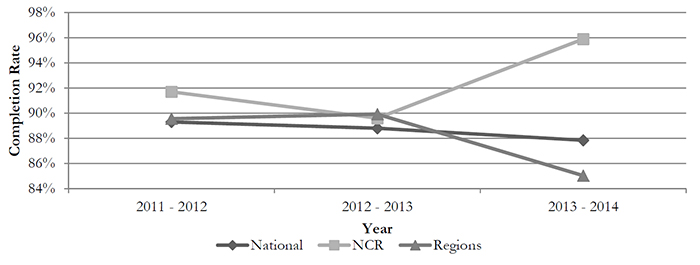
Text alternative for Figure 13: Learning Plan Completion by Physical Location and Year
This line graph compares national average learning plan completion rates to those observed in the NCR and in the Regions. The x-axis is labeled by year from 2011-12 to 2013-14. The y-axis is labeled by percentage from 84 – 98%. From 2011 – 12 to 2012-13, learning plan completion rates converged around 90%. NCR learning plan completion rates increased to 96% while regional completion dropped to approximately 85% in 2013-14.
A 2014 Review of Management Practice Audits at INAC between 2010 and 2014 identified a learning gap for managers to apply Employee Performance Measurement in the workplace. The review notes that managers in the regions often do not prioritize accurate performance measurement due to heavy workloads.Footnote 92 Recent changes to the data entry process for PSPMs may help reduce the reporting burden. The new PSPM application hosted by the Treasury Board automatically stores data relating to the content of PSPMs, removing the additional step of data entry into PeopleSoft.Footnote 93
Audits in these years also cited management knowledge as a barrier for learning plan completion. The audits frequently recommended that managers should receive more training so that they are able to effectively execute their new roles in relation to performance management. Audits in this period affirmed the importance of improving both the completion rate and the quality of employee performance measurement.Footnote 94
Developing high quality PSPMs and learning plans helps support the goal of creating a culture of constant learning at INAC and promotes effective talent management.Footnote 95 The disparity between regional and National Capital Region completion rates may be indicative of a gap in Learning and Development activities or opportunities based on physical location. This disparity could pose an obstacle for future performance in the area of retention.
The Yukon–Western Regional Service Centre is the only region that has published reports on the content of their learning plans on an annual basis available to the entire department. The goal of this report is to determine trends emerging in PSPM's, providing senior managers with specific information and data that will support effective investment in training and to identify training gaps.Footnote 96 Monitoring and communicating the content of learning plans has been identified as a leading practice to maximize the utility of these processes.
Point for Consideration: The Western Yukon Region completes trend analyses based on the content of employee learning plans by province. Managers may consider implementing this practice in other regions to promote effective planning in the area of development.
6. Evaluation Findings - Retention
6.1 Retention
INAC's Corporate Human Resources Plan 2014–2020 emphasizes the importance of retaining "sufficiently qualified, experienced and representative employees" to encourage the proper functioning of day to day activities and program delivery. The Department emphasizes the dual process of using innovative learning practices to develop the knowledge and skills of employees and subsequently fostering the retention of highly skilled employees.Footnote 97 This section first examines the effects of workplace adjustment exercises on the retention of qualified and experienced INAC employees. Next, INAC's activities and performance related to retaining a representative workforce are discussed. Then, the impact of career advancement opportunities within the Department on employee retention is presented. Finally, the evaluation examines at employee wellness initiatives within INAC, including how the Department manages harassment and conflict in the workplace and how the Department can improve employee retention through additional or improved employee wellness activities.
This section of the evaluation addresses the following evaluation questions:
- Are INAC's current retention activities effective at maintaining a qualified, experienced and representative workforce?
- Are INAC's employees able to find promotions within the Department?
- Are INAC's wellness and support activities effective at creating an attractive workplace for employees?
- Is INAC effective at preventing and resolving conflict and harassment against employees?
6.1.1 Workforce Adjustment Impacting Employee Retention
Finding: While the departure rate in the Department remained relatively stable between 2010–11 and 2014–15, it has consistently exceeded the entry rate. This gap coupled with an increase in the departure rate from just over nine percent in 2013-14 to approximately 13 percent in 2014-15 may indicate a need for improved activities aimed at retaining an experienced, qualified and representative workforce at INAC.
The "departure rate" is used in HRWSB's internal reporting as an indicator of the extent to which the Department could be impacted by employee mobility. The "departure rate" is calculated by considering the number of indeterminate and determinate employees who leave the organization in a fiscal year divided by the total population at the beginning of this period.Footnote 98
Figure 14a: INAC Departure Rate by Year (2010–11 to 2014–2015)*
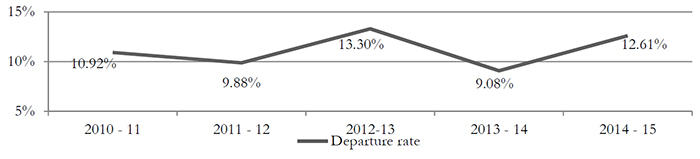
Text alternative for Figure 14a: INAC Departure Rate by Year (2010–11 to 2014–2015)*
This line graph shows the departure rate for INAC over the five year period of the evaluation. The x-axis is labelled by year from 2010-11 to 2014-15. The y-axis is labeled by percentage, from 5-15%. The line graph indicates that departure rates have fluctuated between 9-13% over the period.
Since 2010–11, the departure rate has fluctuated at between nine and 13 percent. Since 2011–12, the proportion of departures has remained higher than entries. This trend is largely explained by transfers out to other departments and an increase in exits attributed to the "other" category, which includes discharges, layoffs, workforce adjustments, individuals who return to school and deaths. The proportion of departures that fall into the "other" category rose significantly between 2010-11 and 2014-15. In 2011–12, "other" departures accounted for approximately five percent of attrition in the Department. This number rose to 35 percent in 2012–13, coinciding with the Department's implementation of DRAP. In the year following DRAP activities, "other" departures dropped to 25 percent of overall departures, however, from 2013-14 to 2014-15, overall departures grew from 464 to 620, and the proportion of departures in the "other" category increased from 25 percent to 38 percent.Footnote 99 Further, the number of departures in 2014-15 was more than twice the number of entries into the Department.Footnote 100
The increase in departures and the proportion of departures in the "other" category for 2014-15 indicate that organizational restructuring and workforce adjustment may still be negatively impacting INAC's employee retention.
Figure 14b: Employee Departures at INAC by Year, 2010–11 to 2014–15.Footnote 101

Text alternative for Figure 14b: Employee Departures at INAC by Year, 2010–11 to 2014–15
This line graph compares employee entry and departure counts over the five year period of the evaluation. The x-axis is labelled by year from 2010-11 to 2014-15. The y-axis indicates the count of entries and exits, labelled from 0-800. Since 2011-12, employee departures have exceeded employee entries.
6.1.2 Retaining a Representative Workforce
Finding: Although INAC employees were impacted by organizational restructuring and workforce adjustment activities during the period covered by this evaluation (2010-11 to 2014-15), the Department has been successful at retaining a representative workforce, including Indigenous employees.
The Employment Equity Act stipulates that employees, including all federal government departments, are required to implement employment equity by identifying and eliminating employment barriers against persons in designated groups and instituting positive policies and practices and making reasonable accommodations so as to allow persons in designated groups to achieve a degree of representation in each occupational group in the employer's workforce.Footnote 102
As shown in Table 7 below, the Department has managed to exceed workforce availability levels for all designated groups in the employment equity act over time. Since 2010-11, the proportion of Indigenous peoples, visible minorities, people with disabilities, and women have increased as workforce availability remained constant or decreased. With regards to Indigenous employment, the Department has exceeded workforce availability by an average of 23 percent from 2010-11 to 2014-15. However, as noted in Section 4.4.1, the Department is still working towards its aspirational 50 percent Indigenous representation.
| 2010-11 | 2011-12 | 2012-13 | 2013-14 | 2014-15 | ||
|---|---|---|---|---|---|---|
| Indigenous Peoples | % of INAC | 28.4 | 28.7 | 30.1 | 29.1 | 29.3 |
| Workforce Availability | 6.9 | 6.9 | 5.7 | 6 | 5.1 | |
| Persons with Disabilities | INAC | 5.5 | 5.7 | 5.8 | 5.9 | 5.9 |
| Workforce Availability | 3.8 | 3.8 | 3.9 | 6.7 | 3.7 | |
| Visible Minorities | INAC | 8.7 | 9.9 | 10.9 | 11.2 | 11.6 |
| Workforce Availability | 10.7 | 10.7 | 9.7 | 10.2 | 10.5 | |
| Women | INAC | 63.7 | 63.8 | 67.7 | 63.9 | 64.6 |
| Workforce Availability | 61.8 | 61.8 | 57.4 | 60.5 | 60.6 | |
In the period examined by the evaluation, the number of Indigenous "entries" to the Department has been lower than the number of "departures". Indigenous entries have displayed a downward trend since 2011–12, as seen in Figure 14. Indigenous "departures" peaked in 2012–13, aligned with responsible expenditure management and departmental restructuring activities in response to DRAP that occurred at that time, and have remained significantly higher than entries since this point. However, the Indigenous departure rate mirrored that of the Department as a whole at 11.5 percent from 2010-11 to 2014-15, and workforce representation for Indigenous peoples has remained around 29 percent over these five years. Footnote 104
The data presented in Figure 15 demonstrates that Indigenous departure trend is in line with the Department's overall departure rate. The net loss in the number of Indigenous employees seen by the disparity between the number of Indigenous entries and departures is most likely attributable to larger reductions in the Department's workforce. Indigenous employees appear to have been affected by workforce adjustments at similar rates to the rest of the Department. While INAC is still working towards the aspirational objective of recruiting and retaining a workforce that is 50 percent Indigenous, the departure data for Indigenous employees indicates that INAC has been successful at retaining First Nations employees.
Figure 15: Indigenous Entries and DeparturesFootnote 105
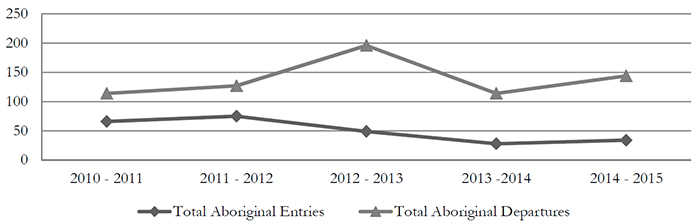
Text alternative for Figure 15: Indigenous Entries and Departures
This line graph compares counts of the entry and exit of Indigenous employees at INAC during the five year period of the evaluation. The x-axis is labelled by year from 2010-11 to 2014-15. The y-axis shows counts of employee exit or entry, labelled from 0-250. Aboriginal exits have exceeded Aboriginal entries in all years, with the greatest gap in 2012-13. Overall, entry counts have declined slightly while exits have increased.
Information about the reasons for departure is pulled from the Department's internal PeopleSoft data management program, but additional details from exit Interviews were not available. At the time of this evaluation, exit interviews were available on a voluntary basis to both employees and students at the time of departure. The exit interview combines elements of survey and formal interview processes aimed at measuring employee experience. The exit interview form for employees includes questions related to physical environment and working conditions; professional development; management support; Indigenous workforce; and respect in the workplace.
Information from exit interviews could provide valuable information needed to present a cogent analysis of factors, which contribute to attrition. The Department may consider implementing mandatory exit interviews for all employees at their time of departure to ensure adequate information is available to assess the success of the Department's retention activities.
6.1.3 Internal Promotions and Career Development at INAC
Finding: Employees at INAC tend to be less satisfied with internal career development and promotion opportunities when compared to similar and dissimilar government departments.
The availability of promotion and career development opportunities within INAC is linked to both development and retention outcomes. Motivation to develop key skills and abilities is intuitively tied to the possibility of advancement. Lack of promotion opportunities can also create difficulties retaining highly skilled employees in competitive job markets. A risk trend analysis completed by the Department in support of this evaluation identified the risk that "regions will not be able to retain experienced employees (due to turnover, decreased morale, lack of training)" was a key area of concern, associated with a high risk rating.Footnote 106
Thus, it is important to understand employee perceptions of career development opportunities as they relate to retention. Within the federal public service, departments can use several questions from the PSES to determine the extent to which their employees believe promotion and career development opportunities exist within their work unit, branch or department:
- Approximately 51 percent of INAC's indeterminate staff stated that they agree with the statement "my department or agency does a good job of supporting employee career development" in 2014. INAC's affirmative responses have been slightly higher than those of indeterminate employees in comparable departments since 2008. In spite of this, there has been a decline in agreement to this question within INAC over time. Since 2011, the rate of agreement by INAC's indeterminate staff dropped by nearly 11 percentage points.
- Active employees in the Ontario region reported the lowest satisfaction with career development and promotion opportunities – their responses to the above question were 18 percent lower than the departmental mean of 52.2 percent in 2014. Employees in the Atlantic and Quebec regions tend to have higher rates of satisfaction in these areas: The Atlantic region's agreement rate was seven percent higher than the average – in Quebec, agreement was nine percent above the departmental mean.
- Approximately 38 percent of INAC's indeterminate staff stated that they agree with the statement "I believe I have opportunities for promotion within my department or agency, given my education, skills and experience". The rate of agreement has dropped over 16 percent since 2008. While the Department's indeterminate staff once had much higher rates of agreement than comparable departments, in 2014 INAC's results were equal to the average results in comparable departments.
- Indigenous employees were slightly less likely to agree with the above questions than non-Indigenous employees. This gap is only observable in 2014. In previous years, Indigenous employees reported similar satisfaction with career development and promotion opportunities.
Overall, INAC's PSES results indicate that there has been a reduction in satisfaction with promotion and career development opportunities within the Department between 2011 and 2014. Similar reductions in overall satisfaction are observable in comparable departments and the public service as a whole; however the decline has been slightly greater at INAC. In previous years, the Department was a leader in this area.Footnote 107
These results may point to an area of concern for the Department: development and advancement possibilities are important to ensure that INAC maintains a highly skilled workforce to effectively deliver its mandate.
6.1.4 Employee Wellbeing
Finding: INAC has taken concrete steps to improve workplace wellness for its employees. Improved work-life balance and a wide range of wellness activities promote a healthy workplace, which supports the operational need for retention of efficient and engaged employees.
INAC's Corporate Human Resources Plan notes that the Department recognizes "that providing our employees with a healthy and respectful workplace will lead to higher levels of engagement, increased performance and more innovative service delivery for our clients and stakeholders."Footnote 108 Promoting a workplace that ensures the cultural, emotional and physical wellbeing of employees is mandated in policies and legislations, and helps to ensure employee retention in the long-run.Footnote 109 The Plan lists "providing a healthy and respectful workplace" as a key priority for the Department.Footnote 110 The Department's performance on workplace wellbeing issues can be gauged from PSES results over time. Overall, employees at INAC tend to have lower rates of satisfaction on questions related to wellbeing:
- INAC's indeterminate staff reported that they have support at work to balance their work and personal life at rates 7.7 percentage points lower than similar departments: employees agreed 66 percent of the time compared to approximately 74 percent agreement in comparable departments.
- Indeterminate employees at INAC were less likely to agree to the statement "Overall, I like my job" at rates approximately 5 percentage points below those observed in comparable departments. Similarly, they were less likely to agree to the statement "Overall, my department or agency treats me with respect" by approximately 8 percentage points relative to similar departments, and 4 percentage points below the answers provided by indeterminate staff in the general public service. 72.8 percent of indeterminate respondents at INAC agreed with the first question, 73.6 percent agreed with the latter question.
- Regionally, employees in the Ontario region tend to have lower rates of satisfaction with respect and wellbeing in their workplace. The Atlantic region and Quebec region tend to have higher levels of satisfaction in this area.Footnote 111 In both regions, scores on questions related to wellbeing were higher by five percent in a majority of cases: the Atlantic region displayed increased desirable scores on 7 of 16 questions, and the Quebec region did so in 13 of 16 questions.
- Indigenous employees tend to have similar reported levels of workplace satisfaction as non-Indigenous employees, and were more likely to state that they would prefer to remain at the department even if a comparable job was available at another federal department. Since 2008, Indigenous employees have agreed to this question at rates 6–7 percentage points higher than non-Indigenous employees.
Overall, the PSES results show that indeterminate employees at AANDC are less likely than those at comparable departments to feel satisfied with their work environment. The analysis also shows that there is a great deal of regional variation in workplace satisfaction.
This could pose an obstacle for the organization to retain highly skilled employees. Having the appropriate development opportunities for learning and career advancement, as discussed in the previous chapter, is an integral component of retaining a qualified workforce. The Department also recognizes the importance of a healthy and respectful workplace to achieve retention goals.Footnote 112 For this reason, the department has taken steps to improve employee wellbeing and job satisfaction, as described below.
Promoting Health and Work-Life Balance
The Department measures sick leave usage, vacation utilization and unpaid leave as proxies for wellness. According to quarterly reports produced by the HRWSB, unpaid leave has declined significantly since 2011–12. The average amount of sick leave used across the Department has been relatively constant at around 11 days since 2012–13, while average vacation use has increased slightly over the years. Unpaid leave was well below the average for other governmental departments – in 2011-12, public servants took an average of approximately six days unpaid sick leave, whereas employees at INAC took approximately two.Footnote 113 This could be an indication of improved workplace wellbeing, as employees are able to maintain work/life balance.
Vacation and Paid Sick leave varies by region: according to the most recent data available, sick leave use was higher in the Ontario region at approximately 13 days per year and lowest in Nunavut, Yukon, and the North-West Territories at eight to nine days on average.Footnote 114
Point for Consideration: The Western Yukon Regional Service Centre provides management teams with region-specific data analysis of Human Resource risks, challenges, and opportunities. The Service Centre monitors sick leave utilization and vacation utilization as proxies for wellness. Promoting vacation use rather than "banked" vacation through effective communication is a best practice for maintaining work-life balance within regions. This practice could be implemented more broadly across the department.
Figure 16: Average Use of Vacation, Paid Sick Leave and Leave without Pay (2010-11 to 2014-15)

Text alternative for Figure 16: Average Use of Vacation, Paid Sick Leave and Leave without Pay (2010-11 to 2014-15)
This line graph compares average days of leave for vacation, sick leave, and leave without pay. The x axis is labelled by year from 2010-11 to 2014-15. The y axis shows average days of leave and is labelled from 0-20. The graph shows a downward trend in average leave without pay since 2011-12, with slight increases in vacation and sick leave.
Promoting Wellness for Indigenous Employees
Across the Department, Indigenous employees tended to report less satisfaction in response to workplace wellness questions in the PSES. Indigenous employees were less likely than their non-Indigenous colleagues to agree that they have the support they need to balance work and personal life, and that they receive meaningful recognition for work well done. In both cases, the difference was -7 percentage points in 2014.
While the difference between Indigenous and non-Indigenous PSES results for employee wellness questions may indicate a need for additional or improved Indigenous employee wellness initiatives, the Department has taken measures to provide culturally relevant wellness support for Indigenous employees. The Deputy Ministers Aboriginal Workforce Initiative and the Committee for Advancement of Native Employment support Indigenous career development and cultural awareness in the workplace through initiatives such as Aboriginal Awareness Week, Aboriginal History Month and National Aboriginal Day.Footnote 115
The National Capital Region office houses the Kumik Elder's Lodge, designed to provide Indigenous and non-Indigenous employees with guidance and counselling to help deal with unfavorable attitudes and cultural differences. The Lodge hosts Elders from across Canada and provides a space where employees can listen to their teachings. The Kumik provides an opportunity for all employees to develop an appreciation for Indigenous cultures and practices, facilitates co-operation between Indigenous and non-Indigenous employees, and improves the quality of counselling and resolution services provided to Indigenous clients. Similar Elders lodges exist in Vancouver, Toronto, Winnipeg, and Edmonton.
Ensuring culturally appropriate wellness services are available to Indigenous employees is a good practice, supporting improving job satisfaction and promoting Indigenous retention.
6.1.5 Harassment and Conflict Resolution
Finding: INAC's Human Resources Branch has taken concrete steps to address the discrepancy between incidents of harassment and conflicts reported to the Centre for Integrity, Values and Conflict Resolution and self-declared harassment in the anonymous Public Service Employment Survey. Managers can continue to promote a respectful work environment by leveraging resources currently available.
Adequate Harassment prevention and conflict resolution strategies are integral for promoting a safe and healthy workplace and thus retaining staff. The Corporate Human Resources Plan affirms this, stating that "offering and maintaining a workplace that is fair, respectful, harassment-free, enabling, safe and healthy, within the spirit of our Values and Ethics Code" is a key Human Resource priority.
Results from the 2014 PSES indicate that the Department has struggled with effectively preventing and resolving harassment and discrimination. In 2014, PSES results indicated the following:
- When comparing the whole population of the Department, INAC's employees were less likely to state that they feel they can initiate formal processes (i.e. grievances); or that they were satisfied with how matters of harassment and discrimination were resolved. For all three indicators the difference between INAC and comparable departments was between 8 and 10 percentage points.
- Only 32 percent of INAC's indeterminate staff felt they could initiate a formal recourse process such as a grievance, without fear of reprisal. Under half of INAC's indeterminate staff felt satisfied with how matters related to harassment or discrimination were resolved. Decline in satisfaction with harassment resolution occurred predominantly between 2011 and 2014: between these two years, average PSES agreement rates dropped 17 percentage points.
- Employees in the Atlantic region had the poorest results in relation to harassment and discrimination: Only 38 percent of employees in the Atlantic region felt satisfied with how harassment issues are resolved – 16 percentage points below the departmental mean.
- Indigenous employee satisfaction rates lagged 5 percentage points behind non-Indigenous employees in terms of harassment and discrimination resolution.
The Centre for Integrity, Values and Conflict Resolution is the branch responsible for resolving harassment complaints at the Department. In 2015 the Department published a trend analysis describing services it provided. In 2014–15 the Centre facilitated 611 Conflict Resolutions, nine percent of which were in response to an alleged harassment. In this report, the Centre notes that only 13 percent of employees at INAC stated they used conflict resolution to address alleged harassment – this may indicate that for many employees, conflict resolution is not considered a viable solution.
| 2011-12 | 2012-13 | 2013-14 | 2014-15 | |
|---|---|---|---|---|
| Conflict Resolution Actions** | 378 | 395 | 680 | 611 |
| Harassment Complaints | 9 | 24 | 19 | 22 |
* Note: Conflict Resolution Actions may include informal resolution of alleged harassment. |
||||
As shown in Table 8, the Centre received 22 complaints of harassment in 2014–15, half of which originated in the regions, the other half originating in the National Capital Region. By contrast, 25 percent of PSES respondents at INAC stated that they had been victims of harassment in the preceding two years, down from 29 percent in 2011. The Centre probed into harassment at INAC, via a series of focus groups held in 2014, to determine the cause of the gap between experienced and reported harassment. They found that many employees believed that there were "no consequences" for behavior considered harassment and that reporting this behavior could exacerbate the situation.Footnote 116 Respondents also felt that many harassers may not be aware that their behaviour had a negative impact on others. While it may be the case that some individuals reporting harassment in the PSES have unfounded claims, the Treasury Board's Guide on Applying the Harassment Resolution Process notes that "many behaviors that do not meet the definition of harassment may still undermine wellness and excellence at work".Footnote 117
While the Centre's investigation is a valuable first step towards determining the cause of the gap between INAC's PSES results and reported incidents of harassment, further action may be beneficial to ensure a safe and healthy workplace free of harassment. The Treasury Board's guide for managers Preventing and Resolving Harassment in the Workplace states that frequent harassment complaints may indicate a larger issue that affects the wellness of the entire team and workplace. The Treasury Board suggests a neutral third-party workplace assessment to avoid escalation of conflict by determining what steps should be taken.Footnote 118 In instances where multiple reported harassment incidents occur, it may be appropriate to introduce this intervention to better understand causes and solutions.
In instances where undesirable behaviors that do not constitute harassment occur, managers can take steps to address and improve behavior. Employees should be encouraged to familiarize themselves with the definition of Harassment and options for formal and informal conflict resolution.Footnote 119 Managers can promote a respectful workplace by ensuring they communicate effectively with staff about expectations for respectful workplace behavior and the processes available to resolve issues related to harassment or other interpersonal conflicts.
HRWSB maintains an Employee Assistance Program aimed to provide confidential assistance or short term counselling to individuals experiencing personal and work-related problems. Employees can call a hotline to receive confidential support and coaching. The employee assistance programs have been shown to provide useful interventions for workplace conflict through educational campaigns for groups or individuals, and provide problem-specific coaching for managers on a case-by-case basis. While no evaluation of the Employee Assistance Program use at INAC was available at the time of this evaluation, Health Canada published survey data of their employee assistance programs and found that 69 percent of clients reported having less emotional difficulties at work, and 71 percent reported they were less absent at work following their Employee Assistance Program counselling sessions.Footnote 120 Leveraging individual employee support and a wide variety of formal and informal resolution processes can help prevent unreported harassment and encourage workplace wellness.
Point for Consideration: Managers are responsible for promoting a safe and healthy workplace within their branch. Managers can encourage a respectful work environment by ensuring they communicate regularly and effectively with staff about actions that may constitute harassment, the impacts of disrespectful behavior in the workplace, and options for employees seeking conflict resolution.
7. Conclusion and Points for Consideration
7.1 Conclusion
This final section of the report presents the main conclusions arising from the evaluation of recruitment, development and retention activities at Indigenous and Northern Affairs.
7.1.1 Recruitment
Recruitment and staffing are critical to effective Management. However, they must be practiced within the context of other activities including training and development, succession planning, workforce planning, and retention. For example, the process through which candidates go in order to be staffed as an employee is an indicator of the significance of these processes in the efficient functioning of the organization. The evaluation findings suggest that staffing processes require much thought and advanced planning.
Within INAC, the time it takes to staff positions is perceived to be extremely lengthy by non- Managers. The evaluation found that challenges in measurement in the time to staff positions is calculated and reported on differently by the Public Service Commission and INAC; this makes clarity on the issue difficult for non- managers. According to HRWSB data, the length of time to staff at INAC has decreased for the majority of staffing actions. However, average days to staff initial processes for External Advertised Collective increased substantially. The evaluation finds that this gives rise to the development of a consistent set of tools, such as a central library of ready-made general Statements of Merit Criteria to assist managers in initiating a staffing process, or the availability of pools that allow for flexible use by hiring managers. In addition, in order to ensure that hiring managers are well informed, it would be advantageous for INAC's function to proactively communicate with hiring managers.
The evaluation found the efficiency of the staffing process as an area impacted by a lack of clarity around roles and responsibilities of hiring managers and employees. The changes, which came as a result of the Common Human Resources Business Process, are not well-understood across the Department, nor uniformly implemented. The role of the National Administrative Unit has also added to challenges in staffing.
The mandate of the Human Resources Oversight Committee (formerly known as the Workforce Management Board) has changed; this Committee only approves high-risk staffing-related actions. However, since several actions were subject to the former Workforce Management Board's approval including, for example, term extensions, and internal external advertised processes, some senior managers are under the impression that this change is not reflected in the Committee's work. In order to improve on the staffing process, the evaluation found that better communication, appropriate resources for , as well as training and support for non- senior and middle managers will help alleviate these challenges.
In the regions, hiring managers identified challenges associated with the new model. The evaluation found differences in the hiring model of the regional hiring directors and managers at National Headquarters. Within the regions, the evaluation identified challenges that still remain as a result of the re-engineering, including the separation of the Planning function at the regional office and the staffing and classification responsibility resting with the Service Centre. As noted by interviewees, optimal strategic planning and large-scale reorganization exercises will result from an integration of these functions.
With respect to Indigenous recruitment, the aspirational goal of 50 percent Indigenous hires has proven to be challenging even though INAC has several recruitment initiatives that promote the hiring of Indigenous employees. As of December 1, 1993, the Indigenous representation at INAC was 13 percent of all employees which went up, by December 1, 1994, to 15 percent of all employeesNote de bas de page 121. The evaluation finds that the level of Indigenous representation and the number of Indigenous peoples working at INAC grew slightly over the evaluation period. In the context of the slight growth of Indigenous representation at INAC, the evaluation encourages the Department to strengthen its facilitation of Indigenous hiring. For example, integrated planning of human resources and recruitment initiatives undertaken within current staffing activities will be beneficial for INAC.
7.1.2 Development
In an effort to be in line with the federal government's priority of fiscal prudence, the evaluation found that the Department has increasingly relied on lower cost online training for their employees to access career-related training.The training and development practices are geared towards building skill competencies performance and productivity.For example, INAC employees have access to any number of sources for development and training, including training and events offered by private, not-for-profit and public sector suppliers, offerings available directly from within the Department itself, and courses and training delivered by other government departments, particularly the Canada School of Public Service.
The evaluation also notes however, that INAC could strengthen its employee development activities. For instance, the availability of information on the number of training days or courses attended by employees would provide senior managers with specific information and data that will support effective investment in training while identifying training gaps. Further, it could help both INAC and the Canada School of Public Service tailor its course offerings to respond to changing INAC and public sector employee needs. This can be done through improved monitoring of planned versus actual training as identified in employee Public Service Performance Management agreements and learning plans. At the same time, recognizing that regional use of PSPM agreements tends to be lower than rates observed in the National Capital Region this is an opportunity for closingthe disparity between regional and National Capital Region completion rates.
In the case of Indigenous employees, the evaluation found that across the Public Service, Indigenous representation within the executive cadre tends to be below workforce availability levels. INAC has taken steps to encourage Indigenous representation in executive levels across the Department with targeted Indigenous leadership development initiatives, which data shows have yielded some positive impact on participant's upward mobility. Although these initiatives are in place, Indigenous learning and development continue to face challenges.
7.1.3 Retention
It is also equally important to note that the benefits of employee development are many, including employee retention. Employees have many options available to them including transferring to another organization if they are not satisfied. Further, the availability of promotion and career development opportunities within the Department is not only linked to retention outcomes but also to development initiatives.
According to INAC's Corporate Human Resources Plan 2014–2020 it is important to retain "sufficiently qualified, experienced and representative employees" to encourage the proper functioning of day to day activities and program delivery and retention. This has remained a critical component of INAC's activities during the period covered by the evaluation. While this may be the case, the data shows that the departure trend in INAC is more than twice the size of entries into the Department, something that can be attributed to different factors. This situation, as the evaluation has found, necessitates a continued need for INAC to identify and deliver activities that aim at retaining an experienced, qualified and representative workforce.
In INAC's regions, the Department's risk trend analysis done in support of this evaluation noted the risk that "regions will not be able to retain experienced employees (due to turnover, decreased morale, lack of training)," a key area of concern that is associated with a high risk. In addition, there has been a reduction in overall satisfaction, which is observable in comparable departments and the public service as a whole; however the decline has been slightly greater at INAC.
In Indigenous employee retention, the situation is similar, showing that in 2014–15, for example, Indigenous departures were more than four times higher than Indigenous entries into INAC. Despite this trend, as the report shows, the departure data for Indigenous employees indicates that INAC has been successful at retaining Indigenous employees given the general decline in the size of the Department's workforce.
Overall, the evaluation concludes that the management of human resources is a priority area of the federal government. Within INAC, is a key organizational leader that partners with other executives to work cross-functionally to integrate objectives into how business gets conducted within the Department. Documents reviewed and interviews have shown that the issues, concerns, and priorities of are regularly discussed at -related Executive Committee meetings to ensure that objectives support the business goals of the Department.
The evaluation indicates that while there is a need for more resources for the function (coupled with required training and support for non- senior and middle managers), ongoing efforts by the function will help position it for enhanced levels of client service, to clarify roles and responsibilities, and to provide guidance and advisory services relating to management-owned processes.
Appendix A: Key Informant Interview Methodology
In April 2015, EPMRB invited directors, managers, and human resources personnel across the department to participate in a series of focus groups, key informant interviews and site visits. Invitations were sent to all thirteen sectors at National Headquarters, the ten regional offices, and the three Service Centres.Footnote 122
Management Group Interviews
Directors and managers of programs and services outside of the Human Resources and Workplace Service Branch (HRWSB) were invited to participate in sector focus group sessions, facilitated by EPMRB evaluators. Heads of Business Management Units in each sector were also invited to attend these sessions. At Headquarters, focus groups were held with eleven of the twelve non- sectorsFootnote 123, with a total of 55 directors, managers and BMU experts participating. Focus group size ranged from three to ten participants, with an average of five participants per focus group.
In the regions, evaluators engaged approximately 60 employees through focus groups and interviews. Six facilitated focus groups were held across four regions (BC, Ontario, Yukon, and Quebec) with management participants outside of HRWSB. For other regions, facilitated focus groups could not be scheduled due to the limited availability of staff members during the summer months. To accommodate this challenge, evaluators solicited responses to focus group questions from directors, managers and regional advisorsFootnote 124 by other means, including email, teleconference, and telephone; EPMRB received feedback from a total of 36 regional respondents using these various methods.
Key Informant Interviews
Qualitative data was collected from HRWSB through 15 key informant interviews with HRWSB staff. Key informants included the Director General of HRWSB, and Branch directors, managers, and advisors.
In the regions, evaluators held key informant interviews with Regional Directors Generals and Regional Advisors. A total of twelve key informants were interviews from five regions (Quebec, British Columbia, Alberta, Northwest Territories and Nunavut). To accommodate participants, interviews were held by phone and teleconference. In other regions where a formal interview could not be scheduled due to time constraints and participant availability, key informants were sent the key informant interview guide electronically so that they could respond to and submit comments to EPMRB.
Site Visits
Site visits to each of the three Service Centres were conducted between March and April, 2015. During each site visit, key informant interviews were held with the Regional Director of Services and evaluators facilitated focus groups with advisors and assistants. In total, 23 informants participated in the facilitated sessions. In the Western-Yukon Service Centre, one focus group with 6 participants and one joint key informant interview with two informants were held. In the Central-NWT Service Centre, one focus group with five participants and three key informant interviews were conducted. In the Eastern-Nunavut Service Centre, two focus groups were facilitated with a total of six participants.
External Consultation
EPMRB consulted with the Public Service Commission in order to inform the evaluation and provide a whole of government perspective on recruitment, development and retention activities, policies and best practices.
Appendix B: Data Analysis of Public Service Employee Survey Methodology
In support of the Evaluation of Recruitment, Development and Retention Activities, Statistics Canada was commissioned by INAC's Evaluation, Performance Measurement and Review Branch to provide a detailed statistical analysis of INAC's Public Service Employment Survey (PSES) results from the years 2008, 2011, and 2014.
About the Public Service Employee Survey
The PSES has been conducted every three years since it was introduced in 1999. The survey is designed to gain insight into the views of federal public servants on workplace, workforce and leadership. The survey helps Departments in the federal public service to identify areas where they are performing well and to identify opportunities for improvement. The results of the PSES are designed to provide context for conversations about key personnel management issues.
The survey employs a cross-sectional census design where data is collected from the entire public service population with a total of 93 departments participating. Participation in the PSES is voluntary; and no sampling is employed.Footnote 125
Statistics Canada Comparative Analysis Design
As commissioned by INAC, Statistics Canada compared INAC's results on a selection of questions related to recruitment, development and retention. The questions used to compare performance in the areas of recruitment, development, and retention are listed in Table 9.
Five departments were selected for comparison to INAC: Health Canada; Agriculture Canada; Transport Canada; Industry Canada; and Natural Resources Canada. These departments were selected because they have a similar number of employees; similar budget size; similar proportion of grants and contributions spending relative to direct spending; and a similar organizational structure, using both regional offices and headquarters to deliver their services. Footnote 126
Statistics Canada also compared INAC's results across the three time periods and to the mean results of the PSES across all participating 93 departments.
Table 9: Included Questions - Statistical Analysis of the Public Service Employee Survey in Support of INAC's Evaluation of Recruitment, Development and Retention
| Recruitment Indicators | Development Indicators | Retention Indicators |
|---|---|---|
|
|
|
| 2011 - 12 | 2012 - 13 | 2013 - 14 | 2014 - 15Footnote 128 | |
|---|---|---|---|---|
| Aboriginal Affairs and Northern Development Canada | ||||
| Population (number of full time equivalents) | 5,409 | 4,975 | 4,857 | 4,703 |
| Actual Expenditures | 7,146,655,000 | 7,919,979,000 | 7,150,422,000 | 8,053,975,405 |
| Grants and Contributions | 6,371,858,000 | 6,811,078,000 | 7,011,939,000 | 6,654,152,734 |
| Organizational Structure | Headquarters: Ottawa |
|||
| Health Canada | ||||
| Population | 10,588 | 9,701 | 9,341 | 9,081 |
| Actual Expenditures | 3,920,279,000 | 3,782,097,000 | 3,945,992,000 | 3,657,312,088 |
| Grants and Contributions | 1,536,543,000 | 1,520,090,000 | 1,660,584,000 | 1,683,745,108 |
| Organizational Structure | Headquarters: Ottawa |
|||
| Agriculture Canada | ||||
| Population | 6,644 | 5,991 | 5,291 | 5,036 |
| Actual Expenditures | 2,621,857,000 | 2,778,550,000 | 2,472,847,000 | 2,253,196,812 |
| Grants and Contributions | 459,143,000 | 632,129,000 | 447,925,000 | 365,352,000 |
| Organizational Structure | Headquarters: Ottawa |
|||
| Transport Canada | ||||
| Population | 5,370 | 4,778 | 4,771 | 5,222 |
| Actual Expenditures | 1,551,684,000 | 1,608,961,000 | 1,530,246,000 | 1,655,682,494 |
| Grants and Contributions | 782,882,000 | 1,251,941,000 | 619,721,000 | 757,956,898 |
| Organizational Structure | Headquarters: Ottawa Regional Offices: (7) Pacific, Prairie and Northern, Ontario, Quebec and Atlantic |
|||
| Industry CanadaFootnote 129 | ||||
| Population | 5,233 | 4,773 | 4,711 | 4,713 |
| Actual Expenditures | 1,522,000,000 | 1,147,708,000 | 1,115,475,464 | 1,077,743,513 |
| Grants and Contributions | 973,039,997 | 881,985,667 | 661,151,646 | 757,956,898 |
| Organizational Structure | Headquarters: Ottawa Regional Offices: (7) Western, Saskatchewan, Interior British Columbia and Yukon, Coastal British Columbia, Quebec, Eastern Quebec, Atlantic, and Ontario Region |
|||
| Natural Resources Canada | ||||
| Population | 4,659 | 4,361 | 4,231 | 3,902 |
| Actual Expenditures | 3,460,364,000 | 1,963,879,000 | 2,050,897,000 | 2,534,650,611 |
| Grants and Contributions | 1,716,488,000 | 742,019,000 | 608,828,000 | 444,039,000 |
| Organizational Structure | Headquarters: Ottawa Regional Offices: (13) Newfoundland and Labrador, PEI, Nova Scotia, New Brunswick, Quebec, Ontario, Manitoba, Saskatchewan, Alberta, British Columbia, Northwest Territories, Yukon, Nunavut |
|||
Table 11: Employee Characteristics Included in Statistics Canada Analysis
| Occupation Group |
|
|---|---|
| Occupational Level |
|
| Region |
|
| Employee Status |
|
| Years of Service |
|
| First Official Language |
|
| Age Cohort |
|
| Sex |
|
| Aboriginal Status |
|
Statistics Canada Analysis Methods
Statistics Canada determined the difference between mean results of INAC across time, between INAC and the general public service, and compared INAC's performance relative to the five selected comparable departments.
Where there was a difference in mean results between comparisons groups, researchers performed a univariate regression analysis to determine whether differences in mean results between comparison groups were statistically significant.
When differences between mean results were observed, multivariate regressions were performed to determine the relative impact of each variable (i.e., age cohort, gender, employment status, etc.) on the change in mean results. Employee characteristics included for multivariate regression analysis are listed in Table 11. EPMRB focused on the results of multiple regressions determining the impact of employee status, region, and Indigenous status for the purpose of the Evaluation of Recruitment, Development and Retention Activities.
Results Selection
Statistics Canada prepared a results table highlighting questions where the difference between INAC's affirmative responses differed from those in comparison groups by more than five percentage points. Results are presented in Table 12 and Figure 17. For the purpose of the evaluation scope, EPMRB modified the results table produced by Statistic Canada to reflect the response results of indeterminate staff only for INAC, comparable departments, and the whole public service.
| Difference Between INAC and Comparable Departments, Indeterminate Employees, 2014 | Difference in % Points | ||
|---|---|---|---|
| Recruitment Related | 2014 | 2011 | 2008 |
| My job is a good fit with my skills | -1.7% | -0.8% | 0.5% |
| In my work unit, I believe that we hire people who can do the job. | -6.3% | -3.3% | -1.0% |
| In my work unit, the process of selecting a person for a position is done fairly. | -3.7% | -3.5% | -2.6% |
| Development Related Questions: | |||
| I get the training I need to do my job | -3.1% | -0.1% | -2.5% |
| In my work unit, unsatisfactory employee performance is managed effectively. | -4.7% | 0.0% | 0.0% |
| I receive useful feedback from my immediate supervisor on my job performance. | -3.4% | -1.3% | 2.2% |
| My immediate supervisor assesses my work against identified goals and objectives. | -1.6% | 1.9% | 4.8% |
| I receive the support I need from senior management to address unsatisfactory performance issues in my work unit. (Question asked only to supervisors) | -7.5% | 0.0% | 0.0% |
| My department or agency does a good job of supporting employee career development. | 0.3% | 5.6% | 2.5% |
| I believe I have opportunities for promotion within my department or agency, given my education, skills and experience. | 0.0% | 6.9% | 8.2% |
| Retention Related Questions: | |||
| I have support at work to balance my work and personal life. | -7.7% | -4.0% | -1.6% |
| I receive meaningful recognition for work well done. | -4.0% | 1.3% | 0.0% |
| I am proud of the work that I do. | -2.4% | 0.6% | 0.0% |
| Overall, I like my job. | -5.3% | -1.2% | 0.6% |
| I feel that the quality of my work suffers because of… high staff turnover. | 13.2% | 11.3% | 11.8% |
| I have positive working relationships with my co-workers. | -1.3% | 0.1% | 0.0% |
| I believe that senior management will try to resolve concerns raised in this survey. | -5.4% | 5.2% | 3.9% |
| I feel I can initiate a formal recourse process (e.g., grievance, complaint, appeal) without fear of reprisal. | -8.5% | -2.9% | -3.6% |
| Overall, my department or agency treats me with respect. | -7.6% | 0.4% | 1.5% |
| I would recommend my department or agency as a great place to work. | -12.2% | -3.2% | 0.0% |
| I am satisfied with my department or agency. | -10.4% | -1.3% | -0.2% |
| I would prefer to remain with my department or agency, even if a comparable job was available elsewhere in the federal public service. | -9.9% | -3.3% | -1.4% |
| Do you intend to leave your current position in the next two years? | 10.5% | 7.1% | 0.0% |
| I am satisfied with how matters related to harassment are resolved in my department or agency. | -11.7% | -2.8% | -4.2% |
| I am satisfied with how matters related to discrimination are resolved in my department or agency. | -10.7% | ||
| I am satisfied with the measures that were taken to accommodate my needs. | -9.6% | ||
Figure 17: INAC's Public Service Employee Survey Results Differential – INAC vs. Comparison Groups, 2014

Text alternative for Figure 17: INAC's Public Service Employee Survey Results Differential – INAC vs. Comparison Groups, 2014
This bar graph visualizes the difference in percentage points between INAC’s 2014 Public Service Employment Service results and those of comparable departments for indeterminate employees. In general, the visual shows that INAC reported lower levels of "agreement" for the majority of PSES survey questions than comparable departments in 2014.
The percentage point differential between INAC and comparable departments in 2014, 2011 and 2008 for all 26 questions are:
I am satisfied with the measures that were taken to accommodate my needs. -9.6%
I am satisfied with how matters related to discrimination are resolved in my department or agency. -10.7%
I am satisfied with how matters related to harassment are resolved in my department or agency. -11.7%
Do you intend to leave your current position in the next two years? 10.5%
I would prefer to remain with my department or agency, even if a comparable job was available… -9.9%
I am satisfied with my department or agency. -10.4%
I would recommend my department or agency as a great place to work. -12.2%
Overall, my department or agency treats me with respect. -7.6%
I feel I can initiate a formal recourse process (e.g., grievance, complaint, appear) without fear of… -8.5%
I believe that senior management will try to resolve concerns raised in this survey. -5.4%
I have positive working relationships with my co-workers. -1.3%
I feel that the quality of my work suffers because of… high staff turnover. 13.2%
Overall, I like my job. -5.3%
I am proud of the work that I do. -2.4%
I receive meaningful recognition for work well done. -4.0%
I have support at work to balance my work and personal life. -7.7%
I believe I have opportunities for promotion within my department or agency, given my education,… -0.0%
My department or agency does a good job of supporting employee career development. -0.3%
I receive the support I need from senior management to address unsatisfactory performance issues… -7.5%
My immediate supervisor assesses my work against identified goals and objectives. -1.6%
I receive useful feedback from my immediate supervisor on my job performance. -3.4%
In my work unit, unsatisfactory employee performance is managed effectively. -4.7%
I get the training I need to do my job. -3.1%
In my work unit, the process of selecting a person for a position is done fairly. -3.7%
In my work unit, I believe that we hire people who can do the job. -6.3%
My job is a good fit with my skills. -1.7%
Appendix C: Average Number of Days to Staff Positions
| Type of Staffing Action | 2010 - 2011 | 2011 - 2012 | 2012 - 2013 | 2013 - 2014 | 2014 - 2015 | 2015 - 2016* |
|---|---|---|---|---|---|---|
| TEMPORARY | ||||||
| Acting < 4 Months | 13 | 4 | 5 | 9 | 5 | 12 |
| Assignment | 38 | 22 | 37 | 8 | 7 | 14 |
| Casual | 17 | 5 | 19 | 8 | 4 | 5 |
| NA Deployment | 15 | 7 | 35 | 6 | 8 | 8 |
| Secondment | 17 | 13 | 10 | 9 | 10 | 12 |
| Students - COOP | 16 | 19 | 12 | 3 | 3 | 5 |
| Students - Federal Student Work Experience Program | 30 | 20 | 14 | 6 | 3 | 5 |
| Students - OTHER | 37 | 0 | 189 | 2 | 0 | 0 |
| Term Extension | 43 | 8 | 60 | 18 | 7 | 14 |
| Acting > 4 Months | 44 | 40 | 51 | 32 | 40 | 29 |
| EXTERNAL | ||||||
|---|---|---|---|---|---|---|
| External Advertised Collective – Initial | 94 | 96 | 101 | 34 | 90 | 135 |
| External Advertised Collective – Subsequent | 79 | 25 | 68 | 68 | 54 | 32 |
| External Advertised-Initial | 48 | 87 | 80 | 59 | 93 | 49 |
| External Advertised-Subsequent | 81 | 52 | 87 | 33 | 51 | 28 |
| External Non-Advertised | 43 | 58 | 61 | 22 | 4 | 15 |
| INTERNAL | ||||||
|---|---|---|---|---|---|---|
| Internal/Special Assignment Pay Pro (SAPP) - Pre-Ret | 30 | 26 | 0 | 0 | 0 | 0 |
| Internal Advertised Collective - Subsequent | 39 | 32 | 40 | 39 | 34 | 84 |
| Internal Advertised Collective – Initial | 105 | 157 | 217 | 92 | 107 | 44 |
| Internal Advertised-Initial | 114 | 153 | 109 | 79 | 91 | 101 |
| Internal Advertised-Subsequent | 88 | 62 | 62 | 56 | 35 | 52 |
| Internal Non-Advertised | 83 | 55 | 180 | 19 | 33 | 22 |
| OTHER | ||||||
|---|---|---|---|---|---|---|
| Priorities | 62 | 41 | 43 | 54 | 46 | 48 |
| Reclassification | 55 | 133 | 65 | 69 | 41 | 16 |
| Corrective Actions | 0 | 18 | 1 | 0 | 12 | 0 |
| Overall Average | 52.9 | 55.6 | 65.1 | 35.5 | 37.5 | 33.5 |
Appendix D: Indigenous and Northern Affairs Human Resources Risk Analysis
1.0 Purpose
The purpose of the analysis is to track INAC's human resources (HR) risks at the program, region, and corporate levels, and to identify key business conditions (also known as risk drivers) that contribute to the likelihood and impact of these risks occurring. This analysis was conducted in conjunction with 2015 Evaluation of Recruitment, Retention and Development Activities; and, while the scope of this analysis was not focused specifically on INAC's recruitment, development and retentions activities, a number of key findings are directly related to these three themes. This analysis supports future risk assessments, audits, and program and services evaluations.
2.0 Methodology
The analysis of INAC's departmental risks was conducted in conjunction with the 2015 Evaluation of Recruitment, Retention and Development performed by Evaluation, Performance Measurement and Review Branch (EPMRB). The analysis examined the risks and contributing business conditions presented in program risk assessments, one sector risk profile (Northern Affairs Organization Sector) and regional and corporate developed between 2010-11 and 2014-2015 inclusively. In total, twenty-four programsFootnote 131, one sector and ten regions were included in the analysis, as well as INAC's most recent five corporate risk profiles.
Risk ratings presented in the analysis reflect the standardized risk scales used in the department to assess the level of a certain risk as low, moderate, high and extremeFootnote 132 Footnote 133. "Key" business conditions and risks are defined as statements appearing three times or more in the risk assessments at the program and regional level. Business conditions at the corporate level are considered "key" if they were identified in at least two of the last five corporate risk profiles, including the most recent Corporate Risk Profile developed in 2014. "Common" business conditions and risks are key risk statements and business conditions that exist across program, regional, and corporate risk profiles.
2.1 Considerations and Limitations
The main limitation of this analysis was the lack of readily available risk mitigation information and results at the time EPMRB evaluation (between September, 2014 and December, 2015). A number of program and regional risk profiles were missing mitigation strategies and departmental policy does not require programs to track the results of past risk mitigation strategies. In addition, the departmental requirement of each program to include risk information and mitigation strategies for its top three to five risks in its performance measurement strategy did not come into effect until 2014Footnote 134. Therefore, a number of programs had not yet implemented the requirement at the time this analysis was completed (August, 2015).
A second limitation was that not all programs were captured in the analysis of human resources risks at the program level due to the absence of risk assessments completed by certain program areas. With the support of the Audit and Evaluation Sector, all programs are in the progress of updating performance measurement strategies to include risk analyses. This effort will address the current gaps in program risk information.
A third limitation of this analysis is that it does not examine human resources risks at the branch or sector level. Currently, branches and sectors are encouraged, but not required, to complete a risk assessment; therefore risk information at these levels is minimal. The Northern Affairs Organization is the only sector that had developed a sector risk profile at the time this analysis was completed, although a risk profile for Resolution and Individual Affairs Sector was in development. The Northern Affairs Organization Sector risk profile was reviewed as part of the section of this analysis specific to the northern perspective.
It is important to take into consideration that all risk assessments and profiles at INAC are developed through the use of qualitative data collection, including key informant interviews and facilitated focus groups and workshops. As such, risk documentation reviewed for this analysis capture the opinions of key informants concerning both real and perceived risks to achieving departmental objectives, and findings cannot control for individual biases.
3.0 Findings
Key findings of the analysis focus on the key risks that exist throughout the Department and the business conditions that contribute to each risk. To ensure the risks specific to each level were appropriately captured, key risks of the past five years were tracked across programs (Section 3.1), regions (Section 3.2), and at the corporate level (Section 3.3). Common risks being managed at all levels of the Department are discussed in Section 3.4.
3.1 Human Resources Risks at the Program Level
All INAC programs are required to develop and maintain program risk assessments that will inform program activities, planning, performance measurement, and program renewalFootnote 135. Overall, risk assessments were conducted covering twenty-four INAC programs from 2010 to 2014, inclusively. Of the risk statements assessed by each program, sixty-six percent were rated as high risks, twenty-two percent as moderate, and eleven percent as low.Footnote 136 The number of human resources risks identified varied by program from none to seven. Risk ratings varied depending on the program area, with some programs assessing risks at a higher level than others. For example, it was found that programs under The People and The Government strategic outcomes assessed all risks in the category as high, while programs under The North and The Land and Economy strategic outcomes assessed risks as ranging from low to high. At the program level, five key risks were identified by three or more programs. Table 14 presents each of the key program risks and their respective risk rating.
| Human Resources Risks | Number of Programs Identifying Risks | Percentage of Programs | Average Assessment Rating |
|---|---|---|---|
Key Risk #1 |
11 | 46% | Voting Result: Moderate |
Key Risk #2 |
7 | 29% | Voting Result: High |
Key Risk #3 |
7 | 29% | Voting Result: Moderate |
Key Risk #4 |
4 | 17% | Voting Result: Moderate-High |
Key Risk #5 |
4 | 17% | Voting Result: Low-Moderate |
The three most common risks identified by programs were i) the risk that programs did not have the required skills/technical expertise among staff to effectively administer the program (forty-six percent of programs), ii) the risk that the program will have an insufficient level of human resources to maintain current level of service delivery or meet program objectives (twenty-nine percent of programs), and iii) the risk that the program will be unable to retain staff (twenty-nine percent of programs). Each of these risks was consistently assessed as a moderate or high risk, ratings which require monitoring by program senior management and, for high risks, the development of mitigation strategies. Seventeen percent of programs also identified the risk that insufficient knowledge transfer will lead to a decrease in the capacity of program employees as being a moderate to high risk. The risk that the program will be unable to attract and/or hire staff with the right skills in a timely manner was also identified by seventeen percent of programs, although this risk was rated as a low to moderate risk to be monitored through routine program administration.
The analysis of program risk profiles determined 10 key business conditions identified by three or more programs that contribute to the existence, likelihood and impact of each program risk. Many of the key business conditions contribute to multiple risks. Table 15 displays the alignment of each key business conditions with the appropriate key risks.
| Business Conditions | Number of Programs Identifying Business Conditions | Percentage of Programs | Alignment with Key Human Resources Risks |
|---|---|---|---|
| High turnover and anticipated retirements in the department negatively impacts the retention of corporate knowledge and program stability | 12 | 50% | Key Risk #1 Key Risk #4 |
| There is a need for specific skills sets and technical expertise in certain programs and regions. The use of priority lists and general statements of merit criteria is insufficient for areas needing specialized skills, and a lack of resources to train new staff limits the ability of programs to hire and develop qualified staff. | 9 | 38% | Key Risk #1 Key Risk #5 |
| Government cutbacks (DRAP) and operational freezes on O&M, travel and staffing make it difficult to fill vacant positions in a timely manner and deliver on program objectives, particularly in small programs | 8 | 33% | Key Risk #1 Key Risk #2 Key Risk #5 |
| Human resources are not always appropriately aligned or used in a way that ensures program objectives are met (for example, some program staff are performing functions outside of their program's mandate) | 7 | 29% | Key Risk #2 |
| There is a lack of training and capacity building for new staff in some program areas | 7 | 29% | Key Risk #1 Key Risk #3 Key Risk #4 |
| Hiring processes are lengthy and complex, often resulting in losing candidates to other organizations or hiring competitions | 5 | 21% | Key Risk #2 Key Risk #5 |
| Support from the central function has been reduced; much the of hiring process has been delegated to managers who now have a reduced capacity to meet operational and staffing requirements | 5 | 21% | Key Risk #2 Key Risk #5 |
| The re-organization of some program areas (CIB, NAO) contributes to the loss of corporate knowledge and program stability | 5 | 21% | Key Risk #1 Key Risk #4 |
| Dependencies on temporary/ term positions lead to difficulty attracting and retaining employees and can create barriers to retaining corporate knowledge | 4 | 17% | Key Risk #3 Key Risk #4 |
| A lack of succession planning and resources dedicated to retaining corporate knowledge is an ongoing issue. This issue is exacerbated by the number of anticipated retirements among experienced staff | 4 | 17% | Key Risk #1 Key Risk #4 |
Turnover and anticipated vacancies, such as the number of employees who are eligible for retirement, was the most common business condition contributing to program risks. Fifty percent of programs stated that turnover significantly impacted their ability to maintain corporate knowledge or was a challenge to the retention of program staff's technical skills and capacity to achieve program objectives. Thirty-eight percent of programs also identified the need for specific skill sets and technical expertise as contributing to their risks of being unable to attract and hire qualified staff, and to deliver quality services. Supplementary commentary provided in some program risk profiles noted that use of general statements of merit and the requirement of recruiting employees from priority lists and established pools limits their ability to hire individuals with the technical expertise required to carry out program activities. Training and capacity building for new employees was identified by twenty-nine percent of programs as contributing to the risks that programs will not be able to retain and attract qualified staff and that staff may not have the required skill sets to effectively administer programs. However, twenty-nine percent of programs also stated that improved alignment and use of available human resources and individuals' capacity would enhance program efficiency and effectiveness.
Thirty-three percent of programs stated government cut back initiatives such as the Deficit Reduction Action Plan and freezes to operational budgets and A-base funding made it difficult to fill key vacant positions and gaps in technical expertise in a timely manner. Limited A-base funding can also result in programs depending on temporary positions. Seventeen percent of programs identified this dependency as a major barrier to attracting and retaining qualified employees and maintaining corporate knowledge.
According to seventeen percent of programs, the risk of insufficient knowledge transfer is also driven by the lack of resources allocated to retaining corporate knowledge. Seventeen percent of programs stated that succession planning is often inadequate and some programs have no succession planning mechanisms in place. This business condition may be exacerbated by the number of anticipated retirements among experienced staff. Twenty-one percent of programs, primarily within the Community Infrastructure Branch and Northern Affairs Organization sector, indicated that sector re-organization and major program changes contributed to program instability and the loss of corporate knowledge.
In 2012-2013, INAC's function and hiring processes underwent major changes as a result of Deficit Reduction Action Plan. A number of functions related to hiring processes were delegated to managers and support from the corporate Human Resources and Support Services Branch was reducedFootnote 137. Due to the learning curve of associated with these this administrative functions, the capacity of managers to focus on operational requirements was negatively impacted. Twenty-one percent of program risk profiles reported that the delegation of hiring responsibilities to managers and the length and complexity of the hiring process significantly contributed to program risk of being unable to hire qualified employees and the risk of having insufficient human resources to carry out their mandate. In some cases, delays in the hiring process may have resulted in losing candidates to other organizations or competitive processes (noted by twenty-one percent of programs).
3.2 Risk at the Regional Level
INAC regions required to develop and maintain a regional risk profile. All ten regions completed risk assessments between 2010 and 2014 inclusively. Overall, seventeen percent of regional risks that were taken to the assessment phase of the risk cycle were rated as being moderate, seventy-five percent were rated as high, and eight percent were rated as extreme. Only three regions assessed one or more risks as moderate, with only one region (Quebec) rating no risks above the moderate level. The number of risks identified in each region varied from one to five.
| Human Resources Risks | Number of Regions Identifying Risks | Percentage of Regions | Average Assessment Result |
|---|---|---|---|
Key Risk #1 |
5 | 50% | Voting Result: High-Extreme |
Key Risk #2 |
5 | 50% | Voting Result: High |
Key Risk #3 |
4 | 40% | Voting Result: High |
Key Risk #4 |
3 | 30% | Voting Result: High |
Key Risk #5 |
3 | 30% | Voting Result: High |
All key risks identified by three or more regions were assessed as high, and therefore require monitoring by senior program management and the development of mitigation strategies. Of the four regions that identified Key Risk #1, two assessed this risk as extreme, a level that requires close monitoring by senior management and reporting on the risk to department executive, including Operation Committee and the Deputy MinisterFootnote 138.
The three most common risks identified by regions were i) the risk that the region did not have the financial and human capacity to meet workload demands and fulfill its mandate (fifty percent of regions); ii) the risk that regional staff do not have the right skills or experience to carry out regional obligations (fifty percent of regions); and iii) the risk that the region will not be able to attract, recruit and retain sufficiently qualified, experienced and representative human resources in a timely manner (40 percent of regions)Footnote 139.
Thirty percent of regions identified the risk that the region will not be able to retain experienced employees. Supplementary commentary provided in these risk profiles indicated this risk was a result of high turnover, decreased employee morale due to increased workloads, and/or a lack of employee training. Thirty percent of regions also indicated that there is a risk that the region does not effectively train employees for assignment roles, either due to a lack of capacity or inadequate use of internal development tools.
The analysis of regional risk profiles revealed 12 key business conditions contributing to the existence, likelihood and impact of risks. Table 17 presents the key business conditions identified by three or more regions and aligns each business condition with the key regional risks.
| Business Conditions | Number of Regions Identifying Business Conditions | Percentage of Regions | Alignment with Key Human Resources Risks |
|---|---|---|---|
| Hiring processes are lengthy and complex, in some regions resulting in losing candidates to other hiring competitions | 9 | 100% | Key Risk #1 Key Risk #2 |
| Changes to the Human Resources Function: There are concerns that the implementation the Human Resources Service Centres will result in service gaps, and that that managers are not prepared for their additional responsibilities |
8 | 89% | Key Risk #1 Key Risk #2 Key Risk #3 |
| High turnover and anticipated retirements in the department negatively impacts the retention of corporate knowledge. | 8 | 89% | Key Risk #3 Key Risk #4 Key Risk #5 |
| Formal succession planning is lacking or is not a priority in the region | 8 | 89% | Key Risk #4 Key Risk #5 |
| DRAP and the resulting increase in workload pressures on employees and decrease in workplace moral | 6 | 67% | Key Risk #1 Key Risk #3 Key Risk #4 |
| Employees are not provided with effective training | 6 | 67% | Key Risk #2 Key Risk #3 Key Risk #4 |
| There is a need in the region for specialized and technical skill sets | 6 | 67% | Key Risk #2 Key Risk #3 |
| There are salary funding shortfalls in the region and managers are unable to backfill departing staff | 5 | 55% | Key Risk #1 Key Risk # |
| The department is competing with the private sector and other levels of government for qualified candidates. | 5 | 55% | Key Risk #1 Key Risk #3 Key Risk #4 |
| There is reduced mobility and limited career advancement due to fiscal restraint and not enough classification levels in the region. This makes it difficult to attract and retain staff | 3 | 33% | Key Risk #3 Key Risk #4 |
| Regional employees face challenging work conditions, often contending with litigation, media scrutiny, complex of issues, and a high workload. | 3 | 33% | Key Risk #3 Key Risk #4 |
The length and complexity of the hiring process was most common business condition, identified in all of regional risks profiles. The hiring process negatively impacts the capacity of regions to meet workload demands in order to fulfill their mandates (key risk #1), and the ability to attract and recruit qualified staff in a timely manner (key risk #3). This business condition may also lead to a region not having the right skills or experience among staff members to effectively carry out regional obligations (key risk #2). According to forty-four percent of regions, hiring processes are further delayed by government requirements such as advertising positions externally and utilizing staffing pools to fill vacancies. A couple of regions also noted that using staffing pools does not always result in the selection of the candidate who is the "best fit" for the position.
Eighty-nine percent of regions identified changes to the corporate function (including the transition to service centres), high turnover, and a lack of effective formal succession planning as challenging business conditions that contribute to a number of risks.Footnote 141 As previously noted, changes to the corporate function in the Department implemented in 2012-2013 included tasking managers in regional offices with additional responsibilities during hiring processes. There is concern among regions that managers were not properly trained prior to the expansion of their role to include these additional responsibilities. In addition, three service centres were established for eastern, central and western regions of the country to provide services previously provided by full time equivalents within regional officesFootnote 142. Regions indicated that there was insufficient time and resources allocated to transitioning to the service centre model, and as a result, there may be gaps in service delivery to regions. The implemented changes also contribute to the lengthy hiring process and impact the department's ability to attract and recruit qualified staff in a timely manner (key risk #3). This business condition is also linked to key risks #1(capacity to meet workload demands) and #2 (staff with right skills and experience) because managers may not have received proper training on the hiring process and their additional responsibilities may distract from effectively fulfilling operational duties.
High turnover throughout the department and anticipated vacancies due to the number of upcoming eligible retirements also contribute to risk of being unable to attract, recruit qualified human resources (key risk #3). This risk is increased by a lack of effective succession planning in most regions. Together, these business conditions may lead to the loss of corporate knowledge and further increase the likelihood of being able to retain staff (key risk #4). Similarly, sixty-seven percent of regions stated that employees are currently not provided with effective training, indicating that the risk that employees in the regions are not being effectively trained (key risk #5) has already materialized in some regions. This business condition also contributes to the risk of being unable to attract and recruit staff (key risk #3) and being able to retain staff (key risk #4) because employees are not being offered opportunities for training and career development. Thirty-three percent of regions also highlighted that fiscal restraint and an insufficient number of classification levels have resulted in reduced mobility and limited opportunities for career advancement, making it difficult for regions to attract, recruit and retain staff (key risks #3 and 4).
Fifty-five percent of regional risk assessments indicated that regions must compete with the private sector and other levels of government in regions in order to attract recruit and retain qualified and experienced employees, noting that the federal government is not always perceived as an employer of choice. This business condition contributes to the risk of being unable to meet workload demands to fulfill the mandate and being unable to attract, recruit and retain staff (key risks #1, 3 and 4).
Fiscal restraint exercised across government significantly contributes to human resources risks in the regions. DRAP resulted in an increase in workload pressure on remaining employees and decreased employee morale across the DepartmentFootnote 143. The effects of DRAP were identified sixty-seven percent of regions as a business condition. Fifty-five percent noted that there are shortfalls in salary funding and managers are unable to backfill positions of departing staff, further increasing workload of employees who remain. Thirty-three of regions highlighted that most regional employees interact directly with clients, funding recipients and the public, and face challenging work conditions such as litigation, media scrutiny and complex local relationships in addition to an increased workload caused by government cutbacks. The challenge of competing with other governments and sectors is also linked to a lack resources allocated to providing effective training to current regional employees, facilitating career development and funding the relocation of successful candidate recruited from outside the region. Business conditions related to fiscal constraint and workload can be linked to all five key risks across regions.
3.2.1 Northern Regional Challenges
The Northwest, Yukon, and Nunavut territories risk statements and drivers aligned with the key risks described in most regions across the country. However, the northern regions also noted unique risk drivers that contributed to the likelihood and impact of these risks occurring.
Northwest Territories region developed the regional risk profile in August 2014 after the devolution of legislative responsibilities to the Government of the Northwest Territories on April 1, 2014. At that time, the region was in the process of redefining its roles and responsibilities, organizational structure and determining what positions and competencies of human resources were required for the region to be responsive to the Northwest Territories Devolution Act. A number of regional staff positions were affected by the devolution, resulting in vacancies and gaps in corporate knowledge in the regional office.
The Yukon Territory risk assessment (2013) noted that the region has an annual turnover rate of twelve to fifteen percent, which drives the risk of being unable to retain qualified staff. Yukon Territory employees also felt that there was a diminished view of the federal government as an employer of choice in the region, and that the region must compete with the territorial government and the private sector for a limited pool of human resources. Regional staff stated that the tightening of the Isolated Post directives and reduced compensation packages made it "challenging to compete in the northern marketplace for limited resources, specifically individuals with specialized training".
The Nunavut Territory regional risk profile (2014) noted numerous factors which significantly contribute to its risks of being unable to attract, recruit and retain qualified staff and the risk of not providing adequate training and opportunities for employee development. Nunavut region identified the following factors contributing to high risks, specifically for recruitment and retention of employees: high competition in the territory for skilled and experienced resources (particularly with CanNor, the territorial government, and industry); regional employees are targeted for recruitment by external agencies; less competitive compensation packaged than other employers; increased mining activity in Nunavut means an increased need for regional capacity for inspections and regulation enforcement; the real and perceived cost of living increase in Nunavut; inherent conditions (i.e. climate, isolation and local culture); the need for young workers to move south to receive required education/training; perception that positions are classified higher with other federal employers in the region; a vacancy rate of 20 percent; and the Nunavut objective of devolution. In addition, Nunavut region must be in compliance with the Nunavut Land Claims Agreement (NCLA), and all employees require a thorough knowledge of the NLCA and uphold its provisions in all activities.
The Nunavut regional risk profile also noted unique challenges to employee development. These challenges included lagging IT system support, cost and lack of employment enabling services (e.g. daycare); limited access to employee training in Iqaluit, specifically access to Canadian Public Service Courses that are not offered online and cultural training for non-Nunacummiut employees.
3.3 Risk at the Corporate Level
Every year, the Department produces its Corporate Risk Profile. The Corporate Risk Profile is a point in time reflection of the most significant risks that threaten achievement of INAC's mandate. Effective management of these corporate risks demonstrates accountability, and will support effective and efficient contributions to strategic outcomes. Senior management is accountable for maintaining current controls and developing and implementing mitigation strategies that address the existing business conditions that contribute to each of the corporate risks. The Corporate Risk Profile and corporate business planning process serve as the primary means of assessing and planning to respond to corporate risks. The Corporate Risk Profile process is facilitated by the Risk Management Centre within the Audit and Evaluation Sector and the annual update of the Corporate Risk Profile is championed and led by the Deputy Minister and the Chief Audit and Evaluation Executive. The results of the Corporate Risk Profile feed directly into the corporate business planning process of the department, explicitly informing the establishment of both priorities and plans.Footnote 144
Each Corporate Risk Profile risk statement is validated by the Assistant Deputy Minister lead of that risk and current business conditions and controls are identified. The corporate risks are assessed by Senior Management Committee and risk mitigation is developed, approved and reported to Operations Committee by assistant deputy ministers or directors general assigned by the Deputy Minister to lead each corporate risk.
The Director General of Human Resources and Workplace Services Branch serves as the Capacity risk leadFootnote 145. Capacity risk has been consistently assessed as one of INAC's highest corporate risks. This risk was assessed by Senior Management Committee as "high" in four of the past five years. In 2013, this risk was assessed as "moderate"; however, its rating was elevated to "high" the following year. Table 18 shows the rating results for the Capacity risk as voted by members of the SMC from 2010 to 2014.
Table 18: Rating of the Corporate Human Resources Capacity Risk Over 5 Years (2010-2014)
| Year | Risk Rating |
|---|---|
| 2010-2011 | High |
| 2011-2012 | High |
| 2012-2013 | High |
| 2013-2014 | Moderate |
| 2014-2015 | High |
Business conditions contributing to corporate level risks often change year over year in response to changes to departmental and government priorities. To ensure this analysis provides an accurate depiction of the most current business conditions driving the Department's Capacity risk, this section focuses on the business conditions that have persisted at the corporate and continue to challenge the timely recruitment, development and retention of qualified, experience and representative human resources. The 11 key business conditions presented in Table 19 were selected because they were identified in two or more corporate risk profiles over the last five years, including the 2014 Corporate Risk Profile.
| Business Conditions | Years Highlighted in the Corporate Risk Profile | ||||
|---|---|---|---|---|---|
| 2010 | 2011 | 2012 | 2013 | 2014 | |
| Length of hiring process | Yes | Yes | Yes | Yes | |
| Location as a challenge to recruitment | Yes | Yes | Yes | Yes | |
| Competition for talent with the private sector and other levels of government | Yes | Yes | Yes | Yes | Yes |
| Number of eligible retirements and high turnover | Yes | Yes | Yes | Yes | |
| Ineffective performance management practices | Yes | Yes | Yes | ||
| Salary envelop freezes and restricted O&M spending | Yes | Yes | Yes | Yes | Yes |
| Human resources planning is not effectively integrated with strategic and operational planning activities | Yes | Yes | Yes | Yes | |
| Effects of organizational transition, including the demands of DRAP/ Responsible expenditure management | Yes | Yes | Yes | Yes | |
| Employee physical security | Yes | Yes | |||
| The implementation of common human resources processes | Yes | Yes | |||
| Reduced mobility and development opportunities for employees in the department and across government | Yes | Yes | Yes | ||
The length of the hiring process has been a consistent business condition negatively impacting the Department's Capacity risk over the past five years, particularly regarding the government's ability to recruit qualified, experienced and representative employees. This business condition was identified in four of the last five corporate risk profiles, the exception being 2012, the year DRAP was introduced and significant human resources cutbacks were implemented across the public service. The corporate risk profiles analyzed noted a number of factors that contributed to the length of the hiring process.
In 2010 and 2013, it was noted that a knowledge gap exists among hiring managers, particularly surrounding hiring administration, and managers may not be receiving adequate support from the departmental function. More responsibility for the hiring process was shifted to hiring managers in 2012-2013, creating a difficult learning curve for which managers may not have been adequately prepared. In 2010, 2011 and 2013, it was also stated that hiring managers may not be aware or effectively making use of available tools to assist in the hiring process, such as pools; however, in the same years, collective hiring process were considered to be time consuming and less effective in the region. The 2013 and 2014 corporate risk profiles noted that the implementation of common processes delay hiring because there are multiple parties involved in the process and hiring managers have less flexibility to hire "best fit" candidates in a timely manner. While the Workforce Management Board has been effective in approving hiring strategies for anticipated vacancies, the Workforce Management Board process has delayed the hiring process for some unforeseen vacancies.
All five corporate risk profiles included in the study indicated that a dispersed location of offices is a key business condition creating a challenge to recruitment and retention. In particular, isolated post such as northern regional offices have difficulty recruiting qualified resources for positions requiring professional and scientific expertise, and as a result these offices sometimes have long-term vacancies. The location of offices also poses a challenge to recruiting qualified Indigenous candidates for position because these candidates may be reluctant to re-locate away from rural communities to the National Capital Region and other city centres.
Competition with the private sector, other federal departments and other levels of government was presented as a risk business condition in all corporate risk profiles analyzed. A number of factors contributing to this business condition include: the negative perception of government as an employer of choice (2010, 2011 corporate risk profiles); pay scales of the federal public service compared to the private sector (2010, 2011, 2013 corporate risk profiles); and a high demand for qualified Indigenous staff creates a challenge to recruiting and retaining a representative work force and meeting Indigenous hiring targets. The length of the hiring process may impact this business condition, as it contributed to the negative perception of government hiring practices, and the department may be losing candidates to competitors as they wait for their letter of offer.
High turnover in the Department was considered a key risk business condition highlighted in multiple corporate risk profiles. In 2010, 2011, and 2013, it appears that the number of employees eligible for retirement was the main concern regarding turnover. Although the number of eligible retirements was not highlighted as a risk business condition in 2014, the department's ability to plan and recruit to fill vacancies caused by turnover is an ongoing challenge.
The Department's corporate risk was significantly impacted by the effects of organizational transition from 2011 to 2014. Major organizational change initiatives were undertaken over the time period covered in the study (fiscal years 2010 to 2014), including the DRAP and Responsible Expenditure Management efforts, territorial devolution, and program and sector restructuring activities. These changes also included the implementation of common and centralized practices and salary envelop freezes, which were deemed so significant that they were identified as separate risk business conditions in the corporate risk profiles analyzed and will be discussed later in the document.
The effects of organizational transition identified in corporate risk profiles included: human resources that would otherwise be spent on hiring, employee wellness and training were consumed by transition activities (2011, 2012 corporate risk profiles); organizational change creates a challenge to determining what skill sets will be required post-transition and to plan recruitment and retention accordingly (2011, 2013); there is often a loss of specialized skill sets (2012, 2013); and there are negative impacts to employee wellness, morale, productivity, and mentoring activities, especially when transition results in loss human resources (2012, 2013, 2014). The devolution of the Northwest Territories Region to the territorial government also created vacancies and the perception of instability in the regional office resulting in further challenges to recruitment. In the future, this factor may increase the risk of retaining staff in the Nunavut regional office as the territory moves toward devolution. In addition, in both 2012 and 2014, it was noted that absenteeism may be increasing, in part due the effects of transition on employee wellness.
Transition exercises resulted in the introduction of salary envelop freezes and limitations on O&M spending. This effect was identified as a key risk business condition in all corporate risk profiles analyzed. Restrictions on available A-base funding challenge the department's ability to recruit and retain qualified and experienced employees to address skill and knowledge shortages caused by organizational transition and turnover. This also puts pressure on remaining employees to do more with fewer resources in order to full departmental obligations. As a result, managers are turning to less costly hiring alternatives, in some cases relying on term hires. However, it is difficult to recruit for temporary position and reliance on these positions can lead to less stability in program and service delivery, and difficulty retaining corporate knowledge.
The implementation of common processes was highlighted as a key business condition contributing the Department's Capacity risk in the 2013 and 2014 corporate risk profiles. As discussed previously, there is a learning curve associated with the additional responsibilities that were placed on hiring managers, and these managers may not be receiving adequate support so that a knowledge gap still exists. Business Management Units (BMUs) have adopted some related activities, such as providing advice to managers; however, this is often outside of the BMU's expertise and can negatively impact decision-making. Having a number of different parties involved in the hiring process results in delays, and hiring managers have less flexibility to hire "best fit" candidates in a timely manner, and while profiles indicated that Workforce Management Board has been effective in approving hiring strategies for anticipated vacancies, the Workforce Management Board process has delayed the hiring unforeseen vacancies. The 2013 Corporate Risk Profile stated that the creation of Service Centres in the Department has caused confusion over roles and responsibilities, and has resulted in unintended gaps in -related functions such as employee recognition, co-ordination of learning and development plans related to training. Although the 2014 Corporate Risk Profile does not attribute these service gaps to the creation of Service Centres, it does identify these gaps as factors to the Capacity risk in relation to ineffective performance management as a key business condition of the department's risk.
In the 2010, 2011, and 2014 corporate risk profiles, ineffective performance management practices were considered key risk business conditions. In all three corporate risk profiles, senior management identified that the department does not effectively address low-performance. A related business condition was identified in corporate risk profiles from 2011 to 2014 is that there is limited opportunity for employee training and career development. Causes for this gap included cuts to operation budgets including travel restrictions (2011-2014) and that learning plans do not always adequately reflect operational skills and development needs of employees (2013, 2014). The 2014 Corporate Risk Profile added that performance management in the Department does not prioritize formally developing strong performers and future leaders, and that training is seen by some managers as not worth the cost or time investment, or as a lower priority in a cost-restrained environment. In addition, financial restrictions on A-base funding also result in reduced opportunities for career advancement, which can create a challenge to retention (2012, 2014).
The final Capacity risk key business condition relates to employee physical security. The 2013, and 2014 corporate risk profiles state that "there are situations in which the inherent threat to the physical safety of INAC employees is heightened (e.g. transporting Treaty Payments, service windows, handling of firearms)" and "[t]here may be security events (e.g. demonstrations) for which employees do not have formal training or tools."
3.4 Common risks and business across all levels of the Department
The tables in this section present the key risks and business conditions that are common across all levels of the department studied as part of the trend analysis. Table 20 indicated that risk statements and their comparative risk ratings. There are three key risk statements that were identified by both programs and regions: i) there is a risk that the [organization] does not have the required skills/technical expertise among staff to fulfill obligations; ii) there is a risk that the [organization] will have an insufficient level of human resources (capacity) to maintain current service delivery and meet objectives; and iii) there is a risk that the [organization] will be unable to retain staff. Programs tended to rate their risks lower than regions, with only one program risk receiving an average rating of "high" compared to all key risks in regions receiving a rating of "high" or above. For example, the regions rated the risk that "the [organization] does not have the required skills/technical expertise among staff to fulfill obligations" as "high", while programs rated this risk as "moderate" on average.
| Key Risk | Program Level with Average Rating | Regional Level with Average Rating | Corporate Level with Average Rating over 5 Years |
|---|---|---|---|
| There is a risk that the [organization] does not have the required skills/technical expertise among staff to fulfill obligations | Yes – Moderate | Yes – High | |
| There is a risk that the [organization] will have an insufficient level of human resources (capacity) to maintain current service delivery and meet objectives | Yes – High | Yes – High-Extreme | |
| There is a risk that the [organization] will be unable to retain staff | Yes – Moderate | Yes – High | |
| There is a risk that the [organization] will be unable to attract and/or hire staff with the right skills in a timely manner | Yes – Low to Moderate | ||
| There is a risk that the [organization] will not be able to attract, recruit and retain sufficiently qualified, experienced and representative human resources in a timely manner | Yes – High | Yes – High | |
| There is a risk that the [organization] does not have the capacity to train employees for assignment roles or is not utilizing internal development tools effectively | Yes – High | ||
| There is a risk that insufficient knowledge transfer will lead to a decrease in the capacity of program employees. | Yes – Moderate to High |
Table 21 demonstrates six key risk business conditions were identified in risk profiles for all levels of the Department that were examined. These six business conditions are:
- High turnover and anticipated (eligible) retirements in the department can affect the retention of corporate knowledge and organization stability
- There is a lack of training and capacity building for staff
- Lengthy hiring process
- Organizational transitions and re-organizations (DRAP, responsible expenditure management, devolution)
- Government cutbacks and freezes to salary dollars and operational budgets creating a barrier to recruitment and staffing vacant positions, meeting objectives, and travel for business or training
- Effects of implementing common processes
| Key Risk Business Conditions | Program Level | Regional Level | Corporate Level |
|---|---|---|---|
| High turnover and anticipated (eligible) retirements in the department can affect the retention of corporate knowledge and organization stability | Yes | Yes | Yes |
| There is a need for specific skills and technical expertise in certain programs and regions | Yes | Yes | No |
| There is a lack of training and capacity building for staff | Yes | Yes | Yes |
| Effects of implementing common processes (e.g. increased responsibilities placed on hiring managers who may not have the capacity to deliver this role effectively) | Yes | Yes | Yes |
| Dependencies on temporary/term positions lead to difficulty attracting and retaining employees | Yes | No | Yes |
| Lack of effective succession planning and resources dedicated to retaining corporate knowledge | Yes | Yes | No |
| There is reduced mobility and opportunities for career advancement and employee development | No | Yes | Yes |
| Location of offices is a challenge to recruitment | No | Yes - limited labour pool in northern regions | Yes |
| Competition for talent with the private sector, other government departments and other levels of government | No | No | Yes |
| Ineffective performance management practices | No | No | Yes |
| Lengthy hiring process | Yes | Yes | Yes |
| Organizational transitions and re-organizations (DRAP, responsible expenditure management, devolution) | Yes | Yes | Yes |
| planning is not integrated with strategic and operational planning | No | No | Yes |
| Employee Physical Safety | No | No | Yes |
| Government cutbacks and freezes to salary dollars and operational budgets creating a barrier to recruitment and staffing vacant positions, meeting objectives, and travel for business or training | Yes | Yes | Yes |
| Human resources are not always appropriately aligned or used in a way that ensures program objectives are met (for example, some program staff are performing functions outside of their program's mandate) | Yes | No | No |
4.0 Conclusion
This analysis demonstrates that risks and their severity vary between the program and regional levels, and business conditions contributing to risks are dependent on the context of each program and region. For example, it is clear from the regional risk analysis that Nunavut region experiences unique challenges to recruiting and retaining qualified staff due to the geographic location and demographic of available human resources with the appropriate skill sets in the North. Therefore, mitigation strategies for risks must be maintained or developed so that they address the business conditions particular to each program and region. However, the appearance of common business conditions across risk assessments at all levels of the department indicates significant challenges impacting the department's ability to meet it objectives from the operational to the strategic level. These business conditions may require targeted mitigation strategies that are implemented through an integrated approach led by program and regional management, with regular monitoring by senior management to ensure the department efficiently and effectively meets the demands of its mandate.
Risk Management Policy Instruments
Treasury Board Secretariat
Treasury Board Secretariat Framework for the Management of Risk
Treasury Board Secretariat Guide to Integrated Risk Management
Treasury Board Secretariat Guide to Risk Statements
Treasury Board Secretariat Guide to Risk Taxonomies
Treasury Board Secretariat Guide to Corporate Risk Profiles
INAC
INAC Integrated Risk Framework
INAC Integrated Risk Management Toolkit
INAC Corporate Risk Scales
| Programs | Year |
|---|---|
| Education (Elementary and Secondary Education; Post-Secondary Education) | 2012 |
| Combined Social Programs A (Income Assistance; Assisted Living; National Child Benefit Reinvestment) | 2012 |
| Combined Social Programs B (First Nation Child and Family Services; Family Violence Prevention) | 2012 |
| Emergency Management and Assistance | 2012 |
| Capacity Development Partnership | 2011 |
| Climate Change Adaptation and Resilience | 2011 and 2014 |
| Eco-Energy | 2011 and 2014 |
| Combined Infrastructure and Capacity Programs (Water and Wastewater; Education Facilities; Housing; Other Community Infrastructure Activities) | 2014 |
| Contaminated Site Management (South of 60) | 2011 |
| First Nation Governments | 2014 |
| Aboriginal Governances Institutions and Organizations | 2014 |
| Nutrition North | 2014 |
| Combined Aboriginal Entrepreneurial Programs (Business Capital and Support Services; Business Opportunities) | 2014 |
| Sectors | Year |
|---|---|
| Northern Affairs Organization | 2014 |
| Regions | Year |
|---|---|
| Northwest Territories | 2014 |
| Nunavut | 2012 |
| Yukon | 2013 |
| Manitoba | 2012 |
| Alberta | 2012 |
| British Columbia | 2012 |
| Saskatchewan | 2012 |
| Ontario | 2012 |
| Atlantic | 2013 |
| Quebec | 2011 |
| Corporate Risk Profiles | Year |
|---|---|
| Corporate risk profiles (5) | 2010, 2011, 2012, 2013, 2014 |