Joint Evaluation of the On Reserve Income Assistance Reform
January 2016
Project Number: 1570-7/14085
PDF Version (949 Kb, 56 Pages)
Table of contents
- List of Acronyms
- Executive Summary
- Management Response and Action Plan
- 1. Introduction
- 2. Evaluation Scope and Methodology
- 3. Evaluation Findings - Relevance
- 4. Evaluation Findings – Design and Delivery
- 5. Evaluation Findings – Performance
- 6. Conclusions and Recommendations
- Annex A – Income Assistance Reform Logic Model
- Annex B - Income Assistance Program for First Nation Communities (2013)
- Annex C –Income Assistance Reform Providers
- Annex D – Definitions of FNJF Interventions
- Annex E – Income Assistance and Enhanced Service Delivery Resources (2009-2010 to 2013-2014)
List of Acronyms
| ESDC |
Employment and Social Development Canada |
|---|---|
| FNJF |
First Nations Job Fund |
| INAC |
Indigenous and Northern Affairs Canada |
Executive Summary
Introduction
The evaluation of the On-Reserve Income Assistance Reform initiative was conducted in accordance with the Treasury Board's 2009 Policy on Evaluation. The evaluation examined Income Assistance Reform's relevance, performance (effectiveness, efficiency and economy), and design and delivery from its inception in April 2013 to July 2015. One key objective of the evaluation was to produce timely findings and conclusions intended to inform the possible renewal of Income Assistance Reform.
The evaluation was conducted jointly by the Evaluation, Performance Measurement and Review Branch at Indigenous and Northern Affairs Canada (INAC) and the Evaluation Directorate at Employment and Social Development Canada (ESDC).
Background
Income Assistance Reform is an interdepartmental initiative announced in Budget 2013,Footnote 1 whereby INAC and ESDC collaborate to implement a continuum of services to address barriers to employability of Income Assistance clients aged 18 to 24 who are expected to be deemed as employable within one year.
INAC administers the Enhanced Service Delivery component. Its delivery is ensured by First Nations organizations such as band councils and tribal councils. First Nation communities use a case management approach to identify clients' individual barriers to employment, and establishing an action plan to address these barriers through available programs and services. It is focusing on activity areas such as: pre-employment training on basic literacy skills; life-skills training; essential skills training; high school diploma completion/equivalency; psychosocial interventions; and financial incentives for participation in mandatory provincial or territorial intervention.
ESDC administers the First Nations Job Fund (FNJF) component. The FNJF is delivered by Aboriginal Skills and Employment Training Strategy service network. FNJF service provider's role is to provide skills development training to secure employment or return to school, as well as other types of active measures such as: skills assessments; personalized training; coaching; and other supports for young Income Assistance clients on-reserve.
Enhanced Service Delivery and the FNJF services providers are required to develop a Client Referral Strategy, which establish service standards between both parties and outline how the organizations will work together to serve Income Assistance clients.
It is estimated that 25,547 youth on-reserve between the ages of 18-24 are currently in receipt of Income Assistance. By 2016-2017, Income Assistance Reform intends to reduce the number of clients on Income Assistance by 4,277 individuals. Over a period of four years (2013-14 to 2016-17), INAC is expected to allocate $132.5 million for the Enhanced Service DeliveryFootnote 2 and ESDC will allocate $108.6 million for the FNJF.
The ultimate outcomes of Income Assistance Reform are: First Nation men, women and children are active participants in social development within their communities; and First Nations Income Assistance clients on-reserve are employed and integrated into the labour market.
Methodology
The methodology used to conduct this evaluation included: a document and file review; a literature review; data analysis; 20 key informant interviews with INAC and ESDC program staff; and seven site/community visits.
Findings and Conclusions
This section summarizes the evaluation findings related to the relevance, design and delivery and performance of the Income Assistance Reform.The program's assessment of performance is based on the achievement of its immediate outcomes. Once the program has sufficiently matured and employment income data becomes available, an impact analysis will determine whether the Income Assistance Reform can be attributed with sustainably reducing the number of youth relying on income assistance. Future evaluation work will also be better positioned to examine the Income Assistance Reform's cost-effectiveness.
Relevance
A continued need exists for on-reserve Income Assistance Reform, as the Income Assistance dependency rate on-reserve is almost seven times higher (34 percent) than the general population (five percent). Income Assistance Reform aligns with federal government priorities, and both departments' Strategic Outcomes. Finally, Income Assistance Reforms aligns with federal government roles and responsibilities.
Design and Delivery
The introduction of on-reserve Income Assistance Reform moves Income Assistance delivery away from a passive "cheque cutting" exercise to a more client focused assistance program. It introduces active measures (i.e., activities that help Income Assistance clients increase their employability and find jobs such as basic and life skills and formal education) and case management practices (i.e., proactive approach that focuses on identifying individuals' employment readiness and the jobs and skills training they require to find and keep a job). Overall, Income Assistance Reform was delivered as planned, but delays were encountered due to releasing funding to First Nation service providers in the fourth quarter of its first year of operation.
Performance (Outcomes)
While existing data collection will allow for some measure of incremental impact over time, there are concerns respecting the reliability and completeness of some of the data. Improvements to data collection should be made to support effective program management.
To date, more than 6,800 new Income Assistance clients have entered Enhanced Service Delivery case management, which exceeds the targets of 5,376 set for fiscal years 2013-2014 and 2014-2015. Referrals from the Enhanced Service Delivery to FNJF have been low, resulting in targets not being met. Some 1,276 clients were served by FNJF in fiscal years 2013-2014 and 2014-2015, well below the target of 4,491 clients. This is due in part to the late implementation and capacity of building of the Enhanced Service Delivery. Also, many clients immediately found employment or returned to school during their initial assessments by Enhanced Service Delivery caseworkers.
Initial indications suggest that Income Assistance Reform is achieving its immediate outcome of promoting client exits from Income Assistance:
- In 2013-2014, approximately seven percent of 18 to 24 year olds exited from Income Assistance. In 2014-2015, the year after its implementation, this increased by 22 percentage points to 29 percent, suggesting that Income Assistance Reform had an effect on the number of individuals exiting from Income Assistance to either employment or education.
- In 2013-2014 and 2014-2015, 2,041 clients exited from Income Assistance to employment or education exceeding the target of 1,388 clients by 653 exits or 47 percent.
- After participating in FNJF, 51 percent of clients found employment, eight percent returned to school, and 23 percent were actively looking for work.
The Income Assistance Reform also benefited clients by enhancing their self-image and by setting a positive example for their families and their communities. Employers benefited from accessing better trained, job-ready candidates.
FNJF client data suggested that just over one-quarter of clients (28 percent) did not meet the eligibility criteria of being in receipt of Income Assistance. Further investigations suggest that this can be attributed to a data entry error. For example, some FNJF caseworkers were inadvertently recording clients as not being on Income Assistance after having found employment.
Of the FNJF interventions offered to clients, the opportunity to gain work experience (Job Creation Partnership) was found to have the best results for clients in terms of gaining employment.
- Barriers to employment influence clients' outcomes. Overall, clients with no barriers were more likely to find employment or return to school than clients with barriers.
- Gender also appears to have some influence on client success. Males are slightly more likely to exit from Income Assistance (58 percent) for employment or education, than female clients (42 percent). FNJF male clients are more likely to find employment than female clients (63 percent versus 36 percent). FNJF female clients are more likely to return to school than male clients (61 percent versus 39 percent).
Efficiency and Economy
Given that the Income Assistance Reform has only recently been implemented in select communities, it was early in the Initiative's life cycle to assess the cost-effectiveness of program delivery. Future evaluation can examine this further.
A simple cost analysisFootnote 3 based on ESDC contributions was undertaken and determined that the average FNJF participant cost for 2014-2015 is $5,650. This is lower than the average $7,000 that was originally planned.
Areas for Potential Improvement
In general, a few areas were identified for potential adjustment to the Enhanced Service Delivery design that includes the following:
- The length of the Enhanced Service Delivery intervention may not be sufficient (currently set at a maximum of six months) to address all Income Assistance clients' needs with respect to employment readiness.
- Currently, there are no clear regulations for program administrators or clients on return to or resuming programming once they have left Income Assistance Reform activities.
- Extending the age of accessibility to 30 years of age may benefit more youth.
- Examining program participation incentives to ensure they do not motivate clients to apply for Income Assistance.
- Examining the consistent application of disincentives to clients who are not meeting the targets established in their action plans.
- Reducing the 50:1 caseworker caseload so that Enhanced Service Delivery caseworkers may provide the personalized assistance clients require to complete their action plans.
Recommendations
Most of the recommendations in this report stem from aspects of data collection that are intended to improve ongoing performance measurement and to support future policy, research, and evaluation work. There were concerns over the completeness and reliability of some of the data. For example, the socio-demographic and intervention data collected by the Enhanced Service Delivery was insufficient to adequately describe participants and the types of interventions they participated in. An examination of the data collection strategy by both departments is needed to more efficiently capture and link participant data to ensure effective client monitoring and analysis of outcomes and impacts.
Recommendation 1: It is recommended that INAC ensure that data collection instruments and processes used by service providers consistently and accurately capture adequate socio-demographic and program outcome information on clients.
Recommendation 2: It is recommended that INAC and ESDC collaborate to explore ways to more efficiently capture and link information collected by each department to allow for strengthened client monitoring and analysis of outcomes and impacts of the Income Assistance Reform.
FNJF client data suggested that just over one-quarter of clients (28 percent) were recorded as not being in receipt of Income Assistance. Further investigations suggest that this can be attributed to a data entry error. For example, some FNJF caseworkers were inadvertently recording clients as not being on Income Assistance after having found employment.
Recommendation 3: It is recommended that ESDC communicate to all FNJF service providers the data capture protocols that enable the accurate and consistent recording of the client status of being on Income Assistance.
Finally, the evaluation identified some potential to improve efficiency, such as examining the feasibility of multi-year funding agreements for Enhanced Service Delivery providers. For example, late notification of 2014-2015 funding led to staff layoffs and pause in client interventions in some delivery sites. This inevitably caused delayed referrals to the FNJF. Funding the Enhanced Service Delivery on a multi-year basis would reduce service interruptions and improve delivery of the Income Assistance Reform.
Recommendation 4: It is recommended that INAC explore the feasibility of introducing multi-year funding agreements for the Enhanced Service Delivery.
Management Response and Action Plan
Project Title: Joint Evaluation of the On-Reserve Income Assistance Reform
Project Number: 1570-7/14085
1. Management Response
The Income Support Directorate at Indigenous and Northern Affairs Canada (INAC) and the Aboriginal Affairs Directorate at Employment and Social Development Canada (ESDC) accept the recommendations that were presented in the Joint Evaluation of the On-Reserve Income Assistance Reform initiative and will endeavour to implement solutions to the issues raised therein.
Recommendation 1: It is recommended that INAC ensure that data collection instruments and processes used by service providers consistently and accurately capture adequate sociodemographic and program outcome information on clients.
Over the next fiscal year, INAC will implement a data collection initiative to improve information on clients so as to inform future policy decisions. This initiative will take place between January 2016 and January 2017, and will involve 60 Enhanced Service Delivery providers. The objective is to collect additional sociodemographic information, such as client barriers to employment. This client-level information will capture the path of individuals through the case management and referral system in order to better identify challenges faced by clients in accessing the program, transitioning to the work force, and maintaining employment. As part of its day-to-day program management, INAC will also continue to support providers in using the current Data Collection Instrument, which provides aggregated information on: educational attainment; family composition; age; sex; participation in active measures; exit to employment; and education.
In view of a desire to reduce the reporting burden for reserve communities, major revision of the Income Assistance program Data Collection Instrument is planned for 2016-2017. Additionally, revision of the joint Performance Measurement Strategy is planned for the same year. Both revised items will be implemented in 2017-2018. The revision of the latter document will help ensure that data fields and indicators are aligned with relevant outcomes and departmental policy on reporting.
Options such as the development of an automated case management system will be considered with a view to improving Income Assistance program information, data collection and data reporting processes. Such options will focus on increasing the capacity of service providers to effectively manage client caseloads.
Recommendation 2: It is recommended that INAC and ESDC collaborate to explore ways to more efficiently capture and link information collected by each department to allow for strengthened client monitoring and analysis of outcomes and impacts of Income Assistance Reform.
To-date, INAC and ESDC have been working to ensure that timely and relevant performance information is available to support effective oversight and accountability for the Income Assistance Reform initiative. The evaluation has been helpful in identifying vulnerabilities and data gaps that should be addressed if the departments are to demonstrate results and the impact of their combined efforts over the long-term. INAC and ESDC have a Memorandum of Understanding for Information Sharing which focuses on sharing aggregate level data for implementation purposes, including project approval, results monitoring and evaluation. In addition, the Program Review and Advisory Committee approved a pilot project involving a select number of Enhanced Service Delivery providers and focused on improved data collection and sharing practices.
INAC and ESDC, through the Income Assistance Reform's interdepartmental Performance Measurement Working Group, will collaborate to identify short-term options to improve client data collection and analysis in support of improving the joint monitoring and evaluation of client outcomes and the impact of Income Assistance Reform. Where possible, attention will be given to establishing common data collection protocols (e.g., common definitions, improved data collection activities at the individual level, quality assurance standards), exploring the potential of shared systems for the future, limiting administration/reporting burden, and creating a complete understanding of the client experience (i.e., a seamless case management process, addressing current data gaps) as Income Assistance Reform clients reduce their dependency on Income Assistance program through the combined departmental efforts.
Recommendation 3: It is recommended that ESDC communicate to all First Nations Job Fund service providers the data capture protocols that enable the accurate and consistent recording of the client status of being on Income Assistance.
The evaluation identified a data entry error for First Nations Job Fund clients in Alberta and Quebec. ESDC acknowledges that there will always be a risk for data entry errors and, as part of its ongoing monitoring of all Aboriginal labour market programs, has taken measures to reduce the likelihood of these errors, including ongoing monitoring of data quality and follow-up. Nevertheless, errors can happen, especially with new data entry staff or a new program as with the First Nations Job Fund.
By February 15, 2016, by way of a written communication from Service Canada regional directors, ESDC will remind the First Nations Job Fundservice providers of the importance of capturing and sharing complete client records for all First Nations Job Fund participants. ESDC Headquarters will monitor data quality and, if required, work with Service Canada and First Nations Job Fund service providers to address any deficiencies on a timely basis.
Recommendation 4: It is recommended that INAC explore the feasibility of introducing multi-year funding agreements for Enhanced Service Delivery.
INAC does not currently have the program authorities to introduce multi-year funding agreements for Enhanced Service Delivery providers.
The Department acknowledges that annual funding renewal can be a complex process for Enhanced Service Delivery providers. Consideration will be given to introducing multi-year funding agreements in future policy decisions.
2. Action Plan
Recommendations |
Actions |
Responsible Manager (Title / Sector) |
Planned Start and Completion Dates |
|---|---|---|---|
| 1. It is recommended that INAC ensure that data collection instruments and processes used by service providers consistently and accurately capture adequate sociodemographic and program outcome information on clients. | We concur | Director General, Social Policy and Programs Branch (INAC) | |
1.1 Implement a data collection initiative to improve the information on clients to inform future policy decisions 1.1.1 Data gathered quarterly by participating First Nations 1.1.2 Data compiled and analysed quarterly by INAC and final report released |
Start Date: Completion: Completed |
||
1.2 Provide support to providers in using the current Data Collection Instrument 1.2.1 Meetings with regional offices organized on Data Collection Instrument 2016-2017 |
Start Date: Completion: March 31, 2017 Completed |
||
1.3 Carry out review of the Income Assistance Data Collection Instrument for implementation in 2017-2018 Study the feasibility of implementing an information management system. 1.3.1 Revised data collection instruments |
Start Date: Completion: Completed |
||
| 2. It is recommended that INAC and ESDC collaborate to explore ways to more efficiently capture and link information collected by each department to allow for strengthened client monitoring and analysis of outcomes and impacts of Income Assistance Reform. | We concur | Director General, Social Policy and Programs Branch Director General, Aboriginal Affairs Directorate (ESDC) |
Start Date: Completion: Completed |
| 2.1 An interdepartmental working group will identify options to improve, where possible, client data collection and analysis in support of improving joint monitoring and evaluation of client outcomes and impact of Income Assistance Reform. | |||
| 3. It is recommended that ESDC communicate to all First Nations Job Fund service providers the data capture protocols that enable the accurate and consistent recording of the client status of being on Income Assistance. | ESDC to respond | Director General, Aboriginal Program Operations Directorate (ESDC/Service Canada) | Start Date: Completion: This recommendation is no longer relevant and therefore can be closed. |
3.1 ESDC/Service Canada will remind First Nations Job Fund service providers of the importance of capturing and sharing complete client records for all First Nations Job Fund participants. 3.2 On an ongoing basis, ESDC/Service Canada Headquarters will monitor data quality and, if required, work with Service Canada and First Nations Job Fund service providers to address any deficiencies on a timely basis. |
|||
| 4. It is recommended that INAC explore the feasibility of introducing multi-year funding agreements for Enhanced Service Delivery. | We partially concur | Director General, Social Policy and Programs Branch (INAC) | Start Date: Completion: Completed |
4.1 Consideration will be given to securing authority for multi-year agreements as part of the forward policy renewal process. 4.1.1 Undertake intra-departmental consultations and analyses to determine feasibility of incorporating a multi-year funding structure as part of a renewed initiative. Results to be incorporated in next policy documents. |
I recommend this Management Response and Action Plan for approval by the Evaluation, Performance Measurement and Review Committee
Original signed by:
Michel Burrowes
Director, Evaluation, Performance Measurement and Review Branch
I approve the above Management Response and Action Plan
Original signed by:
Paula Isaak
Assistant Deputy Minister, Education and Social Development Programs and Partnerships
1. Introduction
1.1 Overview
The evaluation of the On-Reserve Income Assistance Reform initiative was conducted in accordance with the Treasury Board's 2009 Policy on Evaluation. The evaluation examined the Income Assistance Reform's relevance, performance, and design and delivery from its inception in April 2013 to July 2015. Where feasible, the evaluation measured early outcomes to inform the potential funding renewal processes in 2016-2017.
The evaluation was conducted jointly by the Evaluation, Performance Measurement and Review Branch at Indigenous and Northern Affairs Canada (INAC) and the Evaluation Directorate at Employment and Social Development Canada (ESDC).
1.1.1 Income Assistance Reform Profile
The Income Assistance Reform is an interdepartmental initiative announced in Budget 2013,Footnote 4 whereby INAC and ESDC collaborate to implement a continuum of services to address barriers to employability of Income Assistance clients aged 18 to 24 who are expected to be deemed as employable within one year. It is estimated that 25,547 youth on-reserve between the ages of 18-24 are currently in receipt of Income Assistance. Over a period of four years (2013-14 to 2016-17), INAC is expected to allocate $132.5 million for the Enhanced Service DeliveryFootnote 5 and ESDC will allocate $108.6 million for the First Nations Job Fund (FNJF).
The delivery of the Enhanced Service Delivery component is ensured by First Nations organizations such as band councils and tribal councils. FNJF is delivered by the Aboriginal Skills and Employment Training Strategy service network.
Based on the logic model (see Annex A), the Ultimate Outcomes of the Income Assistance Reform are:
- First Nation men, women and children are active participants in social development within their communities. (INAC)
- First Nations Income Assistance clients on-reserve are employed and integrated into the labour market. (ESDC)
1.2 Background
On-reserve, Income Assistance is funded by INAC, which allocates resources to First Nations or First Nation organisations, and the province of Ontario under the 1965 Agreement, to deliver Income Assistance on-reserve in the ten provinces. INAC also delivers the Income Assistance program to non-self-governing indigenous residents in the Yukon Territory.
Expenditures for Income Assistance grew from $599 million in 2001-02 to $838 million in 2011-12. This growth (approximately 29 percent) was partially due to growth in the on-reserve populationFootnote 6 and increases in provincial Income Assistance benefits and rates, to which INAC Income Assistance rates are tied through policy.Footnote 7 Please refer to Annex B for a map showing First Nations' participation in the Income Assistance program in 2013.Footnote 8 In the late 1990s, provinces and territories began restructuring their respective social assistance programs. A combination of more restrictive measures, enhanced employment and training services, and economic growth led to a reduction in provincial social assistance dependency rates.
While INAC was provided with the authorities for the implementation of active measures in 2003, initially, no additional funding was allocated. Active Measures are activities that help Income Assistance clients increase their employability and find jobs (e.g., basic and life skills, formal education and career counselling, apprenticeships, wage subsidy to employers to hire clients, etc.).Footnote 9 Subsequently, beginning in 2009-2010 and for a period of three consecutive fiscal years, INAC internally re-allocated approximately $2 million annually to support active measures pilot projects. In 2012-13, INAC reallocated $14 million to enhance the service delivery capacity and support active measures in 150 First Nations, as a precursor to longer-term active measure supports. Although Income Assistance remains generally a "passive" cheque cutting program, aside from these additional funding, First Nations organisations Income Assistance providers are increasingly implementing active measures using various sources of funding, including provincial funds.
ESDC has a long history of funding and administering the federal government's primary skills development and training programs to help support the participation of Aboriginal peoples in the labour force. It is the lead federal department in the funding of labour market programming, providing an important vehicle for active measures initiatives. The Aboriginal Skills and Employment Training Strategy program, administered by ESDC, invested $1.68 billion between 2010 and 2015, and aims to improve labour market outcomes for all Aboriginal peoples by supporting demand-driven skills development,Footnote 10 and fostering partnerships with the private sector and provinces and territories. The Aboriginal Skills and Employment Training Strategy currently supports a network of more than 80 agreement holdersFootnote 11 with over 600 points of service across Canada.
1.2.1 Program Objectives and Design
The Income Assistance Reform aims at enhancing the service capacity in First Nation Income Assistance providers and expanding access to case managementFootnote 12 and pre-employment measures to increase clients' employability and labour force attachment. To do so, the Income Assistance Reform approach is guided by six core areas of proposed activities:
- A comprehensive compliance framework by ensuring that all funding recipients are implementing the current on-reserve Incom Assistance program within the existing authorities. This is the first step to move the program closer to provincial comparability.
- Enhanced Service Delivery system: $132.5 million over four years, administered by INAC to support First Nation communities to create the service delivery capacity via an integrated case management approach to identify clients' eligibility, barriers to employment, and referral to pre-employment services. Client Supports costs are determined by the client's Action Plan, and should not exceed $3,500.Footnote 13
- First Nations Job Fund: $108.6 million over four years, administered by Employment and Social Development Canada, provides personalized training and support to youth referred by Enhanced Service Delivery caseworkers. The FNJF planned to spend an average of $7,000 per client. However, Aboriginal Skills and Employment Training Strategy Agreement Holders may choose to fund individual clients for more or less than the average as appropriate based on the client's needs and the interventions included in their Employment Action PlansFootnote 14.
- Mandatory requirements of 18-24 year olds and new entrants requiring less than one-year pre-employment skills training.
- Federal program alignment and integration to avoid duplication and overlap of services, and maximize efficiencies and to seek collaboration with other departments (e.g., Health Canada for health issues).
- Partnerships for a strengthened system, so Enhanced Service Delivery providers have strong service networks in place with access to pre-employment and training facilities located on- and off-reserve, including provincially-funded services.
A strong program governance and coordination is ensured by an inter-departmental governance structure, which involve Headquarters and regional staff at INAC and ESDC, which functions to ensure that targets are met through regular reporting; reform policy objectives are respected; duplication is reduced and efficiency is achieved. Other departments (e.g., Health Canada) are invited to participate on an "as needed/as requested" basis. INAC and ESDC will also undertake to convene policy and program reviews with all interested departments, including central agencies, at least once a year.
1.2.2 Program Implementation
The implementation roll-out is incremental and based on a directed proposal process targeting willing and "ready" organizations with more advanced capacity.Footnote 15 To date, 27 Enhanced Service Delivery providers (representing 88 First Nations) have been selected to participate in the Enhanced Service Delivery (see Annex C). Potential participating organizations must meet the following five essential criteria:
- Minimum caseload and sustainable over time (50:1 ratio clients to caseworker);
- Excellence in program management;
- Commitment by the Band Council to implement mandatory requirements;
- Labour market potential; and
- Current capacity.
In Ontario, the Income Assistance Reform aims at increasing the number of First Nation organizations that deliver the Employment Assistance component (pre-employment activities) of Ontario Works. The process is initiated by First Nations organizations, which must submit a service plan to the Government of Ontario.
Each Enhanced Service Delivery proposals must be paired between an Enhanced Service Delivery or an Ontario Works provider with a First Nations Job Fund provider for skills development training.
The Income Assistance Reform is structured to enable both Enhanced Service Delivery service providers and FNJF service providers to deliver an enhanced and streamlined case management system. Collaboration between the Enhanced Service Delivery and the FNJF service providers is considered to be a key component of the Income Assistance Reform, from the initial assessment of the client all the way through to the client finding employment.
Enhanced Service Delivery and the FNJF services providers are required to develop a Client Referral Strategy, which establish service standards between both parties and outline how the organizations will work together to serve Income Assistance clients.
Enhanced Service Delivery service provider's role is to identify clients' individual barriers to employment, and establishing an action plan to address these barriers through available programs and services. It is focusing on activity areas such as: pre-employment training on basic literacy skills; life-skills training; essential skills training; high school diploma completion/equivalency; psychosocial interventions; and financial incentives for participation in mandatory provincial or territorial intervention.
FNJF service provider's role is to provide skills development training to secure employment or return to school, as well as other types of active measures such as: skills assessments; personalized training; coaching; and other supports for young Income Assistance clients, on-reserve.
The Enhanced Service Delivery and FNJF Continuum (see Figure 1) illustrate the distinct roles and responsibilities of ESD-providers vis-à-vis FNJF-providers.
Figure 1: Enhanced Service Delivery and FNJF Continuum
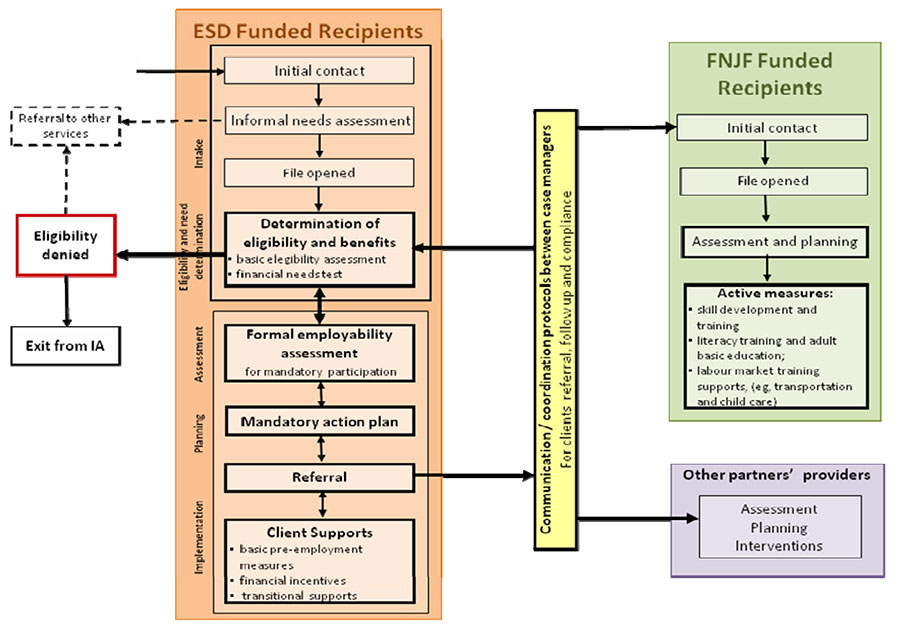
Text alternative for Figure 1: Enhanced Service Delivery and FNJF Continuum
This diagram demonstrates the movement of clients between Enhanced Service Delivery and FNJF Continuum. The diagram is made up of four main parts. At the top left, a figure of a person represents entry of a client to the Enhanced Service Delivery program as a "ESD Funded Recipient". The client first enters the Intake and the Eligibility and Need Determination phase of Enhanced Service Delivery which contains four sequential steps.
- "Initial Contact"
- "Informal Needs Assessment"
- "File Opened"
- "Determination of eligibility and benefits: Basic Eligibility assessment; and Financial Needs test."
At the "Informal Needs Assessment" step, a client may be referred to other services. At the "Determination of Eligibility and Benefits" stage, a client may either have eligibility denied and exit IA or be referred to other services; or move to "Formal Employability Assessment for mandatory participation," the first of four steps a client can move through in the second phase labelled "Assessment, Planning [and] Implementation."
The second phase of Enhanced Service Delivery contains four steps, each connected to the other by a dual-direction arrow, indicating client movement forwards and backwards between these sequential steps:
- "Formal employability assessment for mandatory participation"
- "Mandatory action plan"
- "Referral"
- "Client Supports: basic pre-employment measures; financial incentives; and, transitional supports"
Client supports may be the final step for ESD clients, or they may move back to the "referral" step.
At the "referral" step, a client may move to the step labelled "Communication/coordination protocols between case managers for client referrals, follow up, and compliance." At this stage, the client may become an "FNJF Funded Recipient" or be referred to other partners' providers "assessment planning interventions." Case managers may also refer clients at this stage back to the "determination of eligibility and benefits" step in the first phase of ESD.
FNJF Funded recipients finally move through four sequential steps:
- "Initial contact"
- "File opened"
- "Assessment and planning"
- "Active Measures: skill development; literacy training and adult basic education; labour market training supports (e.g. transportation and child care)".
"Active Measures" represent the final step for FNJF funded recipients.
2. Evaluation Scope and Methodology
The following section details the scope of the evaluation, as well as the methodologies used to perform the fieldwork associated with the study. The constraints and limitations that impacted the evaluation findings and conclusions are also presented.
2.1 Evaluation Scope and Timing
The evaluation examined the design and delivery of the Income Assistance Reform, including its relevance and early performance from its inception in April 2013 to July 2015. Terms of Reference were reviewed by INAC's Evaluation, Performance Measurement and Review Committee, and were approved on September 9, 2014. ESDC's Departmental Evaluation Committee approved the evaluation strategy in January 2014, and the evaluability assessment on September 30, 2014. The field work was jointly conducted by INAC and ESDC evaluators from February to July 2015.
2.2 Evaluation Methodology
The following section outlines the evaluation's data collection methods, major considerations, strengths and limitations, and quality assurance processes.
2.2.1 Data Sources
The evaluation's findings and conclusions are based on the analysis of evidence collected using five lines of evidence.
2.2.1.1 Document and File Review: The document review examined various internal documents, including previous audits, evaluations, management responses and action plans for Income Assistance and Aboriginal labour market programming. In addition, documents specific to the Income Assistance Reform were examined, including: program reports; project tracking files; external reports and communications; operational documents and public communications; and records of decisions from relevant committees.
2.2.1.2 Key Informant Interviews: Approximately 20 INAC and ESDC program staff at both national and regional levels were interviewed.
2.2.1.3 Site Visits: Seven site visits were conducted (see Table 1) out of the 22 Enhanced Service Delivery and nine Ontario Works Income Assistance providers. Based on a review of these selected sites, the evaluation extrapolated findings to support the evaluation. Site selection was based on criteria such as: geographic location of the communities; level of project costs; number of Enhanced Service Delivery clients served and referred to FNJF; and recommendations made by the Income Assistance Reform Evaluation Working Group. The site visits included several data collection methods, including: community visits; interviews with Enhanced Service Delivery and FNJF caseworkers; interviews and focus groups with First Nation project team members; Aboriginal Agreement Holder representatives; community representatives and stakeholders; current/potential employer partners; and, Income Assistance Reform clients. Evaluators interviewed a total of 136 individuals, either one-on-one or in groups.
| Province | Enhanced Service Delivery Providers | FNJF Delivery Providers |
|---|---|---|
Quebec |
Innu Takuaikan Uashat mak Mani-Utenam | Commission de développement des ressources humaines des Premières Nations du Québec |
| Ontario | Beausoleil First Nation | Ogemawahj Tribal Council |
| Manitoba | Dakota Ojibway Tribal Council | First People Development Inc. |
| Saskatchewan | Battleford Agency Tribal Chiefs | Saskatchewan Indian Training Assessment Group Inc. |
| Alberta | Blood Tribe | Community Futures Treaty Seven |
British Columbia |
Seabird Island Centre of Excellence | Stõ:Lõ Aboriginal Skills and Employment Training |
| Nuu-chah-nulth Tribal Council Centre of Excellence | Nuu-chah-nulth Employment and Training Program |
2.2.1.4 Literature Review: A literature review was conducted in order to examine trends, issues and challenges related to Income Assistance and reform activities both nationally and internationally. A review of international literature supports a comparative analysis between Canada and countries with large scale and long-standing active labour market policies, including the United Kingdom and Scandinavian countries.
2.2.1.5 Data Analysis: As per the 2013 Performance Measurement Strategy in place for Income Assistance Reform, relevant data was collected and analyzed. This included administrative data from both departments on funding, uptake and performance, as well as census data on employment for comparison. INAC evaluators analysed the Enhanced Service Delivery data collected in INAC's Income Assistance Data Collection Instrument. ESDC's Common System for Grants and Contributions, as well as data relevant to FNJF extracted from the Aboriginal Standard Data File data, was analyzed by ESDC evaluators.
2.2.2 Considerations, Strengths and Limitations
Income Assistance Reform was initiated in 2013-14 and experienced delays in implementation during the initial start-up period. As a result, at this stage, the evaluation is limited in terms of its ability to report on the outputs and outcomes of the Income Assistance Reform. Please refer to Section 4: Design and Delivery for a description of some of the factors that contributed to delays in implementation. It is too early in the Initiative's life-cycle to reliably assess cost-effectiveness. Future evaluation work will be better positioned to examine this as well as the incremental impacts of the Income Assistance Reform.
The majority of site visit interviews were conducted in groups. As a result, evaluators were unable to combine individual responses when presenting findings from this line of evidence. A standardized weight (e.g., some, a few, most, all, etc.) could not be used to quantify how many respondents provided similar responses to a question. Evaluators considered the experience and knowledge of individual interviewees, the value of their responses and the extent to which there was agreement between the various types of interviewees. Readers can interpret the findings from interviews presented in this document as valid evidence.
2.3 Roles, Responsibilities and Quality Assurance
Due to the joint nature of the evaluation, the following quality assurance activities were put in place:
- The Joint Evaluation Working Group: This group was comprised of departmental program representatives and chaired jointly by INAC and ESDC evaluation managers. The group was responsible for reviewing, validating and commenting on the choice of methodology, the preliminary findings and the final report.
- The Evaluation Advisory Committee: This group, co-chaired by INAC and ESDC evaluation senior officials and consisting of INAC and ESDC evaluation and senior program officials, provided input and direction for the implementation of the evaluation. This advisory committee was responsible for ensuring that all the necessary evaluation issues and questions were covered within the context of available resources, and for the approval of the evaluation report.
- INAC's Evaluation, Performance Measurement and Review Committee: This committee is headed by the Deputy Minister of Indigenous and Northern Affairs. It is responsible for approving the evaluation's Terms of Reference, preliminary findings report, the final evaluation report and Management Response and Action Plan.
- ESDC's Departmental Evaluation Committee: This committee is chaired by the Deputy Minister of ESDC and is responsible for departmental approval of the evaluation strategy, the final evaluation report, and Management Response and Action Plan.
3. Evaluation Findings - Relevance
This section details the evaluation findings related to the relevance of the Income Assistance Reform, including continued need of the Initiative and its alignment with government priorities and federal roles and responsibilities.
3.1 Continued Need for Income Assistance Reform
Barriers to employment and the high Income assistance dependency rate suggest the need for programmatic measures to increase employability and reduce Income Assistance dependency among Aboriginal youth.
Historically, Canada's Aboriginal peoples have experienced higher rates of unemployment and Income Assistance dependency and lower rates of labour force participation than the general Canadian population. Currently, unemployment rates for First Nations people on-reserve are twice the rate of the general Canadian population.Footnote 16 Data from 2012-2013 indicate that on-reserve Income Assistance dependency rates were 33.6 percent, compared to approximately five percent among the general Canadian population. This number has remained relatively unchanged over the past decade.Footnote 17 The marked increase in Income Assistance support expenditures is largely due to growth in the population on-reserve, and increases in on-reserve Income Assistance rates proportional to provincial rates. Research also shows that there has been a shift towards active measures in North America and Europe. This shift is based on findings that investment in skills development is a key component to reducing income assistance dependency.Footnote 18
The Aboriginal population is not only growing faster than the Canadian population in general, but is significantly younger as well. The 2011 National Household Survey found that 18.2 percent of the total Aboriginal population was between 15 to 24 years of age, in comparison to 12.9 percent of non-Aboriginal population. The high rate of Income Assistance usage among Aboriginal peoples and the proportionately larger youth populations suggests there is potential for increased Income Assistance support in the future.
Aboriginal youth who participated in the Income Assistance Reform also face barriers that inhibit employment readiness and labour market participation. Respondents from communities noted that these impediments are often interconnected and include behavioural, social, and educational and external barriers (e.g., lack of economic development and employment opportunities near their communities, remoteness of communities, etc.,) that require significant time to overcome. Interview participants highlighted the importance of the initial life skills supports provided by the Enhanced Service Delivery to address these issues, noting that they allowed clients to overcome feelings of doubt, low self-esteem and low self-worth.
Figure 2 describes the proportion of clients served by the FNJF from April 2013 to June 2015 who during the development of their Employment Action Plan cited a barrier to employment. At the point of entry into FNJF, over half of clients (56 percent) self-identified as having one or more barriers to employment. The most commonly cited barriers to employment were a lack of work experience (26 percent), lack of transportation (25 percent), and a lack of educational attainment (23 percent). Just under half of clients (44 percent) reported having no barriers to employment.
Figure 2: Barriers to Employment Cited by FNJF Clients
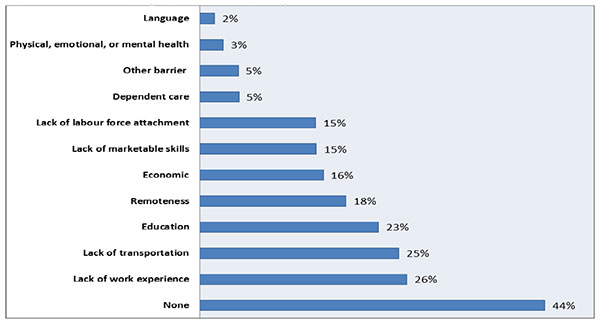
Source: ESDC’s Aboriginal Standard Data File (April 2013 to June 2015). N=1,272. Note - Clients could provide more than one response.
Text alternative for Figure 2: Barriers to Employment Cited by FNJF Clients
This is a bar graph describing in percentages the barriers to employment cited by FNJF clients. On the y-axis, the types of barrier to employment are listed. On the x-axis, the percentages of clients identifying each barrier to employment are listed. The total percentages reported do not equal to 100% as clients were permitted to report more than one type of barrier to employment.
In descending order, listed from most to least frequently cited, the eleven identified barriers to employment were: 26% identified lack of work experience; 25% identified lack of transportation; 23% identified a lack of education; 18% identified remoteness; 16% identified economic; 15% identified lack of marketable skills; 15% identified lack of labour force attachment; 5% identified dependent care; 5% identified other barrier; 3% identified physical, emotional, or mental health; and 2% identified language.
A lack of economic development and employment opportunities within the local communities were also cited as challenges by interview and site visit respondents, especially in regions heavily dependent on the natural resource sector. In such regions, Aboriginal youth can find themselves in competition with applicants who have greater levels of education and work experience, even for entry-level employment. This issue can be exacerbated further in situations where employers are unwilling to hire Aboriginal applicants due to prejudices. In addition, clients are often reluctant to access employment off-reserve, if it means leaving behind their established family and community supports.
The lack of reliable transportation was also identified by caseworkers as one of the most significant barriers to accessing labour market programming and employment. Approximately 25 percent of FNJF clients identified lack of transportation as a barrier to finding employment (see Figure 2). The transportation limitations most often cited during site visit interviews as impacting clients included: the lack or loss of a driver's license; the lack of a reliable personal vehicle (especially difficult to afford if the only employment opportunities are at minimum wage); the distance between reserves and towns; dangerous highways; and a lack of road access. Depending on the province, a driver's license can take up to three years to obtain. In addition, obtaining employment in some remote communities requires access to multiple modes of transportation (bus, boat, floatplane and/or automobile). A practice, found at one site visit, which may warrant further examination is the arranging of a shuttle service for clients to be able to attend their labour market training.
FNJF clients reported a lack of educational attainment as a barrier to employment (23 percent). The on-reserve Income Assistance data (2013-2014) shows very low educational attainment levels for the majority of Income Assistance clients who are classified as able to work. According to the data, 82 percent of Income Assistance clients did not have a high school diploma, while 15 percent of clients had completed high school, and three percent had some post-secondary education.Footnote 19 Low educational attainment may impede participation in education and employment programing and also lead to increased dependency on Income Assistance for these youth. According to caseworkers, motivational and self-esteem issues may also impede their participation. Overcoming these issues takes time (often months or more) and resources in regards to supports and case management.
While Figure 2 shows dependent care (five percent) as one of the least commonly cited barriers to FNJF participation for clients, anecdotal evidence from site visits identified that finding childcare was one of the most important barriers for finding and keeping a job. INAC does not currently collect information on barriers to participation in Income Assistance Reform, specifically entry into the Enhanced Service Delivery. As a result, it is unclear if a lack of childcare is preventing some possible entrants into Income Assistance Reform participation. In 2013-14, approximately 20 percent of Income Assistance clients were single parents, with 17.9 percent being women and 2.1 percent men (See Table 2). Recent studies have shown that participants in Active Labour Market programs who are single parents tend to report that the cost of childcare and its lack of accessibility creates an obstacle to participating in job-searching activities, pre-employment training, and securing full time work.Footnote 20, Footnote 21 When single parents are eligible for Income Assistance and unable to afford upfront childcare costs, there is a disincentive for employment.Footnote 22 Findings from a 2009 meta-analysis of active labour market programs found that those interventions which provided childcare support to single parents in addition to pre-employment training were more effective at reducing Income Assistance receipt than those which did not.Footnote 23
| Single Male | Single Female | Single Parent Male | Single Parent Female | Male in a Couple | Female in a Couple | Male Parent in a Couple | Female Parent in a Couple |
|---|---|---|---|---|---|---|---|
| 12,412 | 6,173 | 536 | 4,549 | 295 | 215 | 614 | 753 |
| 48.6% | 24.2% | 2.1% | 17.8% | 1.2% | 0.8% | 2.4% | 2.9% |
Source: INAC's Income Assistance Data Collection Instrument. |
|||||||
The evaluation examined the Community Well-Being Index for the communities selected to participate in the Income Assistance Reform. The Community Well-Being Index (2011) is a method of assessing socio-economic well-being at the community level. It is made up of four components based on information collected on community members: Income; Education; Housing; and Labour-force activity. The score ranges from a low of zero to a high of 100. In 2011, non-Aboriginal communities had an average Community Well-Being Index score of 79, while First Nations overall had a score of 59. When communities participating in the Income Assistance Reform are examined, the average Community Well-Being Index score is 54. However, scores range from a low of 37 to a high of 74, indicating a great deal of variability among communities in terms of socio-economic well-being of its members.
3.2 Alignment with Federal Government Priorities
Income Assistance Reform aligns with federal government priorities; particularly those associated with strengthening well-being and modernizing the approach to Income Assistance programming.
As part of the 2009 Federal Framework for Aboriginal Economic Development, the federal government seeks to foster linkages between Income Assistance, education and labour market programing to support improved participation of Aboriginal peoples in the economy.Footnote 24 In an effort to accomplish this goal, Income Assistance on-reserve was reformed, moving from passive delivery of income supports to "active" labour interventions.
The Enhanced Service Delivery model, as part of the Income Assistance Reform, is aligned with INAC's mandate to "support Aboriginal peoples and Northerners in their efforts to: improve social well-being and economic prosperity; develop healthier, more self-sufficient communities; and participate more fully in Canada's political, social and economic development – to the benefit of all Canadians."Footnote 25 The Income Assistance Reform falls under INAC's strategic outcome area, "The People", which is intended to promote "individual, family and community well-being for First Nations and Inuit."Footnote 26
The Income Assistance Reform is also aligned with ESDC's mission statement to "build a stronger and more competitive Canada, to support Canadians in making choices that help them live productive and rewarding lives and to improve Canadians' quality of life."Footnote 27 The 2015-2016 Departmental Report on Plans and Priorities supports FNJF's alignment with ESDC's priorities: particularly the departmental priority of maximizing the labour market participation of under-represented groups. FNJF is also consistent with ESDC's strategic outcome of producing a "skilled, adaptable and inclusive labour force and an efficient labour market."Footnote 28
While INAC has had authority to implement active measures since 2003, only strategies geared towards enforcing mandatory skills training or work requirements for employable candidates on-reserve were implemented as small pilot projects in select communities.Footnote 29 Budget 2012, Canada's Economic Action Plan, acknowledged that Canada's Aboriginal population is the youngest and fastest growing segment of the general population. As such, the Budget aimed to invest in "equipping First Nations People with the skills and opportunities they need to fully participate in the economy."Footnote 30 Budget 2013 reaffirmed this goal with increased funding equalling $241 million over five years to improve the on-reserve Income Assistance Program.Footnote 31
Through the introduction of active measures via the Enhanced Service Delivery, FNJF, and related programs, INAC and ESDC seek to keep pace with the provinces and Yukon in reducing Income Assistance dependency on-reserve.
3.3 Alignment of Roles and Responsibilities
Income Assistance Reform is funded by the federal government and administered by First Nations or First Nation organizations.
The Income Assistance Reform is funded by the federal government and administered by First Nations or First Nations organizations in seven provinces and in the Yukon Territory.Footnote 32 The funding relationship of the federal government relative to health, welfare and social spending is affirmed in the Constitution Act Section 91(24).Footnote 33 However, First Nations are able to administer bylaws and deliver social services where sufficient administrative capacity exists.Footnote 34
Assuming they have sufficient capacity for labour market support for Income Assistance clients, Income Assistance service or Aboriginal Skills and Employment Training Strategy delivery agents are likely the most appropriate entities to implement active measures programming and make referrals to FNJF. Some interviewees mentioned that provincial governments were in a better position to implement both Income Assistance and active measures, but this would require provinces to enter into agreements with INAC respecting service delivery on-reserve, and the benefit of this approach over the current approach was not made apparent.
With respect to the delivery of the Income Assistance Reform at the community level, key informant and site visit respondents reported that it was important to ensure funding recipients maintained autonomy over how funding was delivered. Funded communities and agreement holders were viewed as being in the best position to determine how best to direct supports and services to address the needs of clients.
4. Evaluation Findings – Design and Delivery
4.1 Program Governance
At this stage of implementation, program governance appears to be operating appropriately.
The Income Assistance Reform governance structure is designed to support a joint approach to the delivery of the Initiative. It is comprised of national and regional representatives from INAC and ESDC. Three governance structures were developed to support the delivery of the Income Assistance Reform:
- An Oversight Committee composed of senior ESDC and INAC officials from National Headquarters and the regions, as well as representatives from Health Canada and Treasury Board Secretariat. This Committee provides strategic direction and monitors the overall implementation of Income Assistance Reform, including the allocation of resources nationally.
- A Program Review and Advisory Committee consists of reviewing the Enhanced Service Delivery and FNJF funding proposals recommended by the Regional Implementation Teams to ensure consistency of implementation across the country, adherence to the reform objectives and efficient allocation of the budget nationally. It also reviews regional strategic plans for national and inter-departmental coherence, identifies policy or programmatic issues requiring consideration by the Oversight Committee, and provides advice and direction to regions.
- A Regional Implementation Team was created in each region and is composed of regional staff from INAC and ESDC as well as one or more representative(s) from INAC Headquarters. The primary role of each Regional Implementation Team is to develop Joint Regional Implementation Plans. There, they identify, develop, assess and recommend individual Enhanced Service Delivery and FNJF active measures projects for consideration by the Program Review Advisory Committee, and follow-up on their progress. The teams work directly with Enhanced Service Delivery providers and FNJF Aboriginal Skills and Employment Training Strategy agreement holders to ensure that all reform criteria and objectives are met in the development of proposals. The teams also ensure that funding approval processes at ESDC and INAC are coordinated to ensure timely funding decisions and implementation of the Enhanced Service Delivery and FNJF programming.
In late 2014-2015, changes were adopted to all three governance structures in an effort to streamline efforts, avoid duplication, and improve communications. Respondents reported that this resulted in committees of a more manageable size and improved efficiencies in terms of accountability and decision making. Some regional directors interviewed noted that they were not informed of the changes to the make-up of the Program Review and Advisory Committee, and as a result, reported not always being aware of information exchanges.
Overall, evidence from the document review and key informant interviews suggest that the mandate, roles and responsibilities of the Oversight Committee, the Program Review Advisory Committee, and the Regional Implementation Teams are distinct from each other and that there is no duplication between these governance bodies. Roles and responsibilities are clearly laid out in program documents and modifications have been made to the governance structure based on feedback from committee members. It appears that there is regular communication between the different levels.
Joint Regional Implementation Plans were produced by the Regional Implementation Teams. According to program officials interviewed, the Joint Regional Implementation Plans development process had to be completed in a short period of time. Some program officials interviewed found it challenging to find relevant Labour Market Information, including accurate estimates of the size of the target cohort population.
Finally, some program officials pointed out that approval processes between departments tended to slow down the implementation of the program. For example, departments were rarely, if ever, synchronized with one another with respect to their own decision-making processes. As a result, this lack of synchronicity at times created delays in decision making.
While the Joint Regional Implementation Plans for each region outline the roles, responsibilities, communication processes, tools and guidelines at the community/site level, site visit respondents reported a lack of clarity in this regard. In particular, respondents reported some disagreement between the Enhanced Service Delivery and FNJF providers in terms of the types of supports and services eligible for funding under each component, as well as different perceptions as to when a client is "employment-ready." In some communities, this disagreement has led to a breakdown in communication, as well as trust issues between Enhanced Service Delivery and FNJF providers. To address these issues, site visit respondents reported that additional support and guidance was required from the federal level in order to clarify the roles and responsibilities of Enhanced Service Delivery and FNJF providers, as well as to mitigate conflicts.
4.2 Roll-Out of Income Assistance Reform in First Nation Communities
Despite delays in launching Enhanced Service Delivery, the previous experience of many service providers in implementing case management activities allowed for programs to be operational within some communities in a short period of time.
The document review, key informant interviews and site visit participants identified a number of factors that affected the roll-out of the Income Assistance Reform in participating communities.
First, it took longer than anticipated for the Enhanced Service Delivery to be launched. This meant that in Year 1 of funding (2013-14), the Enhanced Service Delivery was only available for three months of potential program delivery and funding. In addition, some Enhanced Service Delivery funding recipients had to build their capacity to deliver the Enhance Service Delivery, including the hiring and training of staff. INAC program officials stated that these delays resulted in the Enhanced Service Delivery not being fully functional until April 2014. Despite delays, caseworkers expressed pride in their ability to implement the Enhanced Service Delivery. Interviewees stated that their previous experience in implementing case management activities facilitated making programs operational in a short time period, thus, validating the approach of targeting Income Assistance providers who were identified as having advanced capacity for early implementation.
Secondly, while no percentage was provided, according to a few program staff interviewees, some Enhanced Service Delivery funding recipients demonstrated less capacity than originally thought with respect to their data tracking and delivery infrastructure. In addition, some site visit respondents reporting that they expected more support from INAC to build this capacity. Interviews with community stakeholders, caseworkers and program officials revealed that limited guidance and materials, such as templates to collect necessary data, were provided to Enhanced Service Delivery funding recipients. Some documents were provided in draft form, which funding recipients were reluctant to use. This left caseworkers to develop their own tools to support the delivery of Enhanced Service Delivery. The revised data collection instrument that includes fields for Enhanced Service Delivery activities has since been revised and should contribute to addressing this issue.
4.3 Program Design
The introduction of on-reserve Income Assistance Reform moves Income Assistance delivery away from a passive exercise to a more client focused assistance program, byintroducing active measures and case management practices. Areas identified for potential adjustment to program design include: program length; program entry and re-entry; age of accessibility; participation incentives and disincentives; and caseworker caseload.
The introduction of on-reserve Income Assistance Reform moves Income Assistance delivery away from a passive "cheque cutting" exercise to a more client focused assistance program, by introducing active measures and case management practices. All interviewees agreed that the introduction of case management benefits clients, and assists them to move towards employability, and ultimately employment. During the course of interviews, the following areas were identified for potential adjustment to program design.
4.3.1 Enhanced Service Delivery Program Length
Interview findings from discussions with caseworkers and community representatives suggested that the length of the Enhanced Service Delivery intervention may not be sufficient (currently set at a maximum of six months) to address all Income Assistance clients' needs with respect to employment readiness. Interviewees suggested that in many cases, the clients' needs for support may go well-beyond six months. For example, caseworkers and community representatives were not clear about what supports would be available to a client after they have entered a training or education program beyond the initial six months of the Enhanced Service Delivery. However, a change to program length would have implications for increased Enhanced Service Delivery caseworker caseloads; and referrals to FNJF where lengthening the time that clients spend on Enhanced Service Delivery could mean delaying their entry into FNJF. Given the perceived ambiguity over the time eligibility, a review of the amount of time allotted to clients for participation in the Income Assistance Reform could be considered and direction provided to Enhanced Service Delivery providers.
4.3.2 Enhanced Service Delivery Entry and Re-entry
Currently, there are no clear regulations for program administrators or clients on return to or resuming programming once they have left Income Assistance Reform activities. A client's trajectory through their mandatory Action Plans is not always linear. Clients may have to pause or exit programming due to unexpected life events, and caseworkers expressed the need for program flexibility in regard to client re-entry into programming. Given the perceived ambiguity, the development of clearer regulations could be considered as a course of action.
4.3.3 Age of Accessibility to Enhanced Service Delivery
Interview findings from discussions with caseworkers and community representatives suggested that the youth cohort who may benefit the most from Income Assistance Reform services are those between 18 to 30 years of age. Considering the low high school graduation rate on-reserve (18 percent) for Income Assistance clients in general,Footnote 35 and that on average Aboriginal youth who do graduate high school are 20 years of age,Footnote 36 it is reasonable to expect that extending the age of accessibility may benefit more youth. Additionally, some employer respondents reported that, in their view, the age group targeted by the program was too young to be employed in some sectors. Even some entry-level positions were described by employers as requiring a high level of maturity, reliability, and experience in order to work safely in a team environment and to operate expensive and dangerous equipment.
4.3.4 Enhanced Service Delivery Program Participation Incentives and Disincentives
As part of the Enhanced Service Delivery, incentives (e.g., additional monthly financial supplements) and disincentives (e.g., reduced Income Assistance benefits) were introduced to encourage clients to fulfill activities under their action plans.Footnote 37 Given the high rate of Income Assistance dependency among youth on-reserve, the additional financial supports also pose the risk of becoming a motivation to draw Income Assistance as a default after completion or termination of high school. In particular, when coupled with financial supports, if employment supports are only offered to Income Assistance clients, then controls need to be in place to ensure that these do not act as a motivation to apply for Income Assistance. Despite requirements to use disincentives in Enhanced Service Delivery programing, caseworkers stated that they were often reluctant to withhold Income Assistance supports from clients who are not meeting the targets established in their action plans.
4.3.5 Enhanced Service Delivery Caseworker Caseload
Data from INAC's Enhanced Service Delivery data collection instrument shows on average caseworkers with an active caseload are working at approximately half of the established client to caseworker ratio of 50:1.Footnote 38 Among service providers with an active caseload, a great deal of variability exists in terms of the ratio, with the number of clients ranging from four to 52, with a mean of 23.5 and a median of 22 clients per caseworker.Footnote 39 Caseworkers noted that due to the complex nature of their work, the ratio of 50:1 may be too high, preventing the personalized assistance clients require to complete their action plans. Some caseworkers described meeting and communicating with clients several times per week. In addition to their regular duties, caseworkers often described providing assistance to clients that is above and beyond their job descriptions, such as driving clients to and from appointments, making morning wake up calls, or helping clients find housing. All caseworkers felt that they had the capacity to do their jobs, but did point to areas where further training would be beneficial, including training to recognize trauma and suicidal tendencies in clients.
4.4 Provincial Service Delivery: The Ontario Works Example
In Ontario, the equivalent of the Enhanced Service Delivery is delivered by Ontario Works. As of April 1, 2013, out of 110 eligible communities, 63 First Nations have access to the Employment Assistance Services of Ontario Works. Additional funding under Income Assistance Reform was provided to Ontario to increase the number of First Nations communities into Ontario Works. As of July 2015, 71 First Nations had access to the Employment Assistance Service of Ontario Works.
As part of Ontario Works, administrators are responsible for case managing clients and require that all applicants for financial assistance must enter a Participation Agreement. The Participation Agreement, similar to an action plan under the Enhanced Service Delivery model, outlines a client's immediate and longer-term goals, and the activities they will undertake to improve their employability while on Income Assistance. In some cases, a Participation Agreement can identify that the individual does not need to actively participate, such as a sole support parent or a caregiver of a disabled family member. Ontario Works Administrators have the discretion to impose measures for recipient non-compliance with the participation expectations set out in their Participation Agreement. Persons with disabilities in receipt of the Ontario Disability Support Program are given the opportunity to voluntarily participate in Ontario Works employment assistance activities leading to employment. However, disabled applicants who are voluntarily participating in active measures are not subject to consequences for noncompliance.
In large measure, the federal implementation of Income Assistance Reform on-reserve in Ontario is a matter of providing FNJF supports, given Ontario Works already provides case management and active measures. Thus, case study participants did not raise the same implementation issues highlighted by other service delivery agencies discussed in this report, largely because to some degree, the capacity has been in place and operational since 1965. The roles and responsibilities between Ontario Works caseworkers and FNJF were clear and understood. No major issues were raised with respect to the implementation of the FNJF component beyond those already raised in this report.
As discussed in Section 3.3, provincial governments, from the standpoint of embedded experience and policy, have a strong foothold in Income Assistance and in delivering active measures programs. The Ontario model may be working largely due to historical capacity development on-reserve for service providers over the past 50 years. The success of the model does not suggest that it would be an appropriate approach in other provinces, as capacity would still have to be developed in much the same way as it does now. That said, in Ontario at a minimum, the approach appears to be optimal.
5. Evaluation Findings – Performance
This section summarizes the key performance findings of the Income Assistance Reform, with a particular focus on the Initiative's effectiveness with respect to: data tracking and performance measurement; the provision of supports and services; client participation; and early indicators of success. As previously discussed, the Income Assistance Reform was implemented in 2013-14 and faced significant delays during the initial start-up period. Given that the Income Assistance Reform has only recently been implemented in select communities, it is too early in the Initiative's life cycle to reliably assess the cost-effectiveness of program delivery. It is only with the Initiative being implemented for several years that its effectiveness can be examined in detail. Future evaluation work will be better positioned to examine the Income Assistance Reform's effectiveness, as well as impacts on clients. An impact analysis would compare individuals participating in interventions delivered by FNJF against a comparison group to determine if the Income Assistance Reform resulted in improved rates of employment, employment earnings and whether it had any effects on Employment Insurance and Income Assistance use.
5.1 Data Tracking and Performance Measurement
While existing data collection will allow for some measure of incremental impact over time, there are concerns respecting the reliability and completeness of some of the data. Improvements to data collection should be made to support effective program management.
5.1.1 Enhanced Service Delivery
INAC's existing Income Assistance data collection systems were adapted to include additional fields to support the collection of Enhanced Service Delivery information. The information collected does not include sufficient information on the socio-demographic characteristics of Enhanced Service Delivery clients (e.g., single, married, with/without children), nor does it clearly account for the extent to which clients who may exit and then re-enter Income Assistance, thus risking double-counting.
In addition to the lack of socio-demographic data, the Enhanced Service Delivery does not track type of intervention by client, which prevents a greater understanding and analysis of the Enhanced Service Delivery outputs and outcomes. Finally, information on clients who exit the Enhanced Service Delivery for reasons other than referral to FNJF, education, or employment is not tracked. As a result, it is unclear what has occurred to clients (e.g., whether clients are accessing other federal, provincial or community supports, whether they have exited the Enhanced Service Delivery and remained on Income Assistance, etc.). This limits the ability to inform evaluation and research analysis, as well as policy and program decisions, and prevents a greater understanding and analysis of the Enhanced Service Delivery outputs and outcomes.
At the community level, some Enhance Service Delivery providers had to build their data management and reporting systems from the ground up while others had to adapt existing systems. The expectation from INAC was that existing data tracking systems used by communities would be sufficient to collect the necessary client data as part of Enhanced Service Delivery. However, interviewees from at least three of the sites visited stated that their data systems were not compatible with the new data collection requirements. Two site visits indicated that no money was allocated to creating new or modified databases or for purchasing software to keep track of data. This reportedly put a strain on service delivery agencies. A senior INAC official stated that INAC did not recommend any particular data system products, resulting in a large range of products being used across communities. In addition, as these systems were not preplanned, respondents reported that it was difficult for Enhanced Service Delivery funded communities to anticipate the types of information required for reporting purposes or easily fulfill data requests from INAC. This resulted in some reporting gaps that were only resolved after Income Assistance Reform had been in operation for a full year.
5.1.2 First Nations Job Fund
The FNJF data capture system leverages the existing Aboriginal Skills and Employment Training Strategy case management data collection tools and systems to track and manage FNJF clients. These data systems were modified to differentiate Aboriginal Skills and Employment Training Strategy and FNJF clients (typically via a separate FNJF "drop box"). The database contains 39 variables capturing Social Insurance Numbers, information on socio-demographic characteristics, type of interventions by client with start and end dates, and client outcomes. Action plans are created for each Income Assistance Reform client that is served by FNJF. FNJF service providers are responsible for collecting FNJF client data and reporting this information to ESDC via Service Canada on a quarterly basis. The data collected resides within ESDC's Aboriginal Standardized Data File. The collection of the Social Insurance Numbers permits linking to other databases and accessing additional individual client performance data such as employment earnings, employment insurance and social assistance use.
In the case of FNJF, the evaluation found that overall, the data collection mechanisms currently in place are clear, and sufficiently adaptable and effective at collecting the client data necessary to respond to the performance indicators developed jointly by INAC and ESDCFootnote 40. Key informant interview and site visit respondents reported that Aboriginal Agreement Holders use their existing Aboriginal Skills and Employment Training Strategy case management data collection tools and systems to track and manage FNJF clients.
Some observations were raised by key informants regarding the data collected by FNJF service providers. First, they do not provide FNJF client data by individual First Nations community. Rather, this information is rolled up and reported for all communities served. This limits the ability of ESDC to conduct any FNJF client output or outcome analysis at the community level. This is especially problematic in provinces such as Saskatchewan and Quebec, each of whom has a single FNJF service provider serving the entire province. Conversely, INAC collects information at the community level. These different collection methods prevent the departments and communities from linking client datasets together and resolving data quality issues in cases where there are inconsistencies in reporting. Further, the different collection methods prevent a continuum of analysis that flows from the Enhanced Service Delivery to FNJF.
Finally, there is a certain amount of duplication between both data collection systems. For example, there are two case management systems in operation tracking clients, where each one creates an action plan for the client. When a client is served by FNJF, client socio-demographic characteristics are recorded into both the Enhanced Service Delivery and FNJF database.
The ability to successfully link and efficiently capture the information collected by both departments would allow for more accurate client monitoring and a thorough analysis of outcomes and impacts of Income Assistance Reform. In light of the information gaps identified above for the Enhanced Service Delivery database (e.g., socio-demographic characteristics, tracking type of interventions by client), consideration should be given to adopting a coordinated data collection strategy that would allow the tracking of clients between the two departments more feasible.
Findings from the Evaluation of the Aboriginal Skills and Employment Training Strategy and the Skills and Partnership Fund (2015) found that, overall, the Aboriginal Skills and Employment Training Strategy administrative data was of good quality, with Aboriginal Agreement Holders capturing most of the required data. Overall, the FNJF was of a sufficient quality to support this evaluation as well as any future evaluation work.
Recommendation 1: It is recommended that INAC ensure that the data collection instruments and processes used by service providers consistently and accurately capture adequate socio-demographic and program outcome information on clients.
Recommendation 2: It is recommended that INAC and ESDC collaborate to explore ways to more efficiently capture and link information collected by each department to allow for strengthened client monitoring and analysis of outcomes and impacts of Income Assistance Reform.
5.2 Performance of Income Assistance Reform
In 2013-2014, approximately seven percent of 18 to 24 year olds exited from Income Assistance. In 2014-2015, the year after its implementation, this increased by 22 percentage points to 29 percent, suggesting that Income Assistance Reform had an effect on the number of individuals exiting from Income Assistance to either employment or education. Of the 493 FNJF clients that reported an outcome, 51 percent found employment, eight percent returned to school, and 23 percent were actively looking for work after participation.
5.2.1 Promoting Employment Readiness
Interview respondents, including caseworkers and clients, reported that the Income Assistance Reform produced the client supports it intended to provide as planned. Under Income Assistance reform, Enhanced Service Delivery and/or FNJF could deliver a variety of supports, among them such things as providing assistance with obtaining identification documents (e.g., Social Insurance Number), life skills classes (e.g., resume writing) and workplace safety and certification (e.g., Workplace Hazardous Materials Information System training) employment foundational courses (e.g., customer service), on the job training (wage subsidies) and job training courses. The latter training items being primarily provided under FNJF.
Income Assistance Reform clients emphasized the importance of the assistance and encouragement offered by their case managers, thereby creating a positive environment that supports the successful completion of their training. It was observed that many of the trainings and courses were targeted towards local and in demand occupations.
5.2.2 Program Reach
To date, more than 6,800 new Income Assistance clients have entered Enhanced Service Delivery case management, which exceeds targets of 5,376 set for fiscal years 2013-2014 and 2014-2015 (See Table 3). By March 2017, 14,256 clients with an action plan are expected to be case managed.Footnote 41
| Fiscal Year | 2013-2014 | 2014-2015 | Total |
|||
|---|---|---|---|---|---|---|
| Fiscal Quarter | Q4 | Q1 | Q2 | Q3 | Q4 | |
| New Enhanced Service Delivery Clients (per quarter) |
755 | 1,429 | 1,220 | 2,175 | 1,228 | 6,807 |
Source: INAC's Income Assistance / Enhanced Service Delivery Data Collection Instrument. |
||||||
Despite strong case management numbers under the Enhanced Service Delivery, referrals to FNJF were low, resulting in targets not being met. According to information collected by INAC, from December 2013 to March 2015, approximately 1,500 youth were referred to FNJF. ESDC databases reported that 1,219 clients were served by FNJF, well below the 4,491 clients initially targeted for fiscal years 2013-2014 and 2014-2015. As of June 2015, the number of total clients served increased to 1,272. Since the Enhanced Service Delivery is exceeding its targets, the FNJF should expect to see a gradual increase in referrals.
The discrepancy in the number of referrals reported by the Enhanced Service Delivery and FNJF may be due to reporting period differences between both departments, or to inconsistencies in the definition of a referral. For example, the Enhanced Service Delivery reports a referral to FNJF by counting the number of completed Client Referral Strategies that recommend a client transfers to FNJF. However, clients are only entered into the database once they have been accepted into FNJF. A client can be referred from the Enhanced Service Delivery to FNJF, but if at the time of their FNJF assessment they are not accepted into the program, they do not show up as an FNJF client in the system.
Several factors may have contributed towards the lower than expected number of referrals to FNJF:
- The majority of applications for Enhanced Service Delivery/FNJF funding were not approved until the fourth quarter of 2013-2014. As a result, there were limited Enhanced Service Delivery activities, and therefore few, if any, referrals to FNJF for 2013-2014.
- Referrals to FNJF were delayed due to the prolonged development of the Enhanced Service Delivery case management capacity (i.e., hiring and training of caseworkers).
- Some clients identified through the Enhanced Service Delivery intake process have been referred to other programming such as the Aboriginal Skills and Employment Training Strategy, provincial programs for job training, directly to employers for jobs or for job training, health services, etc.
- During the initial Enhanced Service Delivery caseworker assessments of Income Assistance clients, some immediately found employment. These clients were never referred to FNJF.
- Based on interviews with caseworkers, it was suggested that a large proportion of Enhanced Service Delivery clients are multi-barriered and may require greater life and essential skills, as well as pre-employability supports prior to referral to FNJF. However, data does not exist to support or refute this suggestion.
- FNJF targets may have been initially set too high (i.e., it is unclear whether the delays in implementing Enhanced Service Delivery were taken into account or if the proportion of multi-barriered clients was underestimated when the targets were set for FNJF referrals). Additionally, there was no plan to refer Enhanced Service Delivery clients from the Enhanced Service Delivery directly to jobs or to employers for training without first going through FNJF service providers.
In the first year of the Income Assistance Reform, the lower than expected number of client referrals resulted in the re-profiling of $8 million in FNJF funding to subsequent years, then $11.9 million of 2014-2015 funds was re-profiled. Now that these delays have been resolved and sufficient time has passed to allow for clients to receive Enhanced Service Delivery supports, respondents expect that referrals to FNJF would increase.
5.2.3 Client Profile
Table 4 below presents the profile of Enhanced Service Delivery clients referred to FNJF. The client profile analysis is based on the 1,272 individuals who participated in FNJF between April 2013 and June 2015.
| Characteristic | Number | Percent (%) |
|---|---|---|
| Participants | 1272 | 100% |
| Gender | ||
| Male | 725 | 57% |
| Female | 534 | 42% |
| Age category | ||
| 18-24 | 1132 | 89% |
| 25+ | 140 | 11% |
| Marital Status | ||
| Married | 127 | 10% |
| Single | 1145 | 90% |
| Number of Dependent Children | ||
| 0 child | 1043 | 82% |
| 1 child | 165 | 13% |
| 2 child | 51 | 4% |
| 3 child+ | 25 | 2% |
| Childcare Need | ||
| No | 1221 | 96% |
| Yes | 51 | 4% |
| Action Plan Duration | ||
| 52 weeks or less | 432 | 34% |
| 53 weeks or more | 38 | 3% |
| Unreported (still in programming) | 776 | 61% |
| Social Assistance (SA) Recipients | ||
| SA Non-recipient | 356 | 28% |
| SA Recipient | 916 | 72% |
Source: ESDC's Aboriginal Standard Data File (April 2013 to June 2015) |
||
More males than females participated in FNJF (57 percent versus 42 percent). As expected, the majority of FNJF clients were within the targeted age range of 18 to 24 (89 percent). The remaining 11 percent of clients were 25 years of age and older. Individuals falling outside of the target age criteria may be funded by the FNJF when they have been accepted for participation by an Enhanced Service Delivery provider if funding is available. The majority of FNJF clients were single (90 percent), and did not have children (82 percent).
At the time of the analysis, the majority of clients (61 percent) had not yet completed their action plans as they were still participating in programming. However, the evaluation found that the one-third of FNJF clients who had (34 percent) completed their action plans did so in one year or less. A small number of clients (three percent) required more than one year to complete their action plans. As FNJF matures, a clearer sense of average length of time for clients to complete their action plans will be available.
It is important to note that the analysis of FNJF client data suggested that just over one-quarter of clients (28 percent) were recorded as not being in receipt of Income Assistance. Of these clients not on Income Assistance, the majority were from Quebec and Alberta. The evidence suggests that this can be attributed to a data entry error. Further investigation uncovered that some FNJF caseworkers were inadvertently recording clients as not being on Income Assistance after having found employment.
Recommendation 3: It is recommended that ESDC communicate to all FNJF service providers the data capture protocols that enable the accurate and consistent recording of the client status of being on Income Assistance.
5.2.4 Income Assistance Reform Outcomes
The objectives of the Income Assistance Reform are to reduce the number of youth between the ages of 18 – 24 on income assistance and to assist them to find employment or return to school. The findings below suggest that the Income Assistance Reform is achieving its immediate outcomes of increasing the Income Assistance exit rates. However the evaluation is unable to report on the more intermediate outcomes since the program is still in its early implementation stages. As such, it is not known whether clients have found employment that is sustainable over time.
Income Assistance Exits
During 2013-2014 and 2014-2015, 2,041 clients exited from Income Assistance, exceeding the target of 1,388 clients for that period by 653 clients (See Table 5). By March 2017, Income Assistance Reform is expecting 4,277 clients to exit Income Assistance.
| Fiscal Year | 2013-2014 | 2014-2015 | Total | |||
|---|---|---|---|---|---|---|
| Fiscal Quarter | Q4 | Q1 | Q2 | Q3 | Q4 | |
| Client Exits from Income Assistance to Employment or Education (per quarter) | 108 | 376 | 497 | 490 | 570 | 2,041 |
Source: INAC's Income Assistance / Enhanced Service Delivery Data Collection Instrument. |
||||||
An analysis of Income Assistance exits for 18 to 24 year olds in the 27 participating communities in the year prior to (2013-2014) and the year after the Enhanced Service Delivery introduction (2014-2015) was conducted (See Figure 3). It found that in 2013-2014 approximately seven percent of 18 to 24 year olds exited from Income Assistance. The following year, this increased by 22 percentage points to 29 percent, suggesting that Income Assistance Reform had an effect on the number of individuals exiting from Income Assistance to either employment or education.Footnote 42
Figure 3: Change in the Mean Proportion of Exits Relative to the Total Number if Income Assistance Clients, Aged 18 to 24 (2013-14 to 2014-15)
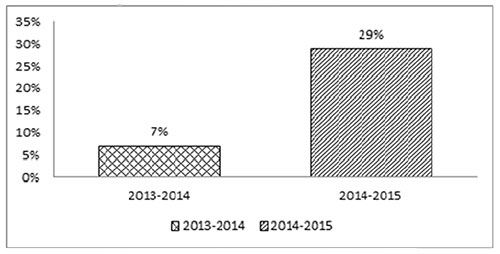
Source: INAC's Income Assistance / Enhanced Service Delivery Data Collection Instrument.
Text alternative for Figure 3: Change in the Mean Proportion of Exits Relative to the Total Number if Income Assistance Clients, Aged 18 to 24 (2013-14 to 2014-15)
This is a bar graph which illustrates the changes in the mean proportion of exists relative to the Total Number of IA Clients, aged 18 to 24, between the fiscal years 2013-2014 to 2014-2015. The x axis illustrates the two fiscal years examined, 2013-2014 and 2014-2015. The y axis lists percentages from 0% to 35%. There are two bars. The first bar is for fiscal year 2013-2014, and it show the number of exits from IA as 7%. The second bar, representing fiscal year 2014-2015, shows the number of IA exists has increased to 29%.
Interviewees stated that clients who participated in and completed the Enhanced Service Delivery programming were more employable due to the assets or skills acquired during their training. Interviewees also stated that the benefits of participation in the Enhanced Service Delivery were greater than just increased employability; clients also showed higher levels of motivation and increased self-esteem.
Labour Market Outcomes
Further analysis was performed on FNJF clients who started an intervention during 2013-2014 and 2014-2015 and closed off their Employment Action Plan with a reported outcome.Footnote 43 Out of the 1,217 FNJF clients who started an intervention, 493 or 41 percent closed off their Employment Action Plan.
Overall, 51 percent of these clients found employment, eight percent returned to school and 23 percent are still looking for work. The remaining 24 individuals (five percent) were no longer in the workforce.
All four types of FNJF interventions were generally effective in assisting clients to find employment or return to school. More specifically, the sum of proportions of FNJF clients who found employment and returned to school (shown separately in Table 6) is 57 percent for Skills Development, 41 percent for Targeted Wage Subsidy, 88 percent for Job Creation Partnership, and 62 percent for Employment Assistance Services. Note that of the FNJF interventions offered, the majority of clients' main intervention was either Employment Assistance Services (239 clients or 48 percent) or Skills Development (154 clients or 31 percent). Fifteen percent (76 clients) and five percent (24 clients) of clients had a main intervention of either Targeted Wage Subsidy or Job Creation Partnership respectively.
These findings are consistent with the results achieved by other ESDC programs offering similar labour market intervention types to a population that is in general more work ready. These are quite positive outcomes considering the low level of employability of Income Assistance Reform clients compared to the usual clientele of unemployed for these types of labour market interventions. Although evaluators did not benefit from data to carry a detailed comparative analysis of the clients, the Income Assistance Reform client is a young population with high Income Assistance dependency rates, little or no labour market experience, often lacking basic skills and education and facing other barriers to employment (see Figure 2).
While these results are relatively positive, it is expected that as the program matures, the proportion of program participants with multiple barriers and low level of employability will increase, which may result in lower overall program outcomes or require more time in programming to achieve similar outcomes.
Despite the relative successes described above, it was noted that Income Assistance Reform lacked consistent client monitoring and supports following their employment and/or return to school. Post-program client supports were identified as necessary to ensure that clients who are seasonally employed, employed in short-term low-skilled jobs, or encounter setbacks do not regress back into Income Assistance dependency.
| Outcome Results / Principal Intervention Type |
Skills Development |
Targeted Wage Subsidy |
Job Creation Partnership |
Employment Assistance Service |
Total |
|---|---|---|---|---|---|
Employed / Self-employed |
70 | 29 | 15 | 139 | 253 |
| 45% | 38% | 63% | 57% | 51% | |
Return to school |
19 | 2 | 6 | 11 | 38 |
| 12% | 3% | 25% | 5% | 8% | |
Unemployed but available for work |
44 | 14 | 3 | 52 | 113 |
| 29% | 18% | 13% | 22% | 23% | |
No longer in labour force |
10 | 8 | 0 | 6 | 24 |
| 6% | 11% | 0% | 3% | 5% | |
Client could not be reached |
11 | 23 | 0 | 31 | 65 |
| 7% | 30% | 0% | 13% | 13% | |
Total |
154 | 76 | 24 | 239 | 493 |
| 100% | 100% | 100% | 100% | 100% | |
Source: ESDC's Aboriginal Standardized Data File of FNJF Clients who reported outcome result during the fiscal year 2013-14 and 2014-15. |
|||||
However, the evidence suggests that outcomes may vary for FNJF clients who face multiple barriers. Overall, clients with no barriers (68 percent) were more likely to find employment or return to school than clients with one (50 percent), two (56 percent) or three or more (54 percent) barriers to employment (see Table 7). As the number of barriers to employment increased from one (three percent), two (eight percent) to three or more (11 percent), so did the proportion of clients who were no longer in the labour force. The findings suggest that barriers and, to some extent, those with multiple barriers, exert an influence on client success.
| Outcome / Barriers |
No barriers |
One barrier |
Two barriers |
Three or more barriers |
Total |
|---|---|---|---|---|---|
Employed / self-employed |
102 | 44 | 32 | 75 | 253 |
| 56% | 44% | 51% | 49% | 51% | |
Return to school |
22 | 6 | 3 | 7 | 38 |
| 12% | 6% | 5% | 5% | 8% | |
Unemployed but available for work |
40 | 36 | 9 | 28 | 113 |
| 22% | 36% | 15% | 19% | 23% | |
No longer in labour force |
0 | 3 | 5 | 16 | 24 |
| 0% | 3% | 8% | 11% | 5% | |
Client could not be reached |
17 | 12 | 12 | 24 | 65 |
| 9% | 12% | 20% | 16% | 13% | |
Total |
181 | 101 | 61 | 150 | 493 |
| 100% | 100% | 100% | 100% | 100 | |
Source: ESDC's Aboriginal Standardized Data File of FNJF Clients who reported outcome result during the fiscal year 2013-14 and 2014-15. |
|||||
For Enhanced Service Delivery participation, gender appears to have a slight influence on client outcomes. The total number of Enhanced Service Delivery client exits from Income Assistance for 2014-2015 (1,933 clients) reveals that male clients (58 percent) are slightly more likely to exit from Income Assistance for employment or education than female clients (42 percent). Similarly, for FNJF, gender appears to have an influence on clients' outcomes. FNJF male clients (60 percent) are more likely to find employment or return to school than female clients (40 percent). Male clients were more likely to find employment than females (63 percent versus 36 percent), whereas female clients were more likely to return to school than male clients (61 percent versus 39 percent). In terms of gender, this finding suggests that employment outcomes for females will be realized in the longer term as they are returning to school in greater numbers than males.
Employer partners and clients interviewed as part of the site visits emphasized the benefits of Income Assistance Reform. From an employer perspective, respondents noted that the Initiative identified and trained suitable Aboriginal candidates, making them "job ready." This saved employers time and money, while avoiding the risk of investing resources on unsuitable candidates. In addition, all interviewed clients reported positive experiences with Income Assistance Reform, and were satisfied with the supports and services received. Those who found employment stated that they would not have done so without the support of their case managers and the training offered. Clients identified that participation in the Initiative allowed them to build their confidence, set goals, learn to work with others and understand employer expectations. Overall, clients reported an enhanced sense of accomplishment as they successfully completed their training. Employed clients reported that they were setting a positive example for their families and their communities.
Though not conclusive, these findings suggest that the Income Assistance Reform is achieving its immediate outcomes. Once the program has sufficiently matured and employment income data becomes available, an impact analysis will determine whether the Income Assistance Reform can be attributed with sustainably reducing the number of youth relying on income assistance.
5.3 Efficiency and Economy
It is too early in the Initiative's lifecycle to reliably assess cost-effectiveness. Future evaluation work will be better positioned to examine this as well as the incremental impacts of Income Assistance Reform.
The evaluation found that the proportion of total spending on all aspects of Enhanced Service Delivery, including internal operations, maintenance, and salary comprises less than one percent of program expenditures. This suggests a strong level of program efficiency from the point of view of internal spending versus grants and contributions (Refer to Annex E for further details).
A simple cost analysis, based on ESDC contributions, was undertaken to calculate the average FNJF participant cost for 2014-2015. The Aboriginal Skills and Employment Training Strategy evaluation findings served as the most appropriate comparison for FNJF. In 2014-2015, FNJF service providers claimed an estimated $6.2 million in expenses, serving 1,093 clients. The average cost per client for FNJF is estimated at $5,650 for 2014-15. This is lower than the Aboriginal Skills and Employment Training Strategy participants at $6,100 in 2012-13.
The evaluation revealed some areas of potential inefficiencies:
Funding for Enhanced Service Delivery is proposal based and approved annually. FNJF service providers, on the other hand, enter into multi-year funding agreements. Interviewees identified the need to have secure multi-year or ongoing funding for the Enhanced Service Delivery, in order to allow communities to properly plan for the future. Waiting to be notified about funding renewals was identified as creating "stops and starts" with programming, resulting in uncertainty and stress for clients and staff. All site visit interviews revealed that the late notification of 2014-2015 funding resulted in programming slowdowns and uncertainty. Three sites had begun to wind down activities, lay off staff, and paused client interventions while awaiting funding approval. A cascading effect was felt by FNJF, as slowdowns in Enhanced Service Delivery influences when clients can be referred to FNJF, due to paused Enhanced Service Delivery client interventions.
Recommendation 4: It is recommended that INAC explore the feasibility of introducing multi-year funding agreements for the Enhanced Service Delivery.
5.4 Potential Integration between the Enhanced Service Delivery and FNJF
Considering the communities included in the evaluation, the level of integration between the Enhanced Service Delivery and FNJF varied by community. In some of the studied communities, the Enhanced Service Delivery and FNJF are more fully integrated. For example, in Quebec, a whole team worked closely together to assess, assign interventions and monitor client progress. At one of the sites visited in British Columbia, evaluators observed one caseworker being responsible for the delivery of both funding streams. The caseworker continually assesses clients and moves them from one intervention to the next, often without the clients even being aware that they are benefiting from different funding sources. In other communities, there are distinct Enhanced Service Delivery and FNJF caseworkers with separate offices and case files per client. For this latter design, the process may not be as seamless and under this approach, a few issues were raised about difficulties when referring clients from the Enhanced Service Delivery to FNJF.
In a study conducted by Brock and Harknett (1998) that randomly assigned individuals to either an integrated or a dual caseworker model, the authors found that an integrated case management approach resulted in a significant difference in:
- The rate of referral for sanctions;
- The rates at which clients were able to maintain at least 15 hours/week of employment; and
- Rates of participation in workshops, job searches, and training activities.
In all the cases where the difference was significant, integrated cases produced significantly better employment rates, earnings and reduced Income Assistance reliance for participants relative to the comparison group.Footnote 44
Building an ongoing relationship with clients is one of the most important elements of the case management process, as it establishes a level of trust required to move a client forward through their Action Plan. Key informants indicated that the transfer from Enhanced Service Delivery to FNJF caseworkers may interrupt client progression towards employability, as the client needs to re-establish a trusting relationship with their new caseworker.
The distances between the Enhanced Service Delivery and FNJF offices were also identified as a barrier for clients to access FNJF. In several locations visited by evaluators, the FNJF office was over 30 kilometers outside of the community, and in one situation, the FNJF office was over 200 kilometers away. To compensate, some Enhanced Service Delivery caseworkers are taking on additional FNJF type tasks (e.g., speaking with employers on behalf of clients, buying equipment for clients' jobs, etc.). As was previously mentioned, many clients face transportation issues that prohibit them from travelling far distances to access programming. Consideration should be given to improve client access to Enhanced Service Delivery and FNJF services. This may be achieved by offering combined services through the service provider who is in closest proximity to clients in situations where distance between offices prevents easy access by clients.
Based on key informant interviews and site visits, there is potential for overlap and duplication with respect to the roles and responsibilities of Enhanced Service Delivery and FNJF service providers. There is evidence that prior to Income Assistance Reform, both Income Assistance and the Aboriginal Skills and Employment Training Strategy agreement holders offered life and essential skills supports, as well as employment training. With the creation of Income Assistance Reform, the expectation was that these interventions were to be delivered separately and in a complementary manner by each proponent. After the implementation of Income Assistance Reform, some duplication in program activities was still observed since work continued to be carried as it had previously been done in the past by each Enhanced Service Delivery and FNJF service provider. Furthermore, with two funded service delivery organizations and a two caseworker system, clients are case managed by two caseworkers; both caseworkers create action plans and refer clients to relevant interventions (pre-employment supports vs job training); and client information is tracked in two separate databases.
One possible consideration for future programming is the simplification of the funding application and reporting processes for service providers. For example, the current application process requires that First Nations service providers complete two funding applications, one for INAC's Enhanced Service Delivery and another for ESDC's FNJF. The process could be simplified by having First Nations submit a single funding application to one department that addresses both Enhanced Service Delivery and FNJF funding streams. Similarly, the current reporting process requires First Nations to prepare two reports, one delivered to INAC for Enhanced Service Delivery and another delivered to ESDC for the FNJF. Simplifying the proposal and reporting processes would reduce the administrative burden on First Nation communities. If INAC was able to move to multi-year funding agreements, as recommended in this report, the above consideration would be possible.
Additionally, efforts should be made to ensure clients have easy access to personalized services by integrating the provision of both Enhanced Service Delivery and FNJF services. This is particularly important in rural communities where distance may be a barrier to accessing program services. An integrated, seamless case management process would eliminate the need for a client referral strategy; eliminate ambiguities with respect to roles and responsibilities inherent in a two caseworker approach; require a single client assessment and action plan; and track all interventions by client resulting in an improved analysis and understanding of clients for monitoring, program and policy decisions, and evaluation purposes.
6. Conclusions and Recommendations
6.1 Conclusions
The Government of Canada needs to ensure the modernization of Income Assistance programming on-reserve, and the Income Assistance Reform initiative is a positive step toward implementing active measuresFootnote 45. There is a need for programming designed to increase employability of Income Assistance clients, particularly given the high rate of Income Assistance dependency (particularly among Aboriginal youth on-reserve) and increases in Income Assistance expenditures. INAC and ESDC, along with First Nation service, have a significant role to play in this regard. As the funding of social services is within the purview of INAC, it is essential that Income Assistance service providers be provided with the ability to case manage their clients to better promote employability and reduced reliance on Income Assistance. ESDC's role in providing labour market programs falls under the mandate of the Department of Human Resources and Skills Development Act (S.C. 2005, C.34).
The delayed roll-out of the Income Assistance Reform initiative resulted in very limited data to inform performance of the program to date. Additionally, there are some key limitations in the data collection and reporting for both INAC and, to a lesser degree, ESDC. That said, there are strong indications that implementation has led to positive outcomes. For example, there was an observed increase in Income Assistance exits (22 percent) compared to the year prior to program implementation and 2,041 clients exited from Income Assistance Reform to employment or education. It is important to consider the applicability of current policies and guidelines regarding eligibility and reach given the issues faced by First Nation youth. To that end, this evaluation has highlighted several areas where further discussion is needed, including the duration for participation, the target age cohort and process for interruptions in service.
To date, more than 6,800 Income Assistance clients, aged 18 to 24, have entered into Enhanced Service Delivery case management, which exceeds the initial targets. However, initial referrals to FNJF were lower than initially targeted. Several reasons were identified for the lower than anticipated referrals. For example, more clients than expected required greater than the six months of life and essential skills interventions originally forecasted; and direct referrals of job ready clients to employment or to other skills development and job training services. It was expected that referrals to FNJF would increase now that sufficient time has passed to allow for clients to receive required pre-employment skills development supports. Additionally, there are indications that the variety of supports and services received by clients has been positive both for them and employers.
Given that Income Assistance Reform has only been implemented in select communities, it is too early in the Initiative's life cycle to reliably assess the cost-effectiveness of program delivery. A simple cost analysis found that the average cost for an FNJF participant was $5,650 for 2014-15. The evaluation identified some areas of potential efficiency. These include integrating and streamlining the delivery of interventions and examining the feasibility of multi-year funding agreements for Enhanced Service Delivery funding recipients. For example, late notification of 2014-2015 funding led to staff layoffs and paused client interventions in some delivery sites. This inevitably caused delayed referrals to the FNJF.
6.2 Recommendations
Most of the recommendations in this report stem from aspects of data collection that are intended to improve ongoing performance measurement and to support future policy, research, and evaluation work. There were concerns over the completeness and reliability of some of the data. For example, the socio-demographic and intervention data collected by the Enhanced Service Delivery was insufficient to adequately describe participants and the types of interventions in which they participated. An examination of the data collection strategy by both departments is needed to more efficiently capture and link participant data to ensure effective client monitoring and analysis of outcomes and impacts. Finally, funding the Enhanced Service Delivery on a multi-year basis would reduce service interruptions and improve delivery of the Income Assistance Reform. Based on the findings of this evaluation, the following recommendations are made:
Recommendation 1: It is recommended that INAC ensure that data collection instruments and processes used by service providers consistently and accurately capture adequate socio-demographic and program outcome information on clients.
Recommendation 2: It is recommended that INAC and ESDC collaborate to explore ways to more efficiently capture and link information collected by each department to allow for strengthened client monitoring and analysis of outcomes and impacts of the Income Assistance Reform.
Recommendation 3: It is recommended that ESDC communicate to all FNJF service providers the data capture protocols that enable the accurate and consistent recording of the client status of being on Income Assistance.
Recommendation 4: It is recommended that INAC explore the feasibility of introducing multi-year funding agreements for the Enhanced Service Delivery.
Annex A – Income Assistance Reform Logic Model

Text alternative for Annex A – Income Assistance Reform Logic Model
The logic model is oriented from top to bottom, and demonstrates how key program activities contribute towards the Department's strategic outcomes.
The top row, labelled "Key Activities", is composed of two boxes. The box on the left is: "Program Management: INAC Headquarters / Regions Social Programs", and has two sub-bullets of "Building Partnerships", and "Gather and Share Information". The box on the rights is: "Program Management: ESDC ASETS Program", and has two sub-bullets: "Planning and Reporting Tool, Systems and Support"; and "Manage Contribution agreements, monitoring". An arrow points from the first to the second row.
The second row, labelled "Outputs" is composed of one box. This box is: "Social Supports and Services – which now includes Enhanced Service Delivery and the FNJF – that will result in the development and monitoring of individual and employment action plans for youth aged 18-24". The second row box overlaps onto the three third row boxes.
The third row, labelled "Immediate Outcomes," is composed of three boxes. The box on the left is: "Eligible men, women, and children in need or at-risk have access and use supports and services to meet basic and special needs." The box in the middle is: "Eligible men and women in need have access and use supports and services that help them to transition to and remain in the workforce." The box on the right is: "Increase participation of First Nations Income Assistance clients in Demand-Driven Skills Development Program." An arrow points from c the box on the left to the box in the middle, and an arrow points from the box in the middle and the box on the right indicating a sequential relationship. Flowing from the box on the far right, a line becomes two arrows that connect the boxes in row three to the two boxes in row four.
The fourth row, labelled "Intermediate Outcomes", is composed of two boxes. The box on the left is: "Men and women are employable and able to become and/or remain attached to the workforce". The box on the right is: "Improved employability of First Nations Income Assistance clients". Two arrows from the boxes in the fourth row and connect them to the two boxes in the fifth row.
The fifth row at the bottom of the model, Labelled "Ultimate Outcomes", is composed of two boxes. The box on the left is: "First Nation men, women, and children are active participants in social development within their communities". The box on the right is: "First Nation Income Assistance clients on-reserve are employed and integrated into the labour market."
Annex B - Income Assistance Program for First Nation Communities (2013)

Text alternative for Annex B - Income Assistance Program for First Nation Communities (2013)
Overall Map Description
This map shows the on-reserve Income Assistance dependency rate ranges for First Nations participating in the Income Assistance Program, based on data for fiscal year 2011-2012. The rate is calculated on the basis of the total number of First Nation residents divided by the total number of Income Assistance beneficiaries. Rates are grouped in three clusters. The threshold for each cluster is determined based on the average provincial/Yukon Social Assistance rate (5%) and the national average of on-reserve Income Assistance dependency rate (36%). Rates are represented by three colors: red dots represent First Nation communities (189 communities) in the category of having 37% and above of its on-reserve population receiving Income Assistance; yellow dots represent First Nation communities (264 communities) in the category of having between 6% and 36% of its on-reserve population receiving Income Assistance, and green dots represent First Nation communities (35 communities) in the category of having between 0 and 5 % of its on-reserve population receiving Income Assistance.
Provincial Description
Note
Northwest Territories and Nunavut First Nations are not included in this map as social assistance programming is managed by their respective territorial governments.
British Columbia
In British Columbia there are 186 First Nations communities participating in the Income Assistance program. 35 communities are in the category of having more than 37% of its on-reserve population receiving Income Assistance, 98 others are in the category between 6% and 36%, and 20 communities are in the category between 0% and 5%. The remaining 33 First Nation communities have their program managed either by their related Tribal Council or Administrative Organization, or are self-governing.
Alberta
In Alberta there are 45 First Nation Communities participating in the Income Assistance program. 15 communities are in the category of having more than 37% of its on-reserve population receiving Income Assistance, 21 are in the category between 6% to 36% and one (1) community is in the category between 0% and 5%. The remaining height (8) First Nation communities have their program managed either by their related Tribal Council or by another First Nation.
Saskatchewan
In Saskatchewan there are 69 First Nation communities participating in the Income Assistance program. 50 communities are in the category of having more than 37% of its on-reserve population receiving Income Assistance, and the remaining 19 communities are in the category between 6% and 36%.
Manitoba
In Manitoba there are 62 First Nation communities participating in the Income Assistance program. 53 communities are in the category of having more than 37% of its on-reserve population receiving Income Assistance, and the remaining nine (9) communities are in the category between 6% and 36%.
Ontario
In Ontario there are 110 First Nation communities participating in the Income Assistance program. 14 communities are in the category of having more than 37% of its on-reserve population receiving Income Assistance, 78 communities are in the category between 6% and 36%, and six (6) communities are in the category between 0% and 5%. The remaining 12 communities have their program managed either by their related Tribal Council or administering organization, or by another First Nation.
Québec
In Québec there are 30 First Nation communities participating in the Income Assistance program. Four (4) communities are in the category of having more than 37% of its on-reserve population receiving Income Assistance, 23 communities are in the category between 6% and 36%, and the remaining three (3) communities are in the category between 0% and 5%.
Nova Scotia
In Nova Scotia there are 13 First Nation communities participating in the Income Assistance program. Nine communities are in the category of having more than 37% of its on-reserve population receiving Income Assistance, three (3) communities are in the category between 6% and 36%, and one (1) community is in the category between 0% and 5%.
Prince Edward Island
In Prince Edward Island there are two (2) First Nation communities participating in the Income Assistance program. Both are in the category of having between 6 and 36% of its on-reserve population receiving Income Assistance.
New-Brunswick
In New-Brunswick there are 15 First Nation communities participating in the Income Assistance program. Seven (7) communities are in the category of having more than 37% of its on-reserve population receiving Income Assistance, seven (7) communities are in the category between 6% and 36%, and one (1) community is in the category between 0% and 5%.
Newfoundland and Labrador
In Newfoundland and Labrador there are two (2) First Nation communities participating in the Income Assistance program. One community is in the category of having between 6% and 36% of its on-reserve population receiving Income Assistance, and the other community is in the category between 0% and 5%. One other community is shown as self-governing.
Yukon
In Yukon Territory there are six (6) First Nation communities participating in the Income Assistance program. Two (2) communities are in the category of having more than 37% of their on-reserve population receiving Income Assistance, two (2) communities are between 6% and 36%, and the remaining two (2) communities are in the category between 0% and 5%.
Annex C –Income Assistance Reform Providers
Provinces/Territories |
Enhanced Service Delivery Proponents (Participating First Nations) |
# of Enhanced Service Delivery Recipients | # of participating First Nations | FNJF Proponents |
|---|---|---|---|---|
| Prince Edward Island | Mi'kmaq Confederacy of Prince Edward Island (Abegweit First Nation, Lennox Island) |
1 | 2 | Mi'kmaq Confederacy of Prince Edward Island |
Quebec |
Listuguj Mi'gmaq Government | 1 | 1 | Commission de développement des ressources humaines des Premières Nations du Québec |
| Innu Takuaikan Uashat mak Mani-Utenam | 1 | 1 | ||
| Kahnawake | 1 | 1 | ||
| Atikamedkws de Manawan | 1 | 1 | ||
| Conseil des Montagnais du Lac St.-Jean-Mashteuiatsh | 1 | 1 | ||
Manitoba |
Dakota Ojibway Tribal Council (Sandy Bay, Long Plain) |
1 | 2 | First People Development Inc. |
| Brokenhead | 1 | 1 | ||
| Fort Alexander (Sagkeeng) | 1 | 1 | ||
Saskatchewan |
Battleford Agency Tribal Chiefs (Moosomin, Red Pheasant, Saulteaux, Sweetgrass, Ahtahkakoop) |
1 | 5 | Saskatchewan Indian Training Assessment Group Inc. |
| Saskatoon Tribal Council (Muskoday, Whitecap, One Arrow, Mistawasis, Muskeg Lake, Yellowquill, Kinistin) |
1 | 7 | ||
| Meadow Lake Tribal Council (Canoe Lake, Ministikwan, Buffalo River, EnglishRiver, Waterhen First Nation, Birch Narrows, Makwa Saghaiehcan, Flying Dust, Clearwater River) |
1 | 9 | ||
| Yorkton Tribal Council (Kahkewistahaw, Keesekoose, Sakimay, Cote, The Key, Ocean Man) |
1 | 6 | ||
| Lac La Ronge Indian Band | 1 | 1 | ||
Alberta |
Tribal Chief Ventures Inc. (Beaver Lake Cree Nation, Cold Lake, Frog Lake, Heart Lake, Whitefish Lake First Nation No. 128, Kehewin Cree Nation) |
1 | 6 | Tribal Chiefs Employment and Training Society |
| Maskwacis Employment Centre (Ermineskin Cree Nation, Samson Cree Nation, Louis Bull Tribe) |
1 | 3 | Six Independent Alberta First Nations of Hobbema |
|
| Paul Band | 1 | 1 | ||
| Blood Tribe | 1 | 1 | Community Futures Treaty Seven | |
British Columbia |
Okanagan Indian Band Centre of Excellence (Osooyos, Westbank, Penticton, Okanagan, Upper Similkameen, Lower Similkameen) |
1 | 6 | Okanagan Training and Development Council |
| Seabird Island Centre of Excellence (Seabird Indian Band, Chawathil, Shxwowhamel, Squiala, Cheam, Union Bar) |
1 | 6 | Sto:lo Aboriginal Skills and Employment Training | |
| Nuu-chah-nulth Tribal Council Centre of Excellence (Ditidaht, Ehattesaht/Chinehkint, Hupacasath, Ka:'yu:'k't'h'/Che:k:tles7et'h', Mowachaht/Muchalaht, Tla-o-qui-aht, Yuułu?ił?ath) |
1 | 7 | Nuu-chah-nulth Employment and Training Program |
|
| Yukon | Ta'an Kwach'an Council | 1 | 1 | Council of Yukon First Nations |
| TOTAL | 22 Enhanced Service Delivery Proponents (70 First Nations) |
22 | 70 | 11 FNJF Proponents |
P/T |
Enhanced Service Delivery Proponents (Participating First Nations) |
# of Enhanced Service Delivery Recipients | # of participating First Nations | FNJF Proponents |
|---|---|---|---|---|
QC |
Lac Simon | 1 | 1 | Commission de développement des ressources humaines des Premières Nations du Québec |
| Mamit Innuat (Ekuanitshit, Unamen Shipu, Pakua Shipi) |
1 | 3 | ||
| Pessamit | 1 | 1 | ||
SK |
File Hills Qu'Apelle Tribal Council (Carry the Kettle, Little Black Bear, Muscowpetung, Nekaneet, Okanese, Pasqua, Peepeekisis, Piapot, Standing Buffalo, Star Blanket) |
1 | 10 | Saskatchewan Indian Training Assessment Group Inc. |
| Agency Chiefs Tribal Council (Big River, Pelican Lake, Witchekan Lake) |
1 | 3 | ||
| TOTAL | 5 Enhanced Service Delivery Proponents (18 First Nations) |
5 | 18 |
| Ontario Work Providers (Participating First Nations) |
FNJF Providers |
|---|---|
| Six Nations of the Grand River (Bay of Quinte Mohawk, Bearfoot Onondago, Deleware, Konadaha Seneca, Lower Cayuga, Lower Mohawk, Niharondasa Seneca, Oneida, Onondaga Clear Sky, Tuscarora, Upper Cayuga, Upper Mohawk, Walker Mohawk) | Grand River Employment and Training |
| Niigaaniin Program – North Shore Tribal Council (Atikameksheng Anishinawbek, Wahnapitae), Batchewana | North Shore Tribal Council |
| Mississaugas of the Credit | Aboriginal Labour Force Development Circle |
| Chippewas of Nawash | |
| Curve Lake | |
| Algonquins of Pikwakanagan (Golden Lake) | |
| Mohawks of the Bay of Quinte | |
| Chippewas of Rama | Ogemawahj Tribal Council |
| Beausoleil |
Annex D – Definitions of FNJF Interventions
- Skills Development: helps individuals obtain basic to advanced employment skills. It provides direct assistance to individuals for training and, where applicable, contributions to provinces and territories—or to provincially/territorially funded training institutions—to cover costs not included in tuition fees. Skills Development participants may receive financial assistance to defray basic living costs, tuition and other incremental training-related costs.
- Targeted Wage Subsidies: furthers the work experience of participants by encouraging employers to hire unemployed individuals. It does so by providing financial assistance, which covers a portion of the new hires' wages, as well as some employment-related costs.
- Job Creation Partnerships: provide individuals with opportunities to gain work experience leading to ongoing employment. Limited-term projects that offer work experience receive financial assistance. Because these employment opportunities are often generated through locally developed projects in the public and non-profit sectors, Job Creation Partnerships also support the community and the local economy.
- Employment Assistance Services: provide assistance to unemployed persons who require assistance to enter or return to the labour force through the following three types of interventions:
- Employment Services comprise a variety of services that support participants as they prepare to enter or re-enter the labour force. These services range from job search assistance for job-ready clients to the development of in-depth return-to-work action plans for clients facing multiple employment barriers.
- Group Services focus on short-term job search and re-entry activities.
- Individual Counselling addresses more complex issues in the case management process and may involve a series of in-depth sessions, particularly when clients face multiple employment barriers.
Annex E – Income Assistance and Enhanced Service Delivery Resources (2009-2010 to 2013-2014)
| Sum of Actual | Fiscal Year | ||||||
|---|---|---|---|---|---|---|---|
| Authority | Budget Activity Code and Description | 2009-10 | 2010-11 | 2011-12 | 2012-13 | 2013-14 | TOTAL |
Salary Vote 1 |
P3100 - AFA block/core funding for income assistance | 179 | 179 | ||||
| P3101 - income assistance - basic needs | 58,271 | 447,618 | 718,078 | 757,465 | 22,692 | 2,004,124 | |
| P3103 - income assistance - service delivery | 1,755,321 | 2,136,504 | 2,581,566 | 2,688,378 | 110,623 | 9,272,391 | |
| P3115 - income assistance - administration | 5,774,331 | 5,774,331 | |||||
| SUB-TOTAL | 1,813,592 | 2,584,122 | 3,299,644 | 3,446,022 | 5,907,645 | 17,051,025 | |
O&M Vote 1 |
P3101 - income assistance - basic needs | 92,411 | 89,727 | 200,247 | 207,248 | 21,172 | 610,804 |
| P3103 - income assistance - service delivery | 490,552 | 535,425 | 592,793 | 290,903 | 152,180 | 2,061,851 | |
| P3115 - income assistance - administration | 580,121 | 580,121 | |||||
| SUB-TOTAL | 582,963 | 625,151 | 793,039 | 498,151 | 753,472 | 3,252,777 | |
Statutory Vote 1 |
P3100 - AFA block/core funding for income assistance | 29 | 29 | ||||
| P3101 - income assistance - basic needs | 10,407 | 78,127 | 194,546 | 122,713 | 3,655 | 409,449 | |
| P3102 - income assistance - special needs | 10,540 | 10,540 | |||||
| P3103 - income assistance - service delivery | 290,085 | 343,680 | 400,673 | 435,843 | 17,820 | 1,488,101 | |
| P3115 - income assistance - administration | 930,188 | 930,188 | |||||
| SUB-TOTAL | 300,492 | 421,807 | 605,759 | 558,585 | 951,663 | 2,838,306 | |
Contributions Vote 10 |
P3100 – AFA block/core funding for income assistance | 293,152,098 | 296,255,677 | 298,442,981 | 301,850,619 | 304,355,207 | 1,494,056,582 |
| P3101 - income assistance - basic needs | 449,444,303 | 462,161,809 | 468,781,450 | 473,911,511 | 470,981,881 | 2,325,280,955 | |
| P3102 - income assistance - special needs | 22,498,576 | 21,690,909 | 22,830,194 | 23,053,732 | 20,234,451 | 110,307,862 | |
| P3103 - income assistance - service delivery | 35,077,379 | 36,761,148 | 45,765,890 | 47,444,475 | 46,573,150 | 211,622,042 | |
| P3104 - income assistance reform enhanced service delivery system | 11,395,395 | 19,711,281 | 31,106,676 | ||||
| SUB-TOTAL | 800,172,356 | 816,869,543 | 835,820,514 | 857,655,733 | 861,855,971 | 4,172,374,117 | |
| Grants Vote 10 | P3101 - income assistance - basic needs | 2,827,409 | 2,973,872 | 2,693,861 | 3,127,073 | 4,003,706 | 15,625,922 |
| P3102 - income assistance - special needs | 33,889 | 47,840 | 37,212 | 35,618 | 41,069 | 195,628 | |
| SUB-TOTAL | 2,861,299 | 3,021,712 | 2,731,073 | 3,162,691 | 4,044,775 | 15,821,550 | |
| GRAND TOTAL | 805,730,701 | 823,522,335 | 843,250,029 | 865,321,182 | 873,513,527 | 4,211,337,774 | |
* AFA: Alternative Funding Arrangement |
|||||||