Evaluation of the First Nation Infrastructure Fund
Final Report
Date: April 2014
Project Number: 1570-7/13066
PDF Version (1.591 Mb, 109 Pages)
Table of contents
- List of Acronyms
- Executive Summary
- Management Response / Action Plan
- 1. Introduction
- 2. Evaluation Methodology
- 3. Evaluation Findings - Relevance
- 4. Evaluation Findings - Performance
- 5. Program Design and Delivery
- 6. Lessons Learned and Best Practices
- 7. Efficiency and Economy
- Annex A - National Priority Funding Evaluation and Measurement Matrix
- Annex B - Evaluation Issues and Questions
- Annex C - FNIF Community Project Sites
- Annex D - Economic Impact Analysis of First Nations Infrastructure Fund
List of Acronyms
| AANDC |
Aboriginal Affairs and Northern Development Canada |
|---|---|
| CCP |
Comprehensive Community Plan |
| CFMP |
Capital Facilities and Maintenance Program |
| GDP |
Gross Domestic Product |
| EMAP |
Emergency Management Assistance Program |
| FNIF |
First Nations Infrastructure Fund |
Executive Summary
This evaluation of the First Nations Infrastructure Fund (FNIF) was conducted by the Evaluation, Performance Measurement and Review Branch in time for consideration of funding renewal and the consolidation of community infrastructure authorities in 2013-2014.
The FNIF, created in 2007-2008, was a $239.4 million targeted fund for proposal-based projects on-reserve under the following categories: solid waste management; energy systems; local roads and bridges; planning and skills development; and connectivity. FNIF funding was scheduled to expire on March 31, 2013, but was renewed under the 2013 budget.
This evaluation builds on the 2010 implementation evaluation and examines the FNIF's relevance, performance and design and delivery from 2007-2008 to 2012-2013. The methodology used to conduct this evaluation included a document and file review; a literature review; 71 key informant interviews with federal government and First Nation representatives, external experts and stakeholders; five case studies; an economic impact analysis conducted by consulting firm Malatest & Associates Ltd.; and participation in a Comprehensive Community Planning workshop.
Key findings and conclusions from the evaluation are as follows:
Relevance:
- The FNIF was established to address long-standing infrastructure funding needs that continue to exist in First Nation communities.
- FNIF funding categories continue to be consistent with the objectives and priorities of the federal government and First Nation communities.
- Providing funding for community infrastructure development on reserve is a legitimate, appropriate and necessary role for the federal government.
- The division of roles and responsibilities of AANDC and Infrastructure Canada was appropriate and while initially necessary, Infrastructure Canada's involvement would not be required under a renewed FNIF.
Performance:
- Evidence suggests that the FNIF was a high impact fund because the projects were relatively small, numerous and representative of community priorities. Key impacts of FNIF projects include: safer roadways and bridges; environmental and health benefits from reduced burning of garbage; improved energy security and reduced reliance on diesel; improved First Nations' infrastructure management and technical capacity to maintain infrastructure; and improved delivery of public/government services, including e-education, e-health and remote water monitoring.
- Though unexpected, community-driven Comprehensive Community Planning projects resulted in healing transformations, the prevention of third party management, and the improvement of relationships with municipal, provincial and federal governments.
- Completed FNIF projects provided communities with tangible results that sparked momentum for communities to engage in additional initiatives and identify unexpected opportunities for economic development.
- The FNIF proposal-based program design posed numerous challenges which could be mitigated by incorporating FNIF project proposals into the Department's annual National Capital Planning Process and strengthening the priority ranking criteria of the First Nations Infrastructure Investment Plan's "Community Infrastructure" component.
- Completed FNIF projects put pressure on the Capital Facilities and Maintenance Program (CFMP) budget as it funds their operations and maintenance support. Additionally, completed infrastructure projects are rarely operated and maintained for optimal infrastructure sustainability.
- Performance Measurement is a continuing challenge for infrastructure programming. There is a need for a concerted effort to rectify the shortfalls of the Information Technology tracking applications to encourage their consistent use.
- Regional inflation limited the amount of projects that could be funded in provinces experiencing significant economic growth as costs were high and contractors were few.
- Technical expertise for supporting project designs and construction oversight was not always readily available, which in some cases left First Nations vulnerable to overpricing and poor design from contractors and consultants.
Lessons Learned and Best Practices:
- FNIF funded Comprehensive Community Plans have been growing in popularity and utility as a result of emerging best practices such as the use of Comprehensive Community Plan champions, First Nation to First Nation mentorship components, British Columbia region's annual workshop, and extensive community engagement.
- Strategic relationships with University Planning and Engineering Departments has allowed for important partnerships when designing and implementing infrastructure projects.
- FNIF projects that invested highly in building the knowledge and skills of First Nation community members have supported career development and not just temporary employment for First Nation communities.
- It was found that local ownership and management of internet infrastructure yields cost savings and employment benefits especially for remote communities.
Efficiency and Economy:
- The FNIF was able to leverage a significant amount of funds that expanded its impact. The cost-sharing component should thus be encouraged moving forward but with caution as cost-sharing may put low-capacity and remote First Nations at a disadvantage.
- FNIF was able to apply a Public, Private Partnership model for funding connectivity projects in that multiple communities were connected under a single project and contractor. This approach was found to be efficient and could be more broadly applied to funding common infrastructure projects for multiple First Nation communities.
- The regional delivery method of using existing CFMP human resources to implement FNIF projects was found to be the most effective and efficient approach.
- The pressure to select the lowest cost when infrastructure projects are put to tender was found to be an inefficient policy. There is a need to analyze and improve the Community Infrastructure Branch's tendering policies based on identified regional best practices.
- Opportunities exist for improved departmental programming collaboration in the areas of community planning, disaster mitigation, completing energy feasibility studies, and engaging in infrastructure and physical land use planning to support economic development.
It is therefore recommended that AANDC's Community Infrastructure Branch:
- Examine the feasibility of integrating the call for FNIF project proposals into the Department's annual Capital Planning application process.
- Expand existing management and oversight documents to ensure funded projects include: (a) identification of operations and maintenance funding sources that adequately meet the life-cycle cost of the asset; (b) identification of necessary training requirements; (c) disaster mitigation infrastructure design elements; and (d) an expanded eligible recipients list to allow for more flexible partnerships with the private sector, academia and Aboriginal organizations.
- Engage the Professional and Institutional Development Directorate to (a) identify practical ways for Professional and Institutional Development to support community planning projects funded under the Planning and Skills Development category; and (b) to develop a strategy to align the Department's community planning and support activities.
- Review the program's tendering policy and best practices across the regions to ensure an effective and consistent approach nationally.
- Engage ecoENERGY in order to identify a strategy for sharing completed feasibility studies to support potential FNIF-funded energy projects and ensure information is accessible to regional front-line officers.
Management Response / Action Plan
Project Title: Evaluation of the First Nations Infrastructure Fund
Project #: 1570-7/12024
| Recommendations | Response and Actions | Responsible Manager (Title / Sector) | Planned Implementation and Completion Dates |
|---|---|---|---|
| 1. It is recommended that the Community Infrastructure Branch examine the feasibility of integrating the call for FNIF project proposals into the Department’s Annual Capital Planning process. | The Community Infrastructure Branch is integrating the call for FNIF project proposals into the Capital Facilities and Maintenance Program Annual Capital Planning Process. | Scott Stevenson, Senior Assistant Deputy Minister- Regional Operations | April 2014 |
| 2. It is recommended that the Community Infrastructure Branch expand existing management and oversight documents to ensure funded projects include: (a) identification of operations and maintenance funding sources that adequately meet the life-cycle cost of the asset; (b) identification of necessary training requirements; (c) disaster mitigation infrastructure design elements; and (d) an expanded eligible recipients list to allow for more flexible partnerships with the private sector, academia and Aboriginal organizations. | The Community Infrastructure Branch is expanding program oversight to ensure that funded projects include:
|
Scott Stevenson, Senior Assistant Deputy Minister- Regional Operations | Fall 2014 - Winter 2015 |
| 3. It is recommended that the Community Infrastructure Branch engage the Professional and Institutional Development Directorate to (a) identify practical ways for Professional and Institutional Development to support community planning projects funded under the Planning and Skills Development category, and (b) to develop a strategy to align the Department’s community planning and support activities. | The Community Infrastructure Branch is working with Professional and Institutional Development to develop a strategy to align the Department’s community planning and support activities. | Scott Stevenson, Senior Assistant Deputy Minister- Regional Operations | Fall 2014 |
| 4. It is recommended that the Community Infrastructure Branch review the program’s tendering policy and regional best practices to ensure an effective and consistent national approach. | The Community Infrastructure Branch is reviewing the program’s tendering policy and regional best practices to ensure a consistent national approach and comparability to practices off reserve. | Scott Stevenson, Senior Assistant Deputy Minister- Regional Operations | Fall 2014 |
| 5. It is recommended that the Community Infrastructure Branch engage ecoENERGY in order to identify a strategy for sharing completed feasibility studies to support potential FNIF-funded energy projects and ensure information is accessible to regional front-line officers. | The Community Infrastructure Branch will engage with the Climate Change Division's ecoENERGY in order to identify how best to use the information received from the technical and strategic advisory services they contracted and access and/or share feasibility studies to support potential FNIF-funded energy projects and ensure information is shared to regional front-line officers. | Scott Stevenson, Senior Assistant Deputy Minister- Regional Operations | Fall 2014 |
I recommend this Management Response and Action Plan for approval by the Evaluation, Performance Measurement and Review Committee
Original signed on January 28, 2014, by:
Michel Burrowes
Director, Evaluation, Performance Measurement and Review Branch
I approve the above Management Response / Action Plan
Original signed on January 28, 2014, by:
Scott Stevenson
Senior Assistant Deputy Minister, Regional Operations
The Management Response / Action Plan for the Evaluation of the First Nations Infrastructure Fund were approved by the Evaluation, Performance Measurement and Review Committee on February 6, 2014.
1. Introduction
1.1 Overview
This summative evaluation of the First Nations Infrastructure Fund (FNIF) was conducted in accordance with the Treasury Board's Policy on Evaluation and in time for consideration of funding renewal and the consolidation of community infrastructure authorities in 2013-2014 into the Contributions to Support Construction and Maintenance of Community Infrastructure. The evaluation builds on the 2010 implementation evaluation and examines the FNIF's relevance, design and delivery and performance from 2007-2008 to 2012-2013. The evaluation was conducted by the Evaluation, Performance Measurement and Review Branch at Aboriginal Affairs and Northern Development Canada (AANDC).
1.2 Program Profile
1.2.1 Background and Description
In 2007, AANDC and Infrastructure Canada entered into an agreement to invest $127.3 million over five years for on-reserve infrastructure projects. The FNIF funding was pooled from three pre-existing federal sources: Infrastructure Canada's Municipal Rural Infrastructure Fund, the Gas Tax Fund, and AANDC's Capital Facilities and Maintenance Program (CFMP). In Budget 2007, AANDC accessed an additional $107.6 million from Infrastructure Canada's Building Canada Fund and in 2009, this was used to increase the total FNIF contributions envelope to $234.9 million; at this point connectivity was also added to the existing suite of investment categories. The targeted fund was proposal-based and was intended to address long-standing community infrastructure needs that had not been funded under existing infrastructure programming.
FNIF funding was scheduled to expire on March 31, 2013, but was renewed under the 2013 Budget. Over the next five years, just under $139 million of the renewed Gas Tax Fund was set aside for FNIF funding; Gas Tax funding is statutory and can be re-adjusted every five years based on First Nations' population on reserve.Footnote 1 Additionally, as part of Canada's Economic Action Plan 2013, a further $155 million over ten years from the New Building Canada Fund was set aside for the FNIF.Footnote 2
1.2.2 Objectives and Expected Outcomes
According to the FNIF Terms and Conditions (2007), the fund specifically seeks to:
- improve the health and safety of First Nation communities;
- contribute to a cleaner and healthier environment;
- improve the delivery of public/government services, including education and e-health to First Nation communities; and
- enhance collaboration among First Nation communities, municipalities, provinces and the Government of Canada.
To reach its strategic outcomes, the FNIF provided funding in five project categories:
- Solid waste (management): construct, restore and improve infrastructure that improves solid waste management and increases the recovery and use of recycled and organic materials, reduces per capita tonnage of solid waste sent to landfill, reduces environmental impacts and enhances energy recovery.
- Energy systems: construct, restore or improve local band-owned infrastructure that optimizes the use of energy sources (e.g., in buildings and other installations), accesses provincially owned energy grids and reduces the greenhouse gas emissions and air contaminants arising from local sources.
- Local roads and bridges: 1) construct, restore or improve public roads and bridges that will result in improved safety, support tourism and commerce, support social and economic development of local areas; and 2) reduce the need for client travel outside of their local region for schooling and healthcare purposes.
- Planning and skills development: to support investment in community planning and/or skills development projects that will support long-term sustainable community development of First Nation communities.
- ConnectivityFootnote 3: to support under-connected First Nations to gain access to regional broadband network expansions driven by regional, provincial, and private sector broadband infrastructure partnerships in order to improve social, cultural and economic development opportunities, as well as: improve the delivery of public services, such as government services, education, and e-health to First Nation communities.
The fund's performance measurement strategy is contained under the umbrella of the Capital Facilities and Maintenance Program's 2009 Performance Measurement Strategy. FNIF Performance Indicators include:
- The Community Well-Being index, developed by AANDC's Research and Analysis Directorate
- Percentage of communities able to undertake basic public works activities
- Estimated reductions in greenhouse gas emissions
- Percentage of First Nation communities with electricity/power generation in fair or better conditions
- Percentage of First Nation communities that are off-grid
- Percentage of roads and bridges with a fair or better condition rating
- Percentage of First Nation communities with access to broadband connectivity
1.2.3 Program Management, Key Stakeholders and Beneficiaries
AANDC was responsible for program delivery, performance measurement, and reporting annually to Infrastructure Canada and to Parliament on the program's progress. The two departments jointly designed the terms and conditions, a Memorandum of Understanding, and the development of a Results-based Management and Accountability Framework. A National Oversight Committee with representatives from both departments monitored the FNIF's progress.
Eligible applicants included:
- First Nation governments, including a band or tribal council or its agent (wholly-owned corporation), on the condition that the First Nation has indicated support for the project and for the legally designated representative to act as an applicant through a formal band or tribal council resolution; and
- Innu communities where the applicant is on reserve, Crown land in the province.
FNIF funding did not extend to communities in the territories as funding was disseminated by the respective territorial governments.
1.2.4 Infrastructure Investment Decision Making
AANDC's CFMP funds the majority of infrastructure projects on reserve and determines funding priorities using the National Capital Planning Process. This process includes three layers of annual planning: (1) A community level plan is submitted by each First Nation to the AANDC regional office detailing their infrastructure needs; (2) The regional office develops their Capital Plan indicating planned program expenditures; and (3) The First Nations Infrastructure Investment Plan is then developed based on each Regional Capital Plan to provide a strategic overview of national CFMP investment decisions.
Projects are prioritized at the regional level using the National Priority Funding Evaluation and Measurement Matrix (available in Annex A), which includes six columns ranked in order of priority. Within these columns, projects are ranked on a scale of 1-5 depending on their priority level. Projects that impact the health and safety of the community receive the highest ranking while projects that address community growth and future needs receive the lowest ranking. Column D, "Community Infrastructure" includes several of the FNIF funding categories and is ranked lowest in terms of priority. However, funding decisions for the FNIF were not based on this process but instead on a separate proposal submission process where projects were ranked by regional selection committees using FNIF mandatory screening criteria and the selection criteria for specific project categories, in consideration of local needs and priorities.
1.2.5 Program Resources
In total, AANDC invested $240,744,000 in contributions under the FNIF while sourcing an additional $21,423,500 in other departmental funds (Table 1). The FNIF funding was divided amongst AANDC's seven regional offices south of 60̊ on a per capita basis weighted with levels of remoteness (Table 2). Additional project funding from other partners and stakeholders totaled approximately $241,467,113 (Table 1). A total of $2,177,320 was provided for internal AANDC program operating costs (Table 3).
These investments amounted to a total of 434 funded projects from 2007-2013 (Table 1) representing 35 percent of the 1,242 project proposals received. The remaining 808 project proposals either remain unfunded or have been included as lower priorities on Regional Capital Plans, which will likely not be funded by the CFMP.
| FNIF Category | # of projects | 07/08 | 08/09 | 09/10 | 10/11 | 11/12 | 12/13 | Total FNIF Investment |
(A-base)Footnote 4 | Other Funding SourcesFootnote 5 |
|---|---|---|---|---|---|---|---|---|---|---|
| Connectivity | 20 | 0 | 0 | 9,038,310 | 5,833,753 | 16,704,282 | 10,490,473 | $42,066,818 | 1,201,209 | 150,499,543 |
| Energy Systems | 41 | 860,781 | 4,124,945 | 377,881 | 1,622,104 | 2,336,794 | 2,609,021 | $11,931,526 | 121,980 | 29,256,122 |
| Planning and Skills Development | 50 | 1,283,447 | 6,871,222 | 1,998,597 | 2,376,437 | 3,017,616 | 2,206,740 | $17,754,059 | 1,032,470 | 5,073,101 |
| Roads & Bridges | 142 | 4,184,873 | 26,994,689 | 25,665,738 | 22,881,229 | 36,010,942 | 21,699,220 | $137,436,691 | 17,034,365 | 51,284,993 |
| Solid Waste Management | 81 | 813,499 | 3,607,448 | 3,100,654 | 1,680,492 | 10,191,244 | 12,161,248 | $31,554,585 | 2,033,489 | 5,353,354 |
| TOTAL | 434 | $7,142,600 | $41,598,304 | $40,181,180 | $34,394,015 | $68,260,878 | $49,166,702 | $240,743,679 | $21,423,513 | $241,467,113 |
| Region | # of projects | 07/08 | 08/09 | 09/10 | 10/11 | 11/12 | 12/13 | Total ACTUALS |
|---|---|---|---|---|---|---|---|---|
| Atlantic | 17 | 147,000 | 4,154,952 | 0 | 914,115 | 2,470,375 | 2,529,511 | $10,215,953 |
| Quebec | 52 | 1,806,206 | 4,794,038 | 1,451,724 | 2,554,206 | 12,669,034 | 6,024,935 | $29,300,143 |
| Ontario | 82 | 986,307 | 11,252,624 | 6,527,605 | 3,519,164 | 14,109,897 | 5,646,905 | $42,042,502 |
| Manitoba | 58 | 2,237,875 | 5,328,296 | 10,309,411 | 10,136,031 | 11,151,469 | 8,430,686 | $47,593,768 |
| Saskatchewan | 31 | 0 | 4,389,800 | 14,112,500 | 8,847,900 | 7,687,400 | 8,318,500 | $43,356,100 |
| Alberta | 45 | 490,689 | 3,118,771 | 5,174,580 | 5,104,014 | 9,581,542 | 10,220,670 | $33,690,266 |
| British Columbia | 149 | 1,474,523 | 8,559,823 | 2,605,360 | 3,318,585 | 10,591,161 | 7,995,495 | $34,544,947 |
| TOTAL | 434 | $7,142,600 | $41,598,304 | $40,181,180 | $34,394,015 | $68,260,878 | $49,166,702 | $240,743,679 |
| Resource Category | 07/08 | 08/09 | 09/10 | 10/11 | 11/12 | 12/13 | Total |
|---|---|---|---|---|---|---|---|
| AANDC SALARY Total | 181,756.66 | 306,847.87 | 328,554.22 | 265,370.27 | 370,219.31 | 173,427.18 | 1,626,175.51 |
| AANDC NON SALARY Total | 9,002.23 | 127,676.81 | 39,695.38 | 49,028.95 | 53,591.50 | 1,519.17 | 280,514.04 |
| NON BUDGETARY Total | 30,315.40 | 49,734.01 | 58,679.46 | 46,317.46 | 57,465.33 | 28,116.21 | 270,627.87 |
| Grand Total | 221,074.29 | 484,258.69 | 426,929.06 | 360,716.68 | 481,276.14 | 203,062.56 | 2,177,317.42 |
2. Evaluation Methodology
2.1 Evaluation Scope and Timing
The evaluation examined program relevance, design and delivery and performance over the entirety of the fund’s existence from 2007-2008 to 2012-2013. Evaluation Terms of Reference were approved by AANDC’s Evaluation, Performance Measurement and Review Committee on June 21, 2013. Field work was conducted between July and October 2013.
2.2 Evaluation Issues
Aligned with Treasury Board requirements, the evaluation focused on the following issues (Refer to Annex B for Evaluation Questions):
Relevance
Continued Need
Alignment with Government Priorities
Alignment with Federal Roles and Responsibilities
Performance
Effectiveness
Demonstrations of Efficiency and Economy
2.3 Evaluation Methodology
The following section outlines the evaluation’s data collection methods, major considerations, strengths and limitations of the report and processes undertaken for quality assurance.
2.3.1 Data Sources
Literature Review
The literature review was used to examine broader trends, issues and challenges related to municipal infrastructure development and financing, as well as its linkages to economic development and social, health and environmental well-being for communities in the Canadian context. The literature review also concentrated on the necessity of funding infrastructure based on comprehensive community planning practices.
Document and File Review
The document review looked at internal (FNIF) documents such as previous FNIF audits, evaluations, management responses and action plans; previous and current related program evaluations and reports; program reports; project tracking files; external reports and communications; program operational documents (e.g., Results-based Management and Accountability Frameworks, Performance Measurement Strategy, operational plans, strategic plans, AANDC quarterly reporting); and public communications.
Key Informant Interviews
Seventy-one stakeholders and experts were interviewed, including eight program staff at Headquarters; eight additional Headquarters stakeholders; nine external experts and stakeholders; two National Oversight Committee members; two federal partners; and 42 regional AANDC staff members. First Nation recipients and community members were interviewed as part of the case studies and as such, were not included in the total number of Key Informant Interviews.
Case Studies
Five case studies were completed in total, one for each of the funding categories eligible under the FNIF. The case studies included four data collection methods: site visits (or video conferencing when more efficient); focus groups with First Nation project teams; focus groups with targeted community members operating or using the infrastructure developed; and a review of reporting documents from recipients.
The following communities and partners were visited based on four criteria: (1) total project costs; (2) number of projects approved for a community; (3) regional representation; and (4) recommendations from regional offices. In total, the case studies included 46 stakeholders (project details available in Annex C).
| Communities and Project Sites | AANDC Region |
|---|---|
| Solid Waste Case Study | |
| Whitecap Dakota First Nation | Saskatchewan |
| Peguis First Nation | Manitoba |
| Roads and Bridges Case Study | |
| Poplar River First Nation | Manitoba |
| Fisher River Cree Nation | Manitoba |
| Whitefish Lake First Nation | Alberta |
| Planning and Skills Development Case Study | |
| Musqueam Indian Band | British Columbia |
| Penticton First Nation | British Columbia |
| T’Souke First Nation | British Columbia |
| Saddle Lake Cree Nation | Alberta |
| Energy Systems Case Study | |
| Kitasoo | British Columbia |
| Gitga’at First Nation | British Columbia |
| T’Souke First Nation | British Columbia |
| Connectivity Case Study | |
| Alberta Supernet/First Nations (Alberta) TechnicalServices Advisory Group Connectivity Project | Alberta |
| Nishnawbe Aski Nation | Ontario |
| Conseil en Éducation des Premières Nations | Quebec |
Economic Impact Analysis
The consulting firm Malatest & Associates Ltd. used regional records of funding decisions and a project tracking database alongside provincial input-output multipliers developed by Statistics Canada to estimate the return on investment of FNIF-funded projects. Estimated results included total output generated, contribution to Canadian gross domestic product (GDP), total income generated through employment and total number of jobs created.
Comprehensive Community Planning Workshop
The evaluation team attended British Columbia’s Annual Comprehensive Community Planning (CCP) Workshop co-hosted by Little Shuswap Lake Indian Band and AANDC from October 1-3, 2013. Over 100 attendees representing 50 First Nation communities participated in the workshop. Key note speakers from First Nations implementing their CCPs shared their stories and provided practical workshops on topics such as: Finding the support you need to get started; Engaging community members; Monitoring and evaluating planning progress; Integrating CCP with other planning processes; Indigenous planning as a healing process; and Keeping the plan alive. Through presentations, break-out groups and informal discussions, the evaluation team spoke with a large sample of First Nation representatives, regional staff and external stakeholders about the First Nation community planning process, including key challenges and best practices.
2.3.2 Considerations, Strengths and Limitations
Where possible, the evaluation team collaborated with other Evaluation, Performance Measurement and Review Branch case study travel for purposes of cost-efficiency.
The main limitation in the evaluation process was a lack of readily available program performance information for analysis. The Integrated Capital Management System was not fully operational during the implementation of the FNIF due to an ongoing review of the system’s performance, and still remains a challenge for some regions that are just now populating the system with completed project data. As such, evaluators could not obtain precise numbers on how many communities benefitted from FNIF funding.
In response to the 2010 implementation evaluation, the program designed performance indicators such as the percentage of communities with roads and bridges or electrical/power generation in fair or better conditions; however, inspections operate on a three year cycle and many FNIF projects have not yet had their first reviews.Footnote 8 As a result, evaluators could not obtain usable performance data. It is expected that these concerns will be addressed through the development of the Infrastructure and Capacity Performance Measurement Strategy currently underway as part of the Performance Measurement Strategy Action Plan for 2013-2014.
The 2010 implementation evaluation of the FNIF was undertaken at the same time as an evaluation of the CFMP; this was due to overlapping design and delivery issues and a desire to reduce the reporting burden for regional offices and First Nation communities by amalgamating the interviews, focus groups and site visits. This approach of timing evaluation work under Section 2.4 of the 2014-2015 Program Alignment Architecture should be continued for future evaluation work as the FNIF evaluation results also pertained to funding water and wastewater, education facilities, housing, renewable energy, emergency management assistance and other community infrastructure.
2.4 Roles, Responsibilities and Quality Assurance
The Evaluation, Performance Measurement and Review Branch of AANDC’s Audit and Evaluation Sector was the project authority responsible for completing the evaluation. Quality assurance activities were put in place to preserve the quality of the data and ensure that the methodology selected was appropriate. These mechanisms included:
- Internal peer-review process at the AANDC Evaluation Branch: Two members of the Evaluation, Performance Measurement and Review Branch not affiliated with the current evaluation reviewed the evaluation for issues with methodology, data collection and interpretation.
- The evaluation working group: This group, headed by the evaluation manager, was made up of AANDC and Infrastructure Canada program representatives, including regional program managers and two representatives from a Tribal Council that received FNIF funding. The group was responsible for reviewing, validating and commenting on the choice of methodology, the preliminary findings and the final report.
- The Evaluation, Performance Measurement and Review Committee: This committee is made up of the Chief Financial Officer, the senior assistant deputy ministers and external experts. It is headed by the Deputy Minister of Aboriginal Affairs and Northern Development Canada. It was responsible for approving the evaluation’s Terms of Reference, preliminary findings report, the final evaluation report and Management Response and Action Plan.
3. Evaluation Findings - Relevance
3.1 Continued Need
The FNIF was established to address long-standing infrastructure funding needs that continue to exist in First Nation communities.
Original Need for the FNIF
AANDC funds infrastructure development on reserve based on the national infrastructure ranking process outlined in Section 1.2.4. In practice, this means that the majority of AANDC's infrastructure funding must be allocated to water and wastewater systems, education facilities and housing. Often, available funding does not cover the expanse of needs within these categories. Furthermore, much of the CFMP funding comes from targeted sources like the First Nations Water and Wastewater Action Plan, which could not be used for community infrastructure even if it were higher on the priority list. AANDC has individual programs for housing and contaminated sites whereas all other types of infrastructure assets and their operations and maintenance requirements fall under the CFMP. CFMP funding is further strained when it must be regularly re-profiled towards addressing statutory obligations such as education, social programming and other priorities. These funding constraints are significant as they make it difficult for community infrastructure priorities to be addressed.
The majority of internal key informants corroborated these concerns by explaining that the strained CFMP budget means other community infrastructure projects cannot be funded. These views corroborate concerns expressed by First Nation community interviewees that there has been a long-standing need to fund community infrastructure such as solid waste management and roads and bridges.Footnote 9 The SchoolNet evaluation noted that e-learning, video conferencing and other connectivity-related opportunities were not realistic for First Nations without specific targeted investments.Footnote 10 Furthermore, the evaluation of the CFMP called for a targeted program to fill in these gaps,Footnote 11 and the implementation evaluation of the FNIF found that it closely mirrored the needs expressed by communities.Footnote 12
AANDC's limited ability to fund community infrastructure is exacerbated by a lack of external options for financing in First Nation communities.Footnote 13 The 2011 Evaluation of Implementation of the First Nation Fiscal and Statistical Management Act found that governments use their infrastructure and services to stimulate their economy through industrial, commercial, and residential development in their jurisdictions; however, First Nation communities have faced sizeable challenges in funding infrastructure needs in large part because there is no formal framework under the Indian Act to support the functions of comptrollership, compliance, taxation, and standard-setting that would facilitate First Nation governments gaining affordable access to capital markets.Footnote 14 While support for infrastructure in Canada is also typically financed through external loans,Footnote 15 securing access to finances is often difficult for First Nation communities given that financing tends to be limited to borrowers already established in the economy.Footnote 16Furthermore, relevant literature revealed that a lack of adequate infrastructure is one of many factors influencing the pace and success of economic development ventures on reserve.Footnote 17
Limited alternatives to funding infrastructure on reserve include the First Nations Finance Authority, which provides low-cost loans to First Nations registered under the First Nations Fiscal Management Act. The Act provides communities with the capacity to collect taxes and ensures accountability to taxpayers by supporting the development of financial management capacity; regulatory oversight is provided for First Nations that are exercising jurisdiction over the collection of property taxes and accessing loans through a pooled borrowing regime. Additionally, the Royal Bank of Canada's Aboriginal Partnerships Program provides funding to promote Aboriginal economic development and has invested $12 million into roads and bridges to date.Footnote 18
An analysis conducted by the GBC Group in 2011 suggests that the challenge of funding infrastructure development is typical for many small or remote Canadian communities. These communities (1) tend to rely on provincial and federal grants; (2) do not tend to access private financial institutions; and (3) will use own-source revenue for funding the operations and maintenance of assets but not for construction of assets.Footnote 19 These findings corroborate the 2010 program evaluations of the Capital Facilities and Maintenance Program and the FNIF, which demonstrated that the FNIF was an essential program for developing infrastructure on reserve, and that until First Nation communities are able to develop their own-source funding revenue streams, major capital infrastructure needs will go unaddressed in the absence of federal funding.Footnote 20
Ongoing Need for the FNIF
Originally, the FNIF was a small targeted fund of just over $240 million. Of the 1,242 proposals received, 808 remained unfunded at the end of the third call, amounting to $689 million of eligible unfunded projects. The vast amount of eligible unfunded projects demonstrates that there is a continuing demand for the fund that expired in March 2013. The ongoing need for a similar funding source will be fulfilled by the New Building Canada Plan announced in the 2013 Federal Government Budget in addition to ongoing Gas Tax funding.Footnote 21
Communities' highest requests under the FNIF were for the Planning and Skills Development category and the Roads and Bridges category. Roads and Bridges was also the largest funded category at $137,436,691, representing over 57 percent of the fund. The continued need for funding roads and bridges was also identified in Infrastructure Canada's evaluation of its First Nations Infrastructure componentFootnote 22 and by the majority of case study interviewees. Roads and bridges were a priority for First Nation communities looking to: (1) increase their access to external resources; (2) improve the look and feel of their communities for community morale; and (3) entice potential investors. The 2010 evaluation of the CFMP also argued that supporting provincial and territorial access roads to First Nation communities is a vital factor in supporting health and safety as well as economic development.Footnote 23
On March 21, 2013, the Honourable Jim Flaherty, Minister of Finance, announced additional funding for the FNIF as part of Budget 2013. The findings above demonstrate this renewal responds to the needs - and typically unfunded priorities - of communities identified in this evaluation.
3.2 Alignment with Federal Government Priorities, Departmental Strategic Outcomes, and First Nations' Priorities
FNIF funding categories continue to be consistent with the objectives and priorities of the federal government and First Nations communities.
Alignment with Federal Government Priorities:
The FNIF was found to be consistent with a long-standing priority of the Government of Canada regarding infrastructure investment:
- In the 1999 Speech from the Throne, the Government outlined its intention to "make a long term contribution towards a dynamic economy through the building of infrastructure."Footnote 24
- In Budget 2000, $2.05 billion was allocated over six years to improving urban and rural infrastructure.Footnote 25
- The 2002 Speech from the Throne pledged to put in place a ten year initiative of infrastructure renewal.
- Budget 2003 confirmed this commitment by providing $1 billion to help meet the infrastructure needs of smaller communities.Footnote 26
- Budget 2006 committed to providing stable and reliable funding to provinces, territories and communities to help them meet their infrastructure needs.Footnote 27
More recently, the Government has made significant investments in infrastructure through three sources: the Gas Tax Fund, the Building Canada Fund and through additional Economic Action Plan stimulus funds. The Gas Tax Fund was originally intended to provide $5 billion to municipalities over five years; however, in 2007 the fund was extended with the annual amount increased to $2 billion, and on December 15, 2011, the fund was legislated to be a permanent annual infrastructure investment. The Building Canada Fund was announced in the 2007 Speech from the Throne and provided $8.8 billion for national, regional and local infrastructure priorities from 2007-2014. Furthermore, the 2013 Speech from the Throne noted that infrastructure investment "contributes in a fundamental way to growth and long-term prosperity"Footnote 28 and thus, a new Building Canada Fund was established that, when combined with other federal infrastructure investments, will result in $70 billion in infrastructure funding over 10 years - the largest long-term commitment to infrastructure in Canadian history.Footnote 29 The size and consistency of infrastructure investments over time demonstrates the priority placed on infrastructure development by the Government of Canada.
In terms of infrastructure investments on reserve, Budget 2006 announced "A New Approach" to helping Aboriginal communities, which sought to reduce disparities between Aboriginal people and other Canadians.Footnote 30 Canada's Economic Action Plan stimulus funding provided $515 million over two years for "ready-to-go" First Nations infrastructure projects in priority areas, including schools and water. Additionally, Budget 2013 made significant investments in First Nations infrastructure, including $7 billion over ten years for "roads, bridges, energy systems and other First Nations infrastructure priorities".Footnote 31
At the departmental level, AANDC supports infrastructure investment on reserve through its Land and Economy strategic area with the expected ultimate outcome of "full participation of First Nations, Métis, Non-Status Indians and Inuit individuals and communities in the economy."Footnote 32 Specifically, AANDC supports a suite of Infrastructure and Capacity programming where FNIF works to support the long-term expected result that "First Nation communities have a base of infrastructure that protects health and safety and enables engagement in the economy."Footnote 33 The FNIF, therefore, aligns with these departmental priorities by providing a base of community infrastructure that supports health and safety while also laying the foundations for economic development.
In the 2012-2013 AANDC Report on Plans and Priorities, the Department identified eleven priority areas that fall under three themes. Several of the FNIF funding categories are designed to help meet these priorities.Footnote 34 Specifically, under the "Transforming for Improved Results" theme, the priority of "Improving Economic Development and Sustainability"Footnote 35 was identified. The FNIF supports this priority by undertaking infrastructure projects that will spur economic development in First Nation communities or enable community members to access nearby economic/employment opportunities. Furthermore, the theme "Improving Partnerships and Relationships" includes the priority "Facilitate Community Development and Capacity."Footnote 36 The 2012-13 Departmental Performance Report notes that the Department has worked to achieve this priority by "advancing the Community Development Framework and related tools,"Footnote 37 which include comprehensive community planning. Finally, the 2012-13 Departmental Performance Report states that "connectivity is essential to support Aboriginal online services such as e-commerce, e-learning, remote banking, e-health and online program reporting."Footnote 38 Additionally, the report states that "sound roads and bridges are essential elements of community infrastructure."Footnote 39 As such, the projects funded by the FNIF, through their contributions to community planning and/or economic development, have contributed to the achievement of AANDC departmental priorities.
Alignment with First Nations Priorities:
The evaluation of the CFMP noted that "whereas water projects are given top priority and are well handled with the CFM program…water might not be the highest priority in all communities. Thus, projects such as solid waste management, and roads and bridges may not have received funding."Footnote 40 Additionally, the evaluation noted that capital projects, such as road and bridge construction, have received minimal program support because they fall lower on the national priority list. For First Nations that did not have problems related to water, other projects deemed to have high local priority were often delayed.Footnote 41 While minor capital funding can be used to address these projects where they are eligible, often they go unaddressed when there is not enough funding available.
The FNIF plays a critical role in addressing First Nations infrastructure priorities that do not receive CFMP funding. According to key informants from AANDC Headquarters, AANDC regional offices, the Assembly of First Nations, First Nations organizations and the case studies conducted in First Nation communities, the FNIF funding categories remain relevant and priority areas for First Nation communities across the country as they address long-standing community infrastructure priorities. Additionally, the targeted nature of the FNIF also allows for flexibility in funding project categories in recognition of the range of infrastructure pressures on First Nation communities. As a result, community member interviewees spoke highly of the fund, and with the fund's renewal announcement, are keen to start addressing the additional items on their long-standing Capital Plans.
3.3 Alignment with Federal Roles and Responsibilities
There is a legitimate, appropriate and necessary role for the federal government in providing funding for community infrastructure development on reserve.
The provision of community infrastructure funding to First Nations is based on the Government of Canada's spending power as a matter of social policy. In particular, the Indian Act gives the Minister the authority to determine whether roads and bridges are of an acceptable condition and to take action if deemed unacceptable.Footnote 42 As such, the FNIF supports AANDC's established role in the support of community infrastructure at the regional level, which can be provided through formula or proposal-based project funding or as a combination of both. The FNIF specifically supports the Department's mandateFootnote 43 by improving the quality of life and the environment for First Nations by assisting communities on reserve, Crown Land or land set aside for the use and benefit of a First Nations within the provinces of Canada to improve and increase public infrastructure.
The division of roles and responsibilities of AANDC and Infrastructure Canada was appropriate and while initially necessary, Infrastructure Canada's involvement would not be required under a renewed FNIF
The Office of Infrastructure Canada leverages the resources and capacities of various departments to deliver infrastructure funding in all provinces, territories and to on-reserve First Nations. With the launch of the Gas Tax Fund in 2005, Infrastructure Canada and AANDC jointly requested the authority to develop the FNIF to pool the resources of the Gas Tax Fund, the Municipal Rural Infrastructure Fund and existing AANDC resources. To jointly oversee the implementation of the fund, regional selection committees, chaired by the Associate Regional Director General for AANDC, were established to identify regional priorities, evaluate project funding applications and then report to the National Oversight Committee made up of AANDC and Infrastructure Canada senior officials on project recommendations and application processing improvements. The partnership - solidified through a Memorandum of Understanding - was intended to leverage AANDC's history, expertise, capacity, and its federal jurisdiction in delivering Infrastructure Canada funding to First Nations and to serve as an exchange of best practices.
The 2010 evaluation noted that roles, responsibilities and accountabilities were generally clear and well-understood.Footnote 44 Key informants have noted that as of 2010, the issues raised at the National Oversight Committee were largely informational items not requiring decision making or the provision of a strategic outlook. This decline in relevancy and frequency of meetings reflected AANDC's full authority over the delivery of the program. Interviewees noted that the inter-departmental relationship is such that Infrastructure Canada, although willing to offer advice, no longer needs to be involved in program implementation as the expertise in delivering the fund resides in the AANDC Headquarters-Regional Office relationship, rather than through an Infrastructure Canada-AANDC partnership. Case study interviewees also noted that it is appropriate for AANDC to administer the fund moving forward and that although the National Oversight Committee is not an efficient entity and no longer needs to operate, the stakeholders from the Committee should continue to be updated and engaged when necessary on infrastructure development on reserve.
4. Evaluation Findings - Performance
4.1 Effectiveness
Evidence suggests that the FNIF was a high impact fund because the projects were relatively small, numerous and representative of community priorities.
FNIF projects helped to improve community access, road safety, air quality, community pride and increased environmental protection. As a result, FNIF projects had significant benefits for residents and created employment and investment opportunities for the community as a whole.
Literature review, interviews and case studies all confirmed that the FNIF categories were effective investment opportunities. The literature review specifically found that the FNIF categories are the key building blocks for economic development: A Canada West Foundation 2013 study found that energy, communications and transport systems are the most effective infrastructure investments as a form of economic input.Footnote 45 Vytautas Snieska and Ineta Simkunaite's literature review found that transportation and communication infrastructure lower production costs, expand market opportunities and lead to economic growth.Footnote 46 Adam Brenneman and Michael Kerf argue that transportation networks (including roads and bridges), energy systems, and connectivity dramatically contribute to well-being and productivity (accessible job opportunities, affordable products, and improved education outcomes), all of which contribute to gross domestic product and poverty reduction.Footnote 47
Through the FNIF, $240,743,679 was invested in 434 projects across Canada between 2007 and 2013. Specifically, 253 First Nation communities and 20 additional tribal councils and other organizations received funding under the original four FNIF categories while 274 communities were connected to broadband through funding agreements with 13 tribal councils and organizations as well as seven individual communities. The 434 projects included 150 in planning and skills development, 142 in road and bridges, 81 in solid waste management, 41 in energy systems, and 20 in connectivity.

Description of figure 1
This is a bar chart that identifies the proportion of project numbers by the following categories: Connectivity - 20 projects, Energy Systems - 41 projects, Planning and Skills Development - 150 projects, Roads and Bridges - 142 projects and Solid Waste Management - 81 projects.

Description of figure 2
This is a bar chart that identifies investments by categories: Connectivity - $42,066,818, Energy Systems - $11,931,526, Planning and Skills Development - $17,754,059, Roads and Bridges - $137,436,691 and Solid Waste Management - $31,554,585
The regional breakdown for the original four FNIF categories is as followsFootnote 48:
| Province | # of funded First Nation communities per province (excluding connectivity) |
# of organizations/tribal councils that received funding per province |
|---|---|---|
| British Columbia | 94 | 4 |
| Ontario | 47 | 5 |
| Manitoba | 30 | 1 |
| Alberta | 29 | 1 |
| Quebec | 21 | 4 |
| Saskatchewan | 21 | 3 |
| New Brunswick | 6 | 2 |
| Nova Scotia | 3 | |
| Prince Edward Island | 1 | |
| Newfoundland and Labrador | 1 | |
| Total | 253 | 20 |
The FNIF was able to target a large cross section of communities across the country. Overall, 43 percent of Canada's First Nation communities eligible for funding received funding for FNIF projects under the four original categories. Specifically, 47 percent of British Columbia's 198 communities; 34 percent of Ontario's 139 communities; 48 percent of Manitoba's 63 communities; 60 percent of Alberta's 48 communities; 54 percent of Quebec's 39 communities; 30 percent of Saskatchewan's 70 communities; 40 percent of New Brunswick's 15 communities; 23 percent of Nova Scotia's 13 communities; 50 percent of Prince Edward Island's two communities; and 35 percent of Newfoundland and Labrador's four communities received FNIF funding (excluding connectivity projects).
In terms of the overall economic impact of the FNIF, since 2007, the $235 million invested into Aboriginal communities through the FNIF is estimated to have generated $503 million in total economic output, including $250 million towards Canadian national GDP. The funding has created 2,800 jobs with $162 million in associated revenues.Footnote 49
4.1.1 Impacts of Roads and Bridges Projects
| Total FNIF Funding | $137,436,691 |
|---|---|
| Total Number of Projects | 142 |
| Types of Funded Projects | New construction, reconstruction, upgrade, planning. |
| Number of Funding Recipients | 111 |
| Minimum Amount Invested by AANDC for a Project | $5,700 |
| Maximum Amount Invested by AANDC for a Project | $8,915,000 |
| Median Amount Invested by AANDC for a Project | $650,000 |
| Total $ Value of Additional Project Funds | $51,284,993 (38%) |
| Partners Involved | Provinces, Saskhighway |
Key Impacts with Examples
1. Improved community accessibility

Lac Seul First Nation's causeway has transformed the ability of the remote community to more easily access basic supplies, health care and employment opportunities in surrounding areas. According to interviewees, new and upgraded roads also improved the accessibility of the First Nation to other communities, thereby increasing tourism and investment opportunities on reserve.
2. Better health and safety outcomes from reduced dust
Fisher River Cree Nation's road paving project has increased safety for pedestrians who are now more clearly visible to drivers and reduction of dust has mitigated health concerns. In communities with dirt roads, respiratory issues were a priority concern.
3. Safer roadways and bridges
Inspections of roads and bridges are conducted through the three year Asset Condition Reporting System. In March 2011, 87.4 percent of the 222 bridges inspected were rated as "new", "good" or "fair" condition (65 percent were good or new) and 82 percent of roads were rated as "new", "good" or "fair" condition (41 percent were good or new). The FNIF contributed to raising these numbers by building new roads and bridges or improving existing assets.
For example, Poplar River First Nation's road repair project has improved the journey into and around the community for school buses, water delivery vehicles and fire trucks. Additionally, multiple communities within the Roads and Bridges case study reported less flipped vehicles when roads were paved. Similarly, sidewalk projects (sometimes accompanied by street lighting in the energy systems category) were popular with interviewees who discussed significant safety improvements.
Namgis First Nation had major road safety concerns after a young girl was killed while walking home at night. As a result of this accident, the community put together a FNIF proposal for a boardwalk along the waterfront that is now frequented by community members and neighbouring communities.
4. Lower vehicle maintenance and road maintenance costs
Community members in Poplar River First Nation and Whitecap Dakota First Nation indicated that fewer repairs are necessary on their vehicles as a result of improved roadways. For Whitecap Dakota First Nation, paved roads are more cost effective to maintain than the previous gravel roads.
Key Challenges
Costs are significant for road and bridge construction and repair with little available funding sources. For one FNIF-funded community, a bridge was purchased from a neighbouring community. However, some repairs are still necessary, for which they do not have available funds. Practically, this means that water trucks can only carry 80 percent of their capacity and heavy machinery cannot be transported across it.
In terms of monitoring road and bridges assets, in many cases, inspection data have not been uploaded to the Integrated Capital Management System either because of challenges with the system discussed above or because assets reviews have not yet been conducted. This means that the Department does not have a clear understanding of the funded road/bridge inventory or road/bridge conditions.Footnote 50
Expected Return on Investment
To determine the return on investment for the construction or repair of road/bridges, projects have often been evaluated using the cost benefit analysis method.Footnote 51 A World Bank econometric study that builds on a body of this research found that for the period 1983-1992, the average economic rate of return for road building projects was 29 percent.Footnote 52 According to David Canning and Esra Bennathan, an economic rate of return such as this "might be described as adequate but not exceptional."Footnote 53 However, the literature notes that justification for infrastructure projects through their economic contribution is "extremely controversial, and consists of studies that are divided on both the magnitude and direction of the net effect of infrastructure spending on economic growth."Footnote 54 Additionally, Chandra and Thompson note that the economic impact of infrastructure investments in non metropolitan areas remains unclear as 'leakages' are present for certain types of infrastructure projects. For example, new or improved roads/bridges may lead economic activity to shift to nearby metropolitan areas due to the reduced travel time.Footnote 55
Furthermore, Canning and Bennathan state that microeconomic analysis has the potential to overlook externalities, in particular positive externalities, of infrastructure investment. For example, road projects can increase competition and access to markets as well as facilitate access to health, education and other important services.Footnote 56 The authors attempt to include the impact of externalities in their study in order to determine the 'social return on investment' for road projects. While Canada is not included in the study by Canning and Bennathan, the rates of social return on road projects from comparable countries, such as Australia (-1 percent) and the United States (seven percent), are.Footnote 57 While these rates of social return on investment are low, the authors note that the rates of social return were highest in countries with infrastructure shortages.Footnote 58 Therefore, as infrastructure in First Nation communities is commonly lacking relative to other communities in Canada, the social rate of return is likely to be higher than experienced elsewhere in the country.
However, studies promoting the social impact of infrastructure projects have also come under criticism for the quality of their evidence. For instance, Dominique Van de Walle notes that social benefits claimed for infrastructure projects, and in particular the impact of rural road construction, have little convincing empirical evidence.Footnote 59 In Van de Walle's view "although the argument that high social benefits will ensue is sometimes plausible, the evidence provided in justification is rarely so" and furthermore "without better evidence, there can be no presumption that such benefits will be high or even positive."Footnote 60 The author notes that there are so many contributing factors to the benefits claimed by rural road advocates, such as increased educational achievement, that it is hard to attribute these successes to a road project.Footnote 61 As a result, the true return on investment for road and bridge projects is difficult to determine. However, the economic impact analysis for the FNIF estimates that the Roads and Bridges category investment, excluding leveraged funds, generated $278.7 million in output. This included $129.4 million toward Canadian GDP, $83.3 million in income and 1,396 jobs in total.Footnote 62
4.1.2 Impacts of Solid Waste Management Projects
| Total FNIF Funding | $31,554,585 |
|---|---|
| Total Number of Projects | 81 |
| Types of Funded Projects | Construction of transfer stations and landfills, equipment |
| Number of Funding Recipients | 70 |
| Minimum Amount Invested by AANDC for a Project | $10,000 |
| Maximum Amount Invested by AANDC for a Project | $3,483,800 |
| Median Amount Invested by AANDC for a Project | $138,897 |
| Total $ Value of Additional Project Funds | $5,353,354 (20%) |
| Partners Involved | None |
Key Impacts
1. Reduced burning of garbage and less contamination of groundwater (environmental and health benefits)
For Kitasoo First Nation, leachate from the previous landfill was discharging into the ocean. Through the construction of a transfer station and an agreement with the Naut'sa mawt Tribal Council, Robanco and North Arm Barging, the community moves their "sorted" solid waste off reserve.
2. Future cost savings
In both Quebec and British Columbia, where First Nations sometimes dispose of waste off reserve and are thus subject to provincial regulations, provincial governments, will soon charge fines for communities that do not comply with new regulations, including composting regulations in British Columbia and recycling and other waste management activities in Quebec.
FNIF funding has been used in both cases to help First Nation communities transition to compliance with provincial regulations, which will result in future cost savings. In 2010, the Quebec Government updated its Residual Material Management Policy, imposing an additional fee of $9.50 for each tonne of residual waste disposed of in the provinceFootnote 63; savings here will be significant.
3. Communities are reducing, reusing and recycling
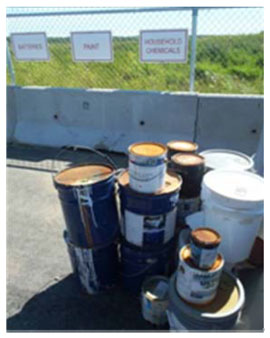
Multiple case study interviewees discussed additional waste management projects that they are now pursing in conjunction with their FNIF funded projects. In Heiltsuk First Nation, items being sent to the new transfer station are first identified for salvage and donation to interested community members before being disposed as a last resort. The community has also begun a composting project.
Key Challenges
A noted key challenge for all regions engaged in the funding of waste transfer stations was the need for last minute training for operators. AANDC regional office staff in some cases needed to quickly develop training sessions to provide First Nation Public Works staff with the necessary skills to run the transfer stations.
Similarly, the need for complementary community education campaigns was widespread as community members were often dumping toxic and other non-desirable materials, resulting in surcharges to the band administration when removing the waste. In some cases, fencing and security guards were necessary as surrounding populations were found to be trespassing and improperly dumping materials. Communities such as Peguis First Nation and Whitecap Dakota First Nation addressed these challenges by building a fence, hiring and training operators, publishing instructions in the community newsletter and delivering a community outreach campaign.
Expected Return on Investment

As cost savings under various solid waste management regimes vary from place to place, the literature emphasizes return on investment in terms of reduction of greenhouse gases. Levis et. al. use a computer-generated model to determine the estimated reduction based on given levels of investment. They find that a $48 million investment in a combination of recycling, waste-to-energy stations (where combustibles are sent and turned into fuel) and landfills will yield a roughly 1.8 billion metric tonne reduction of carbon dioxide emissions over 20 years, the equivalent of taking almost 370 million cars off the road.Footnote 64 Furthermore, a $64 million investment yields a 14 billion tonne reduction (or almost three billion cars) in the same time. Thus, the return on investment in solid waste management in terms of community and environmental health is significant. This is especially significant considering that in 2007, Environment Canada recognized landfills, solid and hazardous wastes, as well as the air emissions from incineration and open burning of garbage as significant on-reserve risks requiring immediate attention.Footnote 65
The economic impact analysis for the FNIF estimates that the Solid Waste Management category investment, excluding leveraged funds, generated $66.1 million in output. This included $40.2 million toward Canadian GDP, $27.3 million in income and 552 jobs in total. Footnote 66
4.1.3 Impacts of Energy Systems Projects
| Total FNIF Funding | $11,931,526 |
|---|---|
| Types of Funded Projects | 41 |
| Types of Funded Projects | Energy retrofits, street lights, green energy upgrades such as solar power, hydroelectric development |
| Number of Funding Recipients | 37 |
| Minimum Amount Invested by AANDC for a Project | $7,800 |
| Maximum Amount Invested by AANDC for a Project | $2,050,000 |
| Median Amount Invested by AANDC for a Project | $136,800 |
| Total $ Value of Additional Project Funds | $29,256,122 (245%) |
| Partners Involved | Private sector energy compan ies to construct projects and provide training. Human Resources and Skills Development Canada (now Employment and Social Development Canada) funding training for community members to acquire energy certification. |
Key Impacts
1. Improved energy security
In Kitasoo First Nation, a lack of energy capacity caused frequent brown-outs that affected community members and the key economic center, a fish plant. Furthermore, Kitasoo First Nation stopped building vital housing because there simply was not enough electricity to support development. In this context, the new hydro electric generator will significantly improve energy security and allow Kitasoo First Nation to continue with housing expansion and business activities.
2. Reduced diesel dependence (cost savings and environmental benefits)
Following research funded by the ecoENERGY programFootnote 67, the community of Wawakapewin First Nation in northern Ontario received FNIF funds to install a 50 kw summer generator and 25 kw solar panels. These will be used to reduce the community's reliance on diesel, and it is estimated that this will cut consumption of fuel by 14,000 L per year. This will yield an estimated reduction of 10.5 metric tonnes in green house gases and $17,000 in fuel costs. Given that fuel prices fluctuate, one key informant mentioned the savings could be as high as $42,000 otherwise spent on diesel, which tends to cost $1.30 more per barrel in Wawakapewin First Nation than elsewhere due to increased fuel costs in remote locations.

3. Increased use of alternative energy sources (economic and environmental benefits)
T'Souke First Nation undertook a $1.25 million solar energy project, which has succeeded in making the community a "net zero" consumer; they are able to produce and sell energy in the summer to British Columbia hydro, which they use to cover their minimal energy bills in the winter, equaling zero costs at year end.
Expected Return on Investment:
Chris Henderson is a co-founder of the Delphi Group and Lumos Enery who has worked in the clean energy field with First Nation communities for over 25 years. According to Henderson, supporting First Nation communities in the development of renewable energy resources is a proven path toward energy security and Aboriginal prosperity. As of November 2013, Henderson has noted that across Canada there are 27 alternative energy projects in operation that are partially owned by a First Nation with 11 soon to be commissioned, 13 in construction, 30 in the feasibility stage, and 46 being analyzed. In total, this represents 127 projects poised to provide increased energy security and a source of own-source revenue for communities.Footnote 68
The FNIF facilitated investments to improve energy security as a matter of health and safety for communities. As a secondary benefit, many experts and academics in the field argue that energy security is a foundational requirement for improving the economic prosperity of communities by allowing businesses to develop and thrive. Additionally, as Henderson argues, the energy industry itself is an opportunity for First Nations to prosper. According to Henderson's research, communities - such as T'Souke First Nation- are using clean-energy projects to create new jobs and fuel long-term investment in economic prosperity. He states that "for First Nation, Métis and Inuit peoples, clean-energy projects must become an economic engine, not just for today, but also for well into the future."Footnote 69 To do this, he argues, it cannot be just about locating temporary employment opportunities or negotiating impact benefit agreements; instead, in order to "to succeed in the business of clean energy, Aboriginal communities need to shift to being active partners in business relationships that are founded on enterprise and effort."Footnote 70
Core ingredients for developing a prosperous clean-energy industry for First Nations include solid community planning, capacity building and human resources training for green jobs. Henderson demonstrates this point by drawing on a number of community examples with the Ojibway of the Pic River First Nation as a noteworthy success. Although not a FNIF funded project, the Pic River example provides insight to the possibilities of an expected return on investment for First Nation energy projects. The Pic River First Nation has taken equity positions in several hydropower projects since 1983 and in return, the band has received employment, income and social stability. The key statistics are as follows:Footnote 71
- A 23 MW hydro-generating plant was constructed
- Its electricity generated can power 17,000 residential homes
- The plant will be the community's financial foundation for 50+ years
- Revenue provided $20 million in income for the local economy during construction
- It has lifecycle income of $400 million (hydroelectric assets have climbed to about $1 million per year helping to finance a women's crisis centre, a youth centre, a recreation center, cable television and high-speed internet services)
- Fifty jobs were created during construction
- Two full-time operating positions were created
Henderson compares this outcome to impact benefit agreements such as where $15,000 was paid to every man, woman and child in the Inuit community of Saluit, Quebec in 2008 by Xstrata. Given this agreement provided for a direct cash payment, "the money disappeared fast and failed to improve the community's economic prospects."Footnote 72
Henderson's findings are corroborated by Brenneman and Kerf's World Bank comprehensive literature review of the impacts of investment in infrastructure, which notes that the many benefits of energy systems include lowering the cost of energy, enhancing the productivity of small businesses and fostering local employment.Footnote 73
The economic impact analysis for the FNIF estimates that the Energy Systems category investment, excluding leveraged funds, generated $26.3 million in output. This included $12.6 million toward Canadian GDP, $8 million in income and 132 jobs in total.Footnote 74
4.1.4 Impacts of Community Planning and Skills Development Projects
| Total FNIF Funding | $17,754,059 |
|---|---|
| Total Number of Projects | 150 |
| Types of Funded Projects | Comprehensive Community Plans, Training, Geographical Information System |
| Number of Funding Recipients | 120 |
| Minimum Amount Invested by AANDC for a Project | $4,744 |
| Maximum Amount Invested by AANDC for a Project | $1,000,000 |
| Median Amount Invested by AANDC for a Project | $92,000 |
| Total $ of Additional Project Funds | $5,073,101 (29%) |
| Partners Involved | In terms of supporting CCPs, regional funders were only noted in British Columbia, including New Relationship Trust, Union of British Columbia Municipalities, First Nations Summit, Aboriginal Business Canada, Western Economic Diversification, Natural Resources Canada, Environment Canada, Real Estate Foundation of British Columbia, Human Resources and Skills Development Canada, Canada Mortgage and Housing Corporation, Public Safety Canada, Health Canada, BC Hydro, RBC Industry Canada |
Key Impacts
1. Long-term sustainable community development
Of the 150 Planning and Skills Development projects funded by the FNIF, approximately 117 were for community planning components with the highest number of projects funded in the British Columbia region. The remaining 33 funded projects were directed toward infrastructure training initiatives.
The production of comprehensive community plans in particular provided communities with a foundational document that articulated a common community vision and key priorities. Moving forward, high engagement and buy-in of involved community members allows for long-term sustainable community development. Overall, the impacts of CCPs were varying but when successful, were significant. For Westbank First Nation, the planning processes culminated in a Community Planning Law. As a result, council cannot act in contradiction to the Plan. Additionally, the Council is obligated to continually engage the community when implementing their plans. The Plan has also become the foundation for developing other community laws.
For one chief interviewed, the CCP was about giving the community a collective vision; he stated, "The community was always asking, 'who are we?' So I wanted to show them who they are." For him, the CCP was essential to bringing people together to collectively design a future. It was about showing them who they are through positive messaging billboards around the community; in reviving traditional ceremonies; on electronic photo screens in the new school showing their community at play; on street signs written in their traditional language; and in the bricks and mortar of their buildings.
Multiple case study interviewees noted that the process of developing a CCP led to community healing and increased cohesion. While difficult to quantify, this impact certainly enhances community sustainability in the long run.
2. Improved First Nations' infrastructure management and technical capacity to maintain infrastructure
The Planning and Skills Development category allowed funding recipients to engage in training to enhance their technical capacity to maintain infrastructure or to engage in infrastructure planning activities. In terms of training, projects such as the "Oil Fired Forced Air Furnaces and Safe Transportation of Diesel Fuel Workshops" for the Keewatin Tribal Council allowed communities to upgrade their skills and expertise. However, the vast majority of funding in this category was provided for planning. Funded planning activities and final documents took on a variety of forms. Key informants noted some plans were completed by experts and were thus highly technical in nature and provided a plan for future economic development and how infrastructure should be developed, used and connected for maximum benefits. Although these types of plans were very relevant to infrastructure management, they often proved less useful to community members who did not feel engaged in the process and thus supportive of the final plan.
Other planning initiatives were community driven and touched on all aspects of community development including social, cultural, and educational priorities in addition to infrastructure planning and economic development. Although these more holistic plans were less specific about infrastructure management, they provided for extensive unexpected community benefits such as community healing as will be later discussed under Section 4.2. Holistic plans that were community driven, provided a broader vision moving forward, which then laid the foundation for engaging in more technical planning activities to achieve the identified priorities. The evaluation noted that the majority of CCP case study communities were pursuing the development of Physical Land Use Plans as the natural next phase of their CCP, thereby allowing the CCPs and Physical Land Use Plans to provide the information necessary for Comprehensive Infrastructure Plans.
3. First Nation collaboration with municipalities and/or provinces
The majority of interviewees from the Planning and Skills Development case study revealed that the CCP process in particular led First Nation communities to reach out to surrounding cities and municipalities for pursuing joint programming, often for the first time. Some interviewees noted that the CCP process was a way to meaningfully engage in targeted discussions with public and private entities and to determine practical steps for collaboration. The CCP process also improved collaboration between First Nation communities as demonstrated by the organic development of British Columbia Region's CCP mentorship network. The network of experienced CCP facilitators began and continues to provide support to communities wanting to begin the long-term planning process.
Key Challenges
The key challenge for funding CCPs was the uncertainty around the final utility and success of the process. For some funded communities, there were major challenges in gaining community buy-in and the support of Chief and Council in implementing the final plan, especially when a change in government occurred during the process. Similarly, while it was found to be important for community members to lead the process, planning champions often do not have the technical expertise to plan for land use or infrastructure development, making it necessary to hire external experts to later complete the additional technical components such as a physical land use plan.
Additionally, the Comprehensive Community-based Planning Pilot Project in Saskatchewan in 2011 found that a paid planning champion was key to a CCP's success.Footnote 75 When planning champions are not retained, there is a risk of losing momentum in the implementation of identified priorities.
Expected Return on Investment:
It is difficult to measure the tangible benefits of community planning; nonetheless, several scholars have tried in contexts as wide-ranging as regeneration of a troubled London neighbourhood, urban growth in China and fisheries management in Bangladesh. Their findings demonstrate the value of community planning for community well-being, economic development, and effectiveness in land use.
Nick Bailey studied the effect of a local planning and training program for residents of Stockwell in London, England. Under this program, a collection of residents were trained in methods on consultation, and 18 people were hired for a total of 20 weeks to conduct community planning and consultation.Footnote 76 At the close of the process, 56 percent of Bailey's interviewees felt the community had improved.Footnote 77 Forty-six percent specifically said it was better or significantly better, and 49 percent felt the community was now a more tolerant place to live.Footnote 78
In Bangladesh, Parvin Sultana and Savitri Abeyasakera studied two sets of communities that had recently obtained management of their own fisheries: those that gave responsibility solely to members of the fishing industry and those who used a participatory community consultation and planning approach. In the communities where the participatory approach was conducted, residents reported 10 percent higher sense of community cohesion, and a 45 percent higher likelihood of the local council supporting the fishery.Footnote 79 Fishery businesses started up more quickly, saving an average of 170 non-governmental organizations days required to facilitate community discussions, and three months beginning business operations.Footnote 80 Poorer fishermen reported five percent higher increases in income, 17 percent higher increases in local fishing knowledge, and 11 percent economic growth for the community relative to those whose approach was not participatory.Footnote 81
Finally, the study in China looked at master plans for growth in five different urban areas. The study found that for those areas with a plan in place, the plan was an effective tool for managing urban expansion.Footnote 82 Moreover, the benefits of planning were found to be stronger in more remote areas.Footnote 83
The economic impact analysis for the FNIF estimates that the Planning and Skills Development category investment, excluding leveraged funds, generated $35.9 million in output. This included $21.9 million toward Canadian GDP, $14.8 million in income and 246 jobs in total.Footnote 84
4.1.5 Impacts of Connectivity
| Total FNIF Funding | $42,066,818 |
|---|---|
| Total Number of Projects | 20 |
| Types of Funded Projects | Fibre optic connectivity- including schools, hospitals, other public service buildings; some planning and preparation studies |
| Number of Funding Recipients | 20 |
| Minimum Amount Invested by AANDC for a Project | $144,000 |
| Maximum Amount Invested by AANDC for a Project | $8,818,310 |
| Median Amount Invested by AANDC for a Project | $563,100 |
| Total $ Value of Additional Project Funds | $150, 499, 543 (358%) |
| Partners Involved | Bell Alliant, First Nations Education Council of Quebec, Eeyou Communication Network, Sasktel, Province of Ontario, KNet, Nishnawbe Aski Nation, Province of Quebec, Health Canada, Province of Alberta, First Nations (Alberta) Technical Services Advisory Group |
Key Impacts
1. Improved delivery of public/government services, including e-education, e-health and remote water monitoring
According to the September 2013 CFMP Performance Measurement Strategy Progress Report, at least 86 percent of First Nation communities are connected to broadband.Footnote 85 FNIF helped to increase the number of communities with access to broadband from 35 percent to 81 percent. At least 274 newly connected communities - where connections were predominantly made to education and health structures - are now accessing e-health, e-learning and even e-justice services. In Alberta, communities are also using their new connections to remotely monitor their water quality. Prior to FNIF connectivity projects, many communities had T1 copper wiring connections, whereas fibre optic cable is now providing internet that is up to 100,000 times faster.
2. Reduced travel
Connectivity case study interviewees provided extensive examples of Chief and Council reducing their travel requirements as meetings are now more frequently held via video-conference. More significant were the examples of reduced travel for community members with health needs. For example, in Manawan, Quebec, community members living with or at risk of diabetes are being tested remotely, saving travel time and costs as online nurses screen 150-160 patients at a time. eHealth (provided by Health Canada, who also partnered on the FNIF connectivity project) in this community has also reportedly (according to case study interviews) resulted in the reduction of premature births by 50 percent as mothers that may not be able to travel for regular check-ups are now doing so through eHealth services.
3. Students becoming electronically savvy
Connected communities are taking advantage of online education resources and for some like Wendake First Nation, innovative technology is being promoted to increase young peoples' technical abilities. For Wendake First Nation, students are provided with the incentive of receiving an iPad upon graduation with the additional goal of helping students maintain contact with their community.
4. First Nation collaboration with provinces and private sector
Connectivity projects were able to leverage significant funding and expertise from provinces and the private sector, as often FNIF funding was able to extend existing provincial initiatives into First Nation communities. In Quebec, the First Nations Education Council, based on the Wendake First Nation reserve outside of Quebec City, worked with AANDC as well as the Province of Quebec on behalf of regional communities. Additionally, the group partnered with the Cree Regional Authority and Eeyou Communication network to extend the fibre optic network to Cree communities in the James Bay area. In Saskatchewan, Sasktel was a major partner in coordination with First Nations and private sector stakeholders while in Alberta, Technical Services Advisory Group and the Government of Alberta, through the Alberta SuperNet broadband network, were project partners.
Key Challenges
Few connectivity challenges were reported aside from the expected logistical difficulties of organizing and negotiating with a large amount of communities to establish community-buy in for the project costs, construction dates and locations of laying cables. At the preliminary stages of the project, the regional offices were not prepared for providing ministerial approval when a third party, such as an internet provider, operates on reserve. These challenges were addressed and should no longer be a challenge in future connectivity projects.

Expected Return on Investment:
While literature that determines the impacts of investments in internet is relatively new, the returns on investment in internet infrastructure are thought to manifest through improvements in health care, child care, education and employment, library services, social interactions and home business development.Footnote 86 In the context of rural areas in the United States, Larose et. al. note that federal contributions can play a positive role, particularly when they foster competition in the market and target education.Footnote 87
One study on broader Organisation for Economic Co-operation and Development investments in broadband infrastructure confirms this positive impact, noting that it improves gross domestic product growth, likely through enhanced labour productivity.Footnote 88 Similarly, a World Bank study in 2010 found that investments in internet infrastructure in high-income countries increased economic growth at a rate of 0.77 percent for every 10 percent increase in the stock of infrastructure. For broadband infrastructure in particular, the rate was 1.21 percent.Footnote 89 The study found that for middle- and low-income countries (perhaps more applicable to some First Nation communities in Canada) the impact was even higher, with rates of 1.12 percent for internet infrastructure generally and 1.38 percent for broadband in particular.Footnote 90 Kandilov and Renkow, in a study that examined the same United States rural broadband initiative as Larose et. al., found results specifically on development of business development. The 98 rural communities that were part of the $180 million investment saw average increases of five percent in employment, 4.5 percent in payroll increases, and, notably, 6.8 percent increases in the number of businesses per community.Footnote 91
Increasing connectivity has significant linkages to all of the Government of Canada's programs and services as connection allows for communities to be more aware of and better able to access programs and services. Similarly, it provides a greater opportunity for AANDC to develop innovative online programs like Alberta region's remote water quality monitoring. While conducting one site visit, the evaluation team was able to see remote monitoring in action when a minor alarm went off, propelling the team into action. This saved a significant amount of time in responding to the issue, which is crucial for safety when resolving water quality concerns. A similar program is being considered in Quebec as a result of the newly established high-speed internet connections. The expansion of this program alongside connectivity projects would significantly improve preparedness and response time to address water contamination – a key departmental priority.
The literature review also indicated that reliable access to high-speed internet is foundational to closing the socio–economic gap between First Nations and non-Aboriginal people. According to Brenneman and Kerf's literature review, the use of information technology and the computerization of administrative processes have had a positive impact on community governance.Footnote 92 Similar studies have shown that in Alberta, the Sunchild E-Learning programs have helped students and employees in the areas of capacity building, administration, and governance,Footnote 93 and in British Columbia, the fully integrated First Nation clinical tele-health networkFootnote 94 is providing "a hub for community information and knowledge sharing."Footnote 95
The economic impact analysis for the FNIF estimates that the Connectivity category investment, excluding leveraged funds, generated $96.4 million in output. This included $45.9 million toward Canadian GDP, $28.7 million in income and 477 jobs in total. Footnote 96
4.2 Unintended Outcomes
Community-driven Comprehensive Community Planning projects resulted in (1) healing transformations; (2) the prevention of third party management; and (3) the improvement of relationships with municipal, provincial and federal governments.
Multiple interviewees that led the CCP process for their community noted that the most powerful outcome of the CCP was how the process itself brought healing to individual community members and to their community as a whole. In many communities, a key challenge of the CCP process was community in-fighting and the obstacles of past historical internal conflicts. Additionally, the CCP in some cases became a political tool thereby altering its intended purpose.
However, for Penticton and Westbank First Nations, the CCP process not only had transformative effects on the repair of broken relationships, but through the interactions of their key CCP stakeholders, the two once-rival communities developed a new partnership. Chief Jonathan Kruger from Penticton First Nation publically encouraged CCP stakeholders at the Annual CCP Workshop to persevere through the initial challenging community engagement sessions, stating: "… it is a problem in all communities but you need to focus on changing things for the future – changing the community for the children so they don't have to experience the dark places that existed…" He noted that it is important for politicians and leaders to "take their hats off" and trust the process, stating, "If you don't have a plan, you are following someone else's plan…" Seeing the transformative power of the CCP process, Penticton's leadership took the healing process a step further and engaged a large portion of their members in the leadership program, "Choices Seminars." The collection of seminars based on business practices provides individuals with tools for "living their lives with clarity and passion" with the goal that "participants leave Choices with a commitment to lives filled with joy, passion, peace and abundance."Footnote 97
Other examples of the CCP process having transformative benefits for communities include the Thessalon First Nation's CCP process. Prior to commencing their CCP work, community meetings and community engagement were non-existent. The CCP planning process allowed the community to articulate as a collective where they wanted to go for the first time. Community meetings were held as feasts and engaged a broad cross-section of community members where individuals were motivated and highly engaged in discussion.
The Kinistin Salteaux Nation identified in their CCP that they wanted to restore their lost Pow Wow grounds - a key component for encouraging social cohesion. Once the concept had been identified, the community looked at the obstacles in the way to achieving their goal and with limited funding options identified a creative solution: telephone poles. After sending out an advertisement to surrounding communities, the First Nation was contacted by a local farmer who was looking to dispose of a large amount of telephone poles. During a two week period, the community came together to build the structure, and with the support of a power company in Saskatchewan, was able to secure donated guide wires to securely hold the structure in place. The project became a way of forging relationships, and as one of the planners involved in the project noted, people started changing their perceptions on how the community can in fact rally together to find creative solutions that are not dependent on the availability of federal funding.
One of the most noteworthy transformations was how the CCP process impacted the Skin Tyee First Nation. Originally part of the Nee Tahi Buhn Band but recognized as an independent First Nation in 2000, Skin Tyee First Nation saw the CCP process as the answer to addressing their key financial challenges that were soon going to bring the community into third party management. The Chief had attended the CCP Annual Workshop in 2012 and after seeing the benefits of the CCP process for other communities, he made planning through extensive community engagement a priority. Working with the British Columbia regional office staff, a management action plan was made that provided for a CCP intervention. This represented a very non-traditional approach for the Department, but the willingness to do so yielded substantial benefits.
The band started the CCP process by creating a Facebook page, conducting workshops in the community as well as off reserve, and sending out surveys to community members. The community worked with mentors from Penticton and Gwa'sala-'Nakwaxda'xw Nations who developed multiple surveys for health, human resources and housing. They also conducted an analysis of strengths, weaknesses, opportunities and threats, and created a community member contact database so that when opportunities arise they can match people with jobs. As a result, the community came together and the Band Administration had a plan for effectively managing their resources, finances and for addressing key community concerns. As one interviewee stated, "even a year ago, Elders couldn't be in the same room together because of historical tensions, and now they are weaving baskets together…" Similarly, the plan allowed for the community to forge new relationships with surrounding First Nation communities, municipalities and businesses. For example, the difficulty in accessing education was raised as an issue, so an education society with neighbouring First Nation communities called the Lake District Training to Employment Society was developed to provide transportation, child care and support for community members living in Burns Lake accessing education programs. Additionally, opportunities for economic development were identified as a priority and for the first time the community developed Joint Venture Companies with mining, lumber and pipeline companies.Footnote 98
Completed FNIF projects provided communities with tangible results that sparked momentum for communities to engage in additional initiatives and identify unexpected opportunities for economic development.
For Kitasoo First Nation, the development of a transfer station resulted in a significant increase in awareness of the need for proper waste disposal. This sparked awareness of the importance of recycling, waste recovery, and general environmental sustainability in the community. Heiltsuk First Nation was also inspired by their new transfer station and the development of a salvage store and a composting project that they are hoping will develop into a greenhouse to grow local vegetables. Similarly, two community members from Peguis First Nation decided to take charge of the recyclable materials that were being thrown into their community's landfill. Of their own initiative, they sought funding from council who applied for FNIF funds, turning their small initiative into a recycling plant and launching a community education campaign. Today, Peguis First Nation is one of the most advanced communities in recycling within the province with high community buy-in and high student volunteerism in the program.
For T'Souke First Nation, their solar project resulted in unexpected eco-tourism from interested Australian and New Zealand members of a United Nations working group who hosted their environment sustainability conference in the community. Similarly, Namgis First Nation was able to increase its tourism through the construction of a boardwalk that links to the boardwalk of a neighbouring community. As a result, it is being traversed by First Nation community members and surrounding communities. This encouraged Namgis First Nation to build a cultural centre at the end of the boardwalk to build community pride and to better share their culture and history with visitors. The increase in foot traffic has also inspired community beautification efforts where individuals are taking more pride in their homes' exteriors and gardens.
5. Program Design and Delivery
The FNIF proposal-based program design posed numerous challenges and as a result, FNIF project proposals should be incorporated into the Department's annual National Capital Planning Process by strengthening the priority ranking criteria of the First Nations Infrastructure Investment Plan's "Community Infrastructure" component.
Issue #1: The majority of regional offices found it necessary to develop a new project selection method despite a pre-existing infrastructure prioritization process.
Headquarters established six basic criteria when selecting projects to be funded by the FNIF:
- The Project is supported by a Band Council Resolution or a Tribal Council Resolution or other documentation from self-governing First Nations;
- The Project must be consistent with a sound strategy and/or community plan for its respective category;
- The Project must be consistent with Canada's objectives in respect of sustainable growth, competitiveness, and climate change;
- The Project must be consistent with all applicable federal and provincial regulatory obligations and standards, as applicable;
- The Project demonstrates principles of sound budgeting (based on well-documented needs, is cost-effective, demonstrates full costs and cost-sharing, consulting fees and salaries are reasonable and justifiable, etc.); and
- The Project's results (deliverables) are measurable and achievable.
Regions were also provided with category-specific considerations, and in the third call for proposals, Headquarters mandated that priority be given to the connectivity category, which had just been established. Beyond this, however, the criteria for selecting projects left significant flexibility for regional staff to use their discretion in determining the method of allocating funding across the five project categories. Multiple key informants at Headquarters and across the regions noted the importance of regional flexibility, explaining that regional staff are most aware of local community needs, and therefore, most prepared to ensure long-standing community needs and priorities are met. For example:
- There was strong interest in funding Comprehensive Community Plans in British Columbia, whereas there was no uptake in Saskatchewan because First Nations in the region had long-standing community plans.
- Solid waste management was very important in Quebec due to changing provincial regulations, whereas it was not necessary in the Atlantic because of previous efforts to close landfills and build transfer stations.
- There is little need for continued connectivity work in Saskatchewan, whereas it is a top priority for Ontario moving forward.
- For some regions, leveraging funds was the preeminent selection criterion and only project proposals with significant cost sharing components were even considered for FNIF investments.
The table below shows the variation in regional project selection:
| Region | Number of Projects Funded | Categories with the most projects | Future Priorities |
|---|---|---|---|
| British Columbia | 149 | Planning and Skills Development (97); Roads and bridges (19) | In-land solid waste; advancing community plans; sustainable energy for off-grid communities |
| Ontario | 82 | Roads and bridges (32); Planning and Skills Development (17) | Roads and bridges;ongoing connectivity work |
| Manitoba | 58 | Roads and bridges (31); Planning and Skills Development (13) | Northern roads and bridges; solid waste management |
| Quebec | 52 | Solid waste management (21); Roads and bridges (21) | Solid waste funding for trucks and bins; ongoing connectivity work |
| Alberta | 45 | Planning and Skills Development (17); roads and bridges (15) | Northern roads; wind and solar power projects |
| Saskatchewan | 31 | Roads and bridges (15); solid waste management (12) | Road and bridge upgrades; solid waste management |
| Atlantic | 17 | Roads and bridges (9); Planning and Skills Development (5) | Paving of roads, mainly internal |
While flexible selection criteria allowed regional staff to address local infrastructure needs, there were no criteria to distinguish between categories; for example, there was no method to determine whether a road was more important than solar panels. As such, most regions struck working groups to establish ranking criteria, followed by selection committees for each category. The results then had to be approved by the Regional Director General before funding was distributed. This was an onerous time commitment considering that a broader infrastructure prioritization process already exists. In contrast, it should be noted that the Saskatchewan region was able to adapt the pre-existing process to rank and select FNIF projects, demonstrating that the annual Capital Planning process discussed in Section 1.2.4 and outlined in Annex A can be used for FNIF selection as well.
Having one standardized approach, drawn from regional best practices, would save time and resources. Additionally, targeted funds like the FNIF may arise in the future, and as such, developing a standard ranking and selection process for community infrastructure projects will allow regions to quickly and consistently administer funds.
Issue # 2: Ability to engage First Nations in the selection process
First Nations' input into the selection process was thought to be ideal, as it allowed for a decision-making partnership and transparency in final project selections. However, First Nation involvement in the FNIF selection process varied from region to region. In two regions, First Nations did not take part in the selection process as they felt it would be a conflict of interest to decide on the results of each other's funding requests. The participation of technical representative organizations was found to be effective. In one region, tribal councils have historically been involved in ranking the priority of projects, which has proven to be a best practice for encouraging transparency while making First Nation communities confident in why certain projects are funded over other projects.
Issue # 3: First Nations' Capacity Issues
Case studies and key informant interviews revealed that the proposal-based design created challenges for First Nation communities with low technical capacity. Due to the requirements of the application, many communities required the assistance of consultants or Tribal Council technical staff. Key informants felt that communities who did not have the expertise (or financial resources to hire consultants) necessary to develop a high quality proposal were at a disadvantage in the proposal-based system. One interviewee, experienced with drafting proposals for her First Nation, stated, "It is the First Nations that know how to write proposals that get the money."
Additionally, the application process was found to be demanding of First Nations' time and resources, with communities often struggling to complete the applications within the timeframe. Similarly, interviews with regional staff and First Nation communities highlighted that the limited timeframe had an impact on communities' abilities to develop project partnerships with private, municipal and provincial partners.
Key informants also noted that the proposal-based design encourages communities to submit a proposal in the hope that they are selected, regardless of how prepared they are for such an undertaking. As a result, AANDC technical staff often are required to spend time working with successful applicants to reach a point where the project is ready for implementation.
Working within the Annual National Capital Planning Process would give First Nations and regional offices the time to work together to allocate resources based on community needs, mitigating concerns surrounding capacity for proposal-writing.
Issue #4: Tight timelines and misalignment with construction season
The time of the year in which funds were released to communities, as well as the timeframe in which the money was required to be spent, created challenges for First Nation communities, particularly those that are remote or have low technical capacity. For example, multiple regions indicated that funding was not released until February with an April 1 deadline for construction completion. All regions noted that the fiscal year funding process is not well-aligned with the construction season, which can cause a conflict between the period in which funds must be spent and the period in which projects can realistically be implemented. As a result, many projects were not completed within construction seasons resulting in delays and complications regarding the carrying over of funding. Additional challenges were noted as proposals submitted required a substantial amount of technical review and support to finalize details before construction could begin often leading to deadlines being missed or projects being delayed.
The literature review also revealed similar findings for remote communities working in conditions that limit the speed and timing within which an infrastructure project can physically be implemented. Isolated communities typically do not have "shovel-ready" plans on-the-shelf.Footnote 100 Thus, the cost of construction and operating, as well as the amount of lead-time needed for contractors to plan and prepare, all impede First Nations infrastructure initiatives in remote communities.
According to Jason McCullough and Khosrow Farahbakhsh, many targeted funding programs comparable to FNIF "follow the same end-of-fiscal funding schedule" that evidently has dramatic effects on communities. The authors emphasize that remote communities generally lack adequate internal funds for investment or leveraging. In addition, these communities typically need to accommodate construction shutdown and contractor mobilization issues related to winter conditions. As such, the end-of-fiscal window has left many remote communities unable to capitalize on community infrastructure development opportunities.Footnote 101Solution: Integrating and enhancing existing infrastructure prioritizing and planning processes
As mentioned above, the proposal-based design necessitated the creation of a new selection and monitoring process for the implementation of the FNIF, despite the National Capital Planning Process currently in place and described in Section 1.2.4. Given the challenges outlined above, interviewees agreed that future community infrastructure funding programs should not rely on a proposal-based design, but be integrated into the broader annual infrastructure planning process. Currently, First Nation communities develop community infrastructure plans that are then evaluated using the National Priority Ranking Framework, included in Annex A, before projects are included in the regional and national First Nations Infrastructure Investment Plan. The community infrastructure plans indicate their current, new and needed infrastructure with the opportunity to identify community infrastructure projects. It is therefore logical that targeted funding sources, such as the FNIF, would be applied to these listed projects instead of developing additional temporary proposal-based processes. Strengthening the national priority ranking framework with a process that differentiates between Community Infrastructure priorities, and subsequently integrating the FNIF into the annual planning process, would provide several advantages:
- Allow communities more time to properly assess their needs, their priorities and a strategy for life-cycle costing that would incorporate operations and maintenance considerations into project costs.
- Allow communities to develop a more holistic vision for their infrastructure needs.
Strengthening the National Capital Planning Process outlined in Section 1.2.4 would ultimately allow for consideration of how FNIF-funded projects produce positive externalities related to other economic and social priorities. Key informants across the country noted impacts of the FNIF such as the protection that waste management gave to ground water and soil quality (which has clear implications for contaminated sites); connectivity projects have unlocked the potential for communities to monitor water quality remotely; roads and bridges may in some cases allow communities to access nearby schools without additional spending; and improved energy systems have caused a reduction in personal housing expenditures. In other words, FNIF projects likely have impacts on other infrastructure priorities and could thus affect allocation of resources; if infrastructure programs continue to operate in silos, however, these potential gains will not be realized.
Although the Annual Capital Planning Process provides a potentially universal method for identifying infrastructure projects, the First Nations Infrastructure Investment Plan process and tracking tools would need to be reviewed and updated to accommodate the FNIF. Specifically, a method for prioritizing between the five infrastructure categories would need to be developed. Additionally, multiple regional staff interviews suggested that it would be beneficial to move the submission of First Nations' Capital Plans to a May deadline; with six to eight months available to develop technical designs, projects can be funded and implemented starting April 1of the following year. Interviews with regional staff and First Nation communities have highlighted that a limited timeframe has affected communities' abilities to develop meaningful project partnerships with private, municipal and provincial partners.
In consultation with regional offices, several best practices for consideration of a renewed selection process have emerged:
- Alberta uses the First Nations Technical Services Advisory Group, an apolitical Aboriginal engineering group with extensive technical expertise, to review projects. Where possible, participation of other regional organizations should be encouraged.
- Quebec's quantitative FNIF ranking tool has been tested for objectivity and consistency of use, and allows projects to be assigned a final score to then be ranked.
- Ontario's Thunder Bay region invites other sectors to its capital meetings with its First Nations to encourage a one-window approach.
The Saskatchewan model of ranking all infrastructure proposals with a singular tool represents an ideal goal. Saskatchewan region has a long-standing regional Capital Plan that is supported by a history of consistently funding community planning. Proposals received under the FNIF were simply screened and inserted into the regional Capital Plan. In some cases, First Nations did not even have to submit proposals as their long-standing priority projects were already on record and were automatically considered. A permanent First Nation selection committee for all infrastructure investment decisions ranks the list of projects, and the regional office then shares the ranking results with all communities for transparency's sake and so that all First Nations are aware of the rationale behind the decision-making process.
Recommendation 1: It is recommended that the Community Infrastructure Branch examine the feasibility of integrating the call for FNIF project proposals into the Department's annual Capital Planning application process.
Completed FNIF projects put pressure on the already-strained CFMP budget as it funds their Operations and Maintenance support. Additionally, completed infrastructure projects are rarely operated and maintained for optimal infrastructure sustainability.
Key informant interviews indicated that many of the assets constructed on reserve through the FNIF and other funding mechanisms are not properly maintained, and as a result, are prone to breakdowns and premature decay. The broader result for communities and AANDC is a shorter lifespan for constructed assets and thus, increased costs in having to replace infrastructure earlier than the infrastructure's expected demise. The premature degradation of assets also poses a safety risk for community members.
Case study interviewees noted that when assets are constructed, AANDC allocates a proportion of dedicated operations and maintenance funding for the operation and maintenance of each constructed asset on reserve; however, without dedicated operations and maintenance funding from the FNIF, operations and maintenance costs for the completed infrastructure are sourced from the CFMP, which reduces the CFMP's ability to meet other infrastructure construction funding needs. Additionally, concerns exist regarding First Nations' operation and maintenance of the constructed assets including: (1) the remaining operations and maintenance costs are often not sourced due to a lack of funding mechanisms for the Band; (2) there is a lack of maintenance planning; and (3) there is a lack of personnel with the necessary training to maintain the assets.
Interviewees suggested that prior to funding a project design, AANDC project officers should work with the First Nation to identify the remaining operations and maintenance funding sources based on the asset's expected life-cycle cost and that a plan be put in place to target training requirements.
Recommendation 2: It is recommended that the Community Infrastructure Branch expand existing management and oversight documents to ensure funded projects include: (a) identification of operations and maintenance funding sources that adequately meet the life-cycle cost of the asset; (b) identification of necessary training requirements; (c) disaster mitigation infrastructure design elements; and (d) an expanded eligible recipients list to allow for more flexible partnerships with the private sector, academia and Aboriginal organizations.
Performance Measurement is a continuing challenge for infrastructure programming. There is a need for a concerted effort to rectify the shortfalls of the information technology tracking applications to encourage their consistent use.
The evaluation noted that for the FNIF, multiple systems, procedures and resources are in place to monitor and report on the results and performance of funded assets. However, these systems are not effective due to inconsistent data collection and entry into the Integrated Capital Management System software.
The primary source documents for outlining the FNIF performance reporting strategy are in the departmental Performance Management Framework and the Infrastructure Performance Measurement Strategy, last updated for 2014-15 and in 2010 respectively. To support the monitoring of assets on reserve, the Asset Condition Reporting System Inspection was developed. The results from these inspections were intended to be tracked using the Integrated Capital Management System alongside additional project tracking information.
However, there are multiple concerns with each of these components. First, concerns have been raised regarding the Asset Condition Reporting System as interviewees and case study participants found that the quality of reports (done by engineers every three years regarding the health of infrastructure portfolios on reserve) varies significantly and are not comparable between communities due to a lack of a standardized template. Shortfalls will potentially be addressed by the current Asset Condition Reporting System renewal process.
Second, key informants noted that the Integrated Capital Management System has not been user-friendly. Specifically, previous infrastructure software systems that were combined to create the Integrated Capital Management System were not properly integrated. As a result, user interfaces were confusing for both the project planning and project tracking components of the software; information inputs were required on multiple separate pages with many different steps; and information was hard to retrieve once put into the system. Therefore, it has not yet been systematically used by each region and the system does not always produce meaningful performance results as information is neither consistent nor reliable. Similarly, not all project approval and final reports were stored consistently on the complementary First Nations and Inuit Transfer Payment system, now called the Grants and Contributions Information Management System, making it difficult to centrally monitor FNIF projects' status and results. Strides are currently being made to update the Performance Measurement Strategy with a target completion date of April 2014. A working group is also currently making revisions to the Integrated Capital Management System with input from regional representatives. However, key informants felt that only incremental changes will be made over the next few years to improve the system.
5.1 External Factors Impacting Program Success
Regional inflation limited the amount of projects that could be funded in provinces experiencing significant economic growth as costs were high and contractors were few.
For Alberta and Saskatchewan regions where inflation is a significant factor, funding was especially constrained by rising construction costs. Average hourly wage inflation in Alberta's construction industry outstripped the Canadian average by 1.55 percent in the 2008-2012 period, and the national average was outstripped by Saskatchewan by 3.08 percent.Footnote 102 One key informant noted that infrastructure projects are now five to ten times more expensive than before the boom. Additionally, the proposal-based design was problematic when projects were approved several years in advance of construction. For some communities that dedicated a percentage of their own-source revenue to project costs, the costs became too high for them to afford. The rising costs were also difficult for managing regional budget allocations. For one First Nation in Alberta, a road project assessment from 2005 estimated a total cost of $12 million, which had risen to $22 million in 2013. Thus, the project is no longer fiscally feasible for the community at this time.
Technical expertise for supporting project designs and construction oversight was not always readily available, which in some cases left First Nations vulnerable to overpricing and poor design from contractors and consultants.
Vulnerability due to lack of technical expertise
Case studies and interviews revealed that First Nation communities do not always readily have access to the capacity or expertise to review infrastructure project designs and construction contracts. Interviewees cited examples in which contractors and consulting firms hired by First Nations were: (1) overdesigning projects to secure more funding; (2) not being held accountable for poor or failed designs; and (3) submitting extremely costly bids due to the high-demand/low-supply environment in some regions.
In general, First Nations have access to AANDC regional technical staff, Tribal Councils, regional Aboriginal technical organizations and contracted firms for technical support and advice when designing and constructing community infrastructure projects. However, in some cases, remote First Nations who lack the necessary internal technical expertise were not able to access the support they needed resulting in faulty completed projects and lost investments. For one FNIF funded community, an $8 million hydro-electric dam did not achieve its intended results as a result of a major design error. The community originally sought to double electricity output but only received 50 additional kilowatts of energy per hour as a loss of friction in the water pipe was not accounted for. This design flaw resulted in millions of dollars in sunk costs for AANDC. An additional $2 million will be necessary to address the design error, which the community does not have at its disposal.
Similarly, interviewees from the Public Works Department of a high capacity First Nation said they are often presented with overdesigned bids from engineering firms: "We are lucky to have the capacity to know when we are being overcharged or presented with overdesigned projects." Additionally, the interviewee noted that it is becoming more common place for contractors in the region to overbid in order to compensate for expected challenges when working with First Nation communities such as late payments.
Mitigation strategies and other resources
For Penticton First Nation, to mitigate contracting challenges previously experienced, Chief and Council have modified their contracting procedures to increase contractor accountability. Contracts now include provisions that if the contractor makes a mistake or misjudgement in terms of design and construction elements, any additional expenses will be the contractor's responsibility.
The Saskatoon Tribal Council technical staff often provide an oversight service to First Nations designing and constructing infrastructure projects, which has reportedly resulted in many design errors and overdesigned projects being caught before construction. With impending reductions to Tribal Council budgets, this technical support will be reduced, which could pose a risk to AANDC when investing in future infrastructure projects. In Ontario and Alberta, regional technical organizations have been seen as a best practice. The Ontario First Nations Technical Services Corporation and the Alberta's Technical Services Advisory Group support communities in developing feasibility studies, life-cycle costing analysis, training for personnel, etc. For example, when Frog Lake First Nation needed a new water pump, Technical Services Advisory Group was able to save them 50 percent of the cost by buying pumps for multiple communities.
AANDC technical staff are sometimes able to provide a review and oversight function in the design and construction of projects. One interviewee noted "sometimes consultants come in and propose unrealistic or inefficient ideas", and in such cases AANDC regional staff have been able to provide advice for the negotiation of more appropriate project designs. One region noted that requiring a project manager to be hired with the necessary technical expertise to oversee project designs and construction was a best practice as often AANDC regional staff only has limited knowledge in certain technical areas and staff can miss design errors when working with unfamiliar infrastructure projects. Interviewees cited examples where projects were run smoothly when the contractor, First Nation, project manager and regional office project lead had meetings every two to four weeks until project completion.
Recommendation 2: It is recommended that the Community Infrastructure Branch expand existing management and oversight documents to ensure funded projects include: (a) identification of operations and maintenance funding sources that adequately meet the life-cycle cost of the asset; (b) identification of necessary training requirements; (c) disaster mitigation infrastructure design elements; and (d) an expanded eligible recipients list to allow for more flexible partnerships with the private sector, academia and Aboriginal organizations.
6. Lessons Learned and Best Practices
Comprehensive Community Plans have been growing in popularity and utility as a result of nine key best practices.
During the course of the evaluation, it was learned that many of the CCPs, developed as part of the Planning and Skills Development Category, had dramatic social and governance impacts on participant communities, as noted in Section 4.1.5. The experience of these communities extended well beyond the expected benefits and impacted many more elements in participant communities than just community infrastructure. While CCPs are just one eligible item in the Planning and Skills Development Category, it was a significant item with $17,754,059 spent on 150 projects. A special focus has been placed on CCPs in this section due to evaluators' findings of significant positive change in participant communities.
In total, nine key best practices were noted as contributing to successful CCPs. While many of these practices lie outside the mandate of the Community Infrastructure Branch, their impact on participant communities necessitated their inclusion in this report to showcase and further the positive work being undertaken. As the Community Infrastructure Branch continues to provide funding to CCP development, it will be necessary to engage others in the Department, in particular the Professional and Institutional Development Directorate, within whose mandate the activities also fall, in order to continue and expand upon the positive outcomes of CCPs in First Nation communities.
While the FNIF was an important source of funding, CCP is not a new concept and has been funded by AANDC through various programs and other resources for over 13 years. However, analysing of previous evaluation reports, reviews of CCP pilot projects and case studies with FNIF-funded CCPs demonstrate that CCPs have had varying degrees of success. For some communities like Penticton First Nation and Musqueam Indian Band, the process itself was a powerful tool for bringing the community together and healing family and political divisions. For others like Westbank, Pictou Landing and George Gordon First Nations, the Plan has become the foundation for developing all internal work plans and shaping the foundation from which the band administration is structured and governed. However, it appears that nearly half of the communities that engaged in CCP activities, plans are not implemented and are left to collect dust on a band office shelf. Interviewees and case studies revealed multiple best practices for seeing a plan implemented successfully:
1. CCP Champions and Mentors
One of the key lessons learned from the Dalhousie University's Saskatchewan pilot and British Columbia region's current involvement with CCPs is the need for community champions and CCP mentors.Footnote 103 Interviewees noted that there are a lot of passionate people in the community that can either lead or facilitate projects to address community priorities. A key element of the CCP process is the ability for the tool to mobilize individuals that have a passion or skill by aligning their interests with community priorities. Similarly, by identifying a range of opportunities, community members that have not previously engaged in community leadership positions, are able to see how they can be of value to the improvement of their community. In the case of T'Souke First Nation, one individual passionate about gardening was able to lead the development of their community garden program. Not only as the Gardening Community Champion is she able to share what she loves to do with the youth engaged in the program, but the vegetables grown are used for a meals-on-wheels program to support local elders in need – a key priority in their CCP.

Similarly, there is a growing group of experienced CCP coordinators and workshop facilitators that are now being requested by other communities to support their CCP process. One mentor interviewed commented that a lot of new CCP leads feel overwhelmed with how to start engaging the community, how to identify objectives, and how to write the report. Some communities have gone through lots of engagement sessions but the individual leading the process does not necessarily have the capacity to then analyse the data and complete a final report. The British Columbia region CCP Mentorship Initiative administered through the Nautsa mawt Tribal Council thus provides support, tools, frameworks, and the sharing of best practices to be successful. According to one of the current mentees interviewed, "our plan wouldn't be what it is today if other communities hadn't stepped up to support us." The mentee continued to highlight that for CCP Champions "it gets hard… there is a lot of pressure, a lot of responsibility to find consensus, and you're dealing with a lot of hurt and history in a community… you need to have support."
As a result of successful mentorship experiences in British Columbia, CCP mentors are being sought outside of their British Columbia provincial borders. For example, to support the CCP development for the Sayisi Dene First Nation in northern Manitoba, the British Columbia regional office has invested in two mentors to provide support for building the capacity of the Sayisi Dene CCP Champion.
This concept of AANDC investing in a growing CCP mentor network is aligned with best practices gleaned from international development literature in the area of supporting "Social Entrepreneurs". Where an entrepreneur is typically an individual that locates niche markets and creates innovative approaches with the intention of making a profit, a Social Entrepreneur is an individual who has found a creative approach for working in a community with the intentions of making social profits.Footnote 104 By investing in these individuals, studies have demonstrated greater social benefits. Similarly, by investing in social entrepreneurs, the focus becomes not only on addressing the issues at hand, but about moving communities away from a dependence on aid and instead it encourages local capacity.Footnote 105
These examples and studies point to the benefit of expanding the British Columbia region CCP Mentorship Initiative administered through the Nautsa mawt Tribal Council currently consisting of 12 mentors; however, it also highlights the current challenges regional offices have in funding such desired initiatives and the limitations in calling upon mentors solely from British Columbia. The evaluation thus suggests that the Department invest in First Nation CCP mentors and formally expand the network across Canada through the development of a First Nation to First Nation Mentorship Program.
2. The Annual British Columbia CCP Workshop
For over 10 years, AANDC's British Columbia regional office has supported an Annual CCP Workshop in order to bring together First Nation communities engaged in community planning to provide practical tools and support. The 2013 Workshop was co-hosted by Little Shuswap Lake Indian Band and AANDC from October 1-3, 2013. Over 100 attendees representing 50 First Nation communities participated. Key note speakers from First Nations implementing their CCPs shared their stories and provided practical workshops on topics such as: Finding the support you need to get started; Engaging community members; Monitoring and evaluating planning progress; Integrating CCP with other planning processes; Indigenous planning as a healing process; and Keeping the plan alive. Workshop evaluation results were extremely positive and as a result, a Spot Light Session on CCPs was then provided during the October 15-17, 2013, Joint Gathering in Vancouver. Co-hosted by AANDC British Columbia Regional Office and the British Columbia First Nations Leadership Council - which is made up of the British Columbia Assembly of First Nations the First Nations Summit and the Union of British Columbia Indian Chiefs - the Joint Gathering was designed to build on the quality work already underway by First Nation communities, organizations, and government officials. The session was reportedly well-received and has given additional momentum to CCP processes in British Columbia First Nation communities.
Interviewed academics working in the planning field also noted the need for expanding a CCP Workshop to the national level. Interviewees stated that planning best practices are currently shared anecdotally between communities, planners and consultants but that a forum to bring all these stakeholders together would be extremely beneficial for gaining momentum, implementing best practices and supporting lower capacity communities across Canada.
3. Quick Start Projects
Case study interviewees and a review of the Saskatchewan Pilot Project noted that "quick start" projects are essential to building momentum and buy-in for the CCP process, making visible impacts in areas as wide ranging as environment, social life, infrastructure, and health.Footnote 106 As the process can take up to six years to complete, it was necessary to start implementing projects immediately so that community members could see that their voices were being acknowledged. Examples of completed "quick start", or also termed "quick win" projects, included:

- Positive role model billboards around the community
- Traditional language street signs
- Hosting community dinners and cultural events
- Summer language camps
- Publishing children's books in traditional languages
- Supporting adults in obtaining their high school diplomas
- Regular hiking outings with spiritual leaders to learn about the community's history and to visit sacred locations
- Elder bingo nights, youth programs and drumming groups
- Drumming groups
- Residential school memorials and war memorials
- Biking and hiking trails, camping trips and canoe journeys with neighbouring First Nations
- Cultural festivals, theatre productions and traditional fashion shows
- Greenhouses and community garden programs
- Training classes such as constructing cedar boxes and weaving baskets
- Sheltered bus stops
- Community healthy eating and fitness challenges
- Community safety watch programs, clean-up days and life skills and wellness evenings
These projects demonstrated to community members that the new planning process was going to produce tangible results and not just remain as a document on the shelf; in many cases, these activities have resulted in increased community cohesion. However, CCP Champions interviewed noted the difficulties in finding funds to implement these smaller projects highlighting the need for a specific funding source for small CCP priority initiatives – a "seed funding" model. When asked about the need for funding smaller CCP initiatives, one interviewee stated the following: "It's about building on success. When people see tangible results, they are inspired!… It's about building hope… It's the opportunity to purse innovative approaches."
4. Community Engagement

Multiple lines of evidence, including the Saskatchewan Pilot, conclude that community engagement is essential for community plans to be useful and adopted.Footnote 107 The most successful CCPs were found to be in communities where consultants were used minimally to primarily build the planning capabilities of the assigned community planning champion. For Musqueam Indian Band, a planning consultant was hired to provide the local CCP Champion with the support and expertise needed to lead the process. The consultant helped to develop the first community survey and to analyze the results as well to physically map the community by conducting fly-overs. Through this targeted process the staff gained experience and skills and no longer need to rely on a consultant to further the work. It was also noted by other interviewees that consultants can be valuable in providing a neutral opinion. Some community members did not want to talk to the staff members running the CCP process due to past community conflicts but they were more trusting of the process when an external expert was also involved. Similarly, interviews with Dalhousie's Cities and Environment Unit commented on the importance of having the right technical experts involved in the process but as a support function so that planning expertise are fostered within a community.
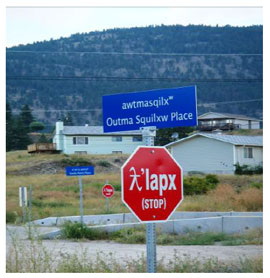
When in Chase, British Columbia, at the annual CCP Workshop run by the Little Shuswap Lake Indian Band, the evaluators participated in workshops delivered by First Nations for First Nations engaged in CCP. A key message from all workshops and key note speakers was the necessity of making the CCP a community-lead process and that "community" needed to include the Chief and Council, band council staff, youth, elders, on and off-reserve and, in some cases, other individuals and businesses renting reserve land. To reach out to a complete cross-section of the community, interesting techniques and best practices were shared by participants. For Penticton First Nation, black hoodies with safety reflectors in the shape of their CCP logo were used to entice young people to participate – while also keeping them safer when walking at night where there are no sidewalks or street lights. In Musqueam, they provided the youth with cameras to document what they liked about their community and what they wanted to see changed. T'Souke First Nation held a three day youth camp where the participants were asked to describe what they would do if they were chief. Skidegate First Nation also saw the necessity of getting younger generations passionate about planning and held special workshops for youth to draw what they liked and what they wanted their community to look like in the future.
For Shoal Lake Cree Nation, building an outdoor classroom was identified as a key part of their CCP as the young people in the community voiced their concerns that they felt locked away. The community built it with help from universities in Manitoba and an interview with a planner supporting the project noted that "young kids who could hardly hold a hammer were part of the process." This type of experience helps to foster community buy-in for the CCP process and resulting projects.
For Westbank First Nation, the CCP champion first went to the elders to see how they planned and how they made decisions in the past in order to use that knowledge in how they did their community planning. It was from this purposeful consultation that the community then rallied behind their traditional story of the Five Food Chiefs, which set the structure for how their community plan would take shape.
T'Souke First Nation held special elder engagement sessions through hosting a 10 Mile Diet banquet and reached out to mothers in the community that often cannot attend community meetings with their infants. Through mom and baby groups, mothers were solicited for their opinions and in return were provided framed photographs of themselves with their babies.
One CCP Champion interviewed spoke about her personal efforts to engage every member in the discussion even when it required going to individuals' homes, bringing groceries over, and hosting dinners at her own home. Similarly, another community planner who was passionate about getting their youth involved stated, "look to the youth. We are seeing volunteerism disappear from the community. It has to be about getting them involved in the plan." Finally, one community planner who has been working in the field for over 20 years was adamant that if the plan is truly community driven, it will be the tool to shape governance structures and foster accountability: "In all my 20 years, I've never seen Council go against plans that were community driven. It's in their political self-interest."
The evaluation also took note of how community members can meaningfully engage in infrastructure projects in new and interesting ways. In Penticton First Nation, a community competition was held for determining the names of the various street signs, an idea that emerged from their CCP.
Similarly, although not a FNIF funded project but consistent with their CCP vision, Penticton designed an elementary school with a culture room that draws on the community's traditional pit house design. The pit house shaped room designed with metal, wood and glass is not only a beautiful place for the youth to study, but it symbolises how tradition, culture and modernity can be brought together harmoniously.

In Saskatchewan, one community engaged the youth by having students decorate wall tiles that were inserted into the exterior of their school. Case study interviews indicated that these types of initiatives encouraged community ownership of the infrastructure and was working to reduce vandalism. This concept of supporting public art displays and incorporating local artists' designs into community infrastructure is similar to the "Percent for Public Art" policies standardized in municipalities across North America, including cities such as Ottawa, Toronto, Calgary and Edmonton.Footnote 108 The policies allocate one percent of the budget for municipal projects for art to be displayed publically in order to improve the attractiveness and liveability of a community.Footnote 109 While these communities are able to raise these funds through municipal taxation sources (often not available for First Nation communities) the positive impacts of identifying opportunities for incorporating public art show that it should be routinely considered when funding community infrastructure on reserve.
5. Balancing visioning with technical necessities
Case study participants described the importance of CCPs finding the right balance between being a visioning exercise for the community and having the technical expertise necessary for practical infrastructure development. For the communities that are not utilizing their plan, interviewees felt that community expectations are too high for the money available and that a lofty plan does not provide a feasible plan for action. Similarly, in instances where the plan was led by technical experts, one public works interviewee stated that it was too technical for community members to understand and public works staff to implement. One hired consultant for a community stated that successful community plans "are not an exhaustive inventory of assets, but they are able to bridge the physical and the social in the community. Often you will see plans that are purely physical or purely social. We need to bring both components together to make sure the Plan is accessible… Community members need to see themselves in it and see their ideas reflected in it."
6. Time
It took Westbank First Nation six years to come to a community consensus on their CCP and to create a subsequent Community Planning Law. Although some CCPs analysed were completed in a year, they were completed by consultants with limited community engagement and have not produced notable outcomes. For communities boasting the greatest success, the timeline has been three to five years. One planning interviewee stated, "you can't have tight timeframes… we are building a different attitude, a different way of approaching opportunities. We need to change the perspective that it isn't about a lot of timely plans, but an idea at a community level that everything that we do as a community needs to be seen through the lens of where the community wants to grow. So that it is a dynamic place where people want to live and raise their children. This is a new way of thinking."
7. Incorporating existing plans
It was evident from the majority of interviews and case studies that communities have engaged in various planning activities for centuries and more recently through various AANDC funded programs. One interviewee noted that "Oral traditions as expressed through stories reveal a rich planning tradition that encompassed all aspects of societies." As a result, for Westbank and North Shore Tribal Council First Nations, it was essential to not engage in a revolutionary new idea, but to align and build upon existing efforts. It was about locating all the various strategies and plans, presenting them to the community, and seeing where commonalities existed and where planning discussions needed to be reviewed or engaged in for the first time. As one interviewee noted in their presentation at the CCP Annual Workshop, "you're not doing something new… you're rediscovering (planning) for your community."
8. CCP Handbook
The Comprehensive Community Planning for First Nations in British Columbia Handbook, Second Edition was a partnership initiative between the British Columbia Regional Office and First Nation CCP Champions across British Columbia who ultimately penned the 119 page document. The handbook is essentially a manual for CCP Champions leading the planning process in their communities. Each section provides an overview of each stage of the process with diagrams, suggested tools and techniques and examples from communities that have successfully developed and are implementing their plan. When participating in the CCP Annual Workshop, the evaluators noted the pivotal role this document is playing in current CCP initiatives. When speaking informally to current and future CCP Champions looking to initiate the process in their communities, they were enthusiastic about the utility of the handbook and they were proud that it was written by First Nations.
9. Social Media
The Gwa'sala-‘Nakwaxda'xw Nations originally launched a Facebook group to get their community members engaged in planning discussion and to build relationships among annual workshop participants. The dialogue continues on the "CCP: British Columbia First nations" page with questions, stories and new ideas being posted on a daily basis. There is also the trend of British Columbia's First Nation communities documenting their CCP experiences and producing videos of their final plans online such as with T'Souke First Nation and K'omoks First Nation.
For some communities like Penticton First Nation, the community planning champions and even the Chief saw social media (Facebook in particular) as a key way to engage the community in the planning process and to keep the community actively involved in the implementation of identified priorities. Daily tweets and posts are used to update community members on meetings being held, results of community meetings and on Council decisions thereby inviting community members to discuss and debate the choices of their leadership in a public forum that goes beyond reserve boundaries.
Although not an online experience, communities have used other creative visual and interactive techniques to get community members involved in planning and decisions making on a daily basis. For T'Souke First Nation, a large community bulletin board hangs in the Band Office entrance where ideas can be posted and then ranked using colourful sticky dots - the "dot-aucracy" method.
One interviewee noted that a strong communication strategy is necessary for the implementation of all CCPs in order to keep community members involved and to keep the momentum. For Westbank, they are using the website, Facebook, Twitter, and monthly community newsletters to provide discussion forums on projects and to track the progress of the Plan. This approach has also helped off-reserve members to feel more engaged and to be more involved in community activities.
Although planning continues to be a desired activity for communities and key lessons continue to be learned through various CCP funded initiatives, CCP stakeholders expressed frustration over the fact that CCPs have been merely implemented as isolated pilot projects for over 13 years. Interviewees noted that in order to combine the key lessons learned and to see practical and sustainable transformations for communities across the nation, a national CCP strategy is necessary. A formal CCP strategy is necessary to move this proven approach forward to becoming a key departmental activity and a dedicated program instead of a collection of scattered pilots with varying degrees of support and success that are rarely connected to existing funding programs, services and reporting requirements. As two interviewees stated:
"Planning isn't a choice. You can't not think about resources, where we are going, how we can be effective. Successful communities have an idea, a plan to survive the challenges that are thrown at them."
"Why do we plan? Because we need to do something better for future generations. We are trying to shake off the effects of colonialism, residential schools, the Indian Act – it is not going to happen for this generation but we need to plan to help future generations."
In summary, the evaluation noted the need for the Department to integrate the following community planning and community reporting activities:
- Support for Comprehensive Community Planning initiatives (and similar community planning projects)
- Support for Physical Land Use Planning
- Support for Capital Planning
- Support for Operational Planning
- Support for Disaster Mitigation Planning
- Support for Economic Development Planning
- Support for completing the Annual Report to the Community
- A National CCP Mentorship component
- A National CCP Handbook (based on the British Columbia Handbook), including annexes for regional resources
- "Seed-funding" for identified priorities in completed CCPs
- Tracking of completed community plans and reports
Similarly, Community Infrastructure Branch should consider working with the British Columbia Regional Office, Lands and Economic Development Communications and the Professional and Institutional Development Directorate to develop a national CCP communication strategy to encourage broader community participation and to demonstrate linkages between community planning, land management, infrastructure development, disaster mitigation and economic development.
Recommendation 3: It is recommended that Community Infrastructure Branch engage Professional and Institutional Development to: (a) identify practical ways for Professional and Institutional Development to support community planning projects funded under the Planning and Skills Development category; and (b) to develop a strategy to align the Department's community planning and support activities.
Developing strategic relationships with University Planning Departments was seen as a best practice.
The evaluation noted that at the regional level First Nation communities and universities are developing more formal relationships for furthering the academic field of Indigenous Community Planning and to provide support to communities in carrying out planning activities.
The School of Community and Regional Planning at the University of British Columbia, in partnership with the Musqueam Indian Band, have introduced the Indigenous Community Planning specialization within their Master's program. The new program seeks to empower Indigenous communities and community planners with the necessary skills, capacity and knowledge to achieve their own aspirations for land stewardship, cultural revitalization, strong governance, health and well-being. Their approach uses community-based and land-based learning, emphasizing mutual and transformative processes.Footnote 110 The School of Community and Regional Planning program requires students to complete a practicum program working in a community. Skidegate First Nation, Gitxsan Government Commission, Seabird Island, and Tobacco Plains have all benefitted from having these graduate students place in their communities.
Dalhousie University's Cities and Environment Unit has been working with First Nation communities since 2000 to support the development of Comprehensive Community Plans. At that time, the unit was approached by a group of six First Nation communities in Atlantic Canada that wanted to build their community planning capacity. The Cities and Environment Unit subsequently developed a community planning model on the principles of being community-driven and proactive; the model has previously been used to support communities in Atlantic Canada and Saskatchewan. It is currently being used in Ontario with the North Shore Tribal Council where FNIF is supporting community planning with communities under the Council.
Similarly, the T'Souke First Nation hired a University of Victoria Co-op engineering student to support their solar energy project. Community interviewees indicated how beneficial the new partnership was and that they are now actively involved in the University's annual energy symposium. The community is also looking to seek out different streams of co-op students to support an arts management project they would like to pursue. Additionally, one interviewee noted that it was beneficial for the youth in the community to interact with a university student and that some have since indicated that they would also like to enroll in an engineering program.
Innovative partnerships between First Nations and universities have been emerging elsewhere in the country as well. For example, the University of Waterloo has installed a wind turbine in Kasabonika Lake First Nation to help reduce its dependence on diesel. The project is ongoing, as the group has installed an identical turbine near their campus and study it to make continual improvements to the one at Kasabonika Lake.Footnote 111 In another pertinent example, Carleton University has partnered with Kitigan Zibi Anishinabeg First Nation to develop a comprehensive interactive map using 3D imaging. This is being done with the goal of enhancing land use and capital planning.Footnote 112 Therefore, where possible, universities can provide meaningful partnerships for First Nations in planning, engineering and other relevant areas.
Recommendation 2: It is recommended that the Community Infrastructure Branch expand existing management and oversight documents to ensure funded projects include: (a) identification of operations and maintenance funding sources that adequately meet the life-cycle cost of the asset; (b) identification of necessary training requirements; (c) disaster mitigation infrastructure design elements; and (d) an expanded eligible recipients list to allow for more flexible partnerships with the private sector, academia and Aboriginal organizations.
FNIF projects that invested highly in building the knowledge and skills of First Nation community members were a best practice for supporting career development and not just temporary employment.
There were examples of FNIF projects that invested highly in building the knowledge and skills of First Nation community members. These projects demonstrate the opportunity for AANDC to support future infrastructure investments that incorporate sophisticated training components into project contracts.
The concept of considering how infrastructure projects may support community economic opportunities appears to be standard practice across the regions. When funding the connectivity projects in Ontario, Aboriginal-owned businesses and community workers were employed where possible. For example, the First Nation owned airline, Wasaya Airways, was used extensively; workers were housed in community-owned hotels and fed in local restaurants as well. The trees were cleared for connectivity lines by community workers and were left for the elders to use for heating their homes.
However, ultimately, the connectivity projects only provided temporary employment for local companies and community members. In contrast, in T'Souke First Nation's FNIF-supported solar energy project, the contractor hired 11 community members to assist in installing the solar panels. The project, which sourced funding from 20 different donors, also identified $24,000 in training costs to ensure the 11 members were certified in solar energy by the conclusion of the project. This certification and the experience they gained from the project is now allowing those same 11 individuals to work with the City of Colwood and Natural Resources Canada to install solar panels on 1000 houses.
Similarly, in Whitefish Lake First Nation where FNIF-funded roads and connectivity projects were developed, an estimated 90-95 percent of the work (20-25 community members) was completed by community members with 12 individuals taking their newly-acquired skills and finding employment in Fort McMurray.
In terms of CCP projects, one planner interviewee highlighted that First Nation community members are capable of leading projects with some external technical support to enhance their capacity. The interviewee stated, "The capacity building piece is critical. The more time we can spend with a community up-front, helping them prepare to plan, the better. Too often, this type of work is contracted out to outside consultants that come in too briefly. There are opportunities to transfer these (planning) skills. Projects would be stronger if community members are integral in leading the process. The capacity building component needs to be in the work plan."
Another planning interviewee working to incorporate training and employment into all aspects of her community's CCP stated, "Bureaucrats do development and don't understand social investment…It's not about one-off projects and programs but about investing in the coordination of tools and supports to achieve a common vision. Moving away from identifying problems and solving them to identifying strengths and opportunities and building on them."
The evaluation found that in some projects, Employment and Social Development Canada (at the time called Human Resources and Skills Development Canada) has been able to provide funding for targeted training of community members. For example, the funding of a mold remediation project in Alberta (not supported by the FNIF) allowed for AANDC to address a mold issue while Human Resources and Skills Development Canada supported community members to work alongside the hired contractor to learn the trade and ultimately be able to pursue a career in the field. As highlighted in Chris Henderson's book concerning the roadblocks to clean-energy jobs, Peter Kirby, a member of the Taku River Tlingit First Nation in Atlin, British Columbia told him that, "We were so focused on project development that we didn't have either the time or the money to get our community members trained in time for all the available jobs. I'd recommend that job preparation be part of every project at an earlier stage."Footnote 113
Recommendation 2: It is recommended that the Community Infrastructure Branch expand existing management and oversight documents to ensure funded projects include: (a) identification of operations and maintenance funding sources that adequately meet the life-cycle cost of the asset; (b) identification of necessary training requirements; (c) disaster mitigation infrastructure design elements; and (d) an expanded eligible recipients list to allow for more flexible partnerships with the private sector, academia and Aboriginal organizations.
Local ownership and management of internet infrastructure can yield benefits to remote communities in cost savings and employment.
Communities connected under the FNIF operate under a variety of business models for internet service, the most common being that communities, tribal councils, Aboriginal technical service organizations or education authorities will become local service providers, renting broadband from larger telecommunication companies. While the company is responsible for maintaining the major network infrastructure (generally fibre optic cable and commonly referred to as the ‘backbone' or ‘highway'), the local service provider is responsible for managing their own network. In some cases, communities charge service fees to their residents to pay for technicians. In other cases, only public service buildings have been connected and costs are paid out of the band office budget. Others work through their tribal councils or education authorities, where dedicated departments manage a network for several communities.
The costs of internet provision and the spinoff benefits in employment, however, often depend on the market options available. Key informants referenced high costs for internet in some remote areas, and in some cases were not allowed to employ local workers for installation or as technicians. One technical services organization is encouraging affiliated First Nations to own their own local networks and connect to each other, rather than directly to a broadband highway owned by an external company. This would result in the same operating costs, but with money flowing to First Nations technicians as opposed to the company that manages the highway. Similarly, the SchoolNet evaluation in 2009 argued communities may be able to receive cheaper connectivity service if they combined resources to create a larger network.Footnote 114
As a best practice, the Cree in northern Quebec used FNIF funding to install their own ‘highway' of fibre optic cable. Here, the infrastructure is owned and managed by a First Nations non-profit organization called the Eeyou Communication Network and is able to provide services at a lower cost than competitors. One community under this network previously spent $30,000 per month on internet, with access to a 10 Mb/s speed. Under the new model, $30,000 gives the community access to 400 Mb/s; effectively, therefore, the cost comparison is $3000 per Mb/s with the competitor versus $65 per Mb/s with the Cree company. This ideal model demonstrates the positive gains to be made not just from installing connectivity infrastructure, but from owning and managing it as well.
7. Efficiency and Economy
The FNIF was able to leverage a significant amount of funds that expanded its impact. The cost-sharing component should thus be encouraged moving forward but with caution as cost-sharing may put low-capacity and remote First Nations at a disadvantage.
The FNIF had a very successful leveraging rate of roughly 1:1 with a total of $241,467,000 leveraged alongside AANDC investments of $240,744,000. However, it should be noted that the majority of leveraged funds occurred in the connectivity category where, in reality, FNIF money was added to pre-existing initiatives. Specifically, the FNIF spent $42,067,000 in connectivity, representing just over 17 percent of total FNIF funds, whereas it included $150,500,000 (or 62 percent) of the total leveraged funds.
In many projects, cost-sharing was done with partners, including the First Nation recipient, Health Canada and provincial entities such as Sasktel to maximize gains from FNIF funding. However, in some regions, cost-sharing was a requirement for prioritizing projects to be funded. Making cost-sharing effectively mandatory runs the risk of excluding low-capacity and remote First Nations for whom partnerships are rare. When regions are considering priorities, they should develop a strategy to ensure that First Nations that have challenges in contributing their own revenue or locating financial partners still receive FNIF funding.
FNIF was able to apply a Public, Private Partnership model for funding connectivity projects in that multiple communities were connected under a single project and contractor. This approach was found to be efficient and could be more broadly applied to funding common infrastructure projects for multiple First Nation communities.
The First Nations (Alberta) Technical Services Advisory Group mandated by the chiefs of Alberta in 1998 was cited by interviewees across Canada as a best practice for providing technical expertise to First Nation communities. Although outside the scope of the FNIF evaluation, Alberta's use of Technical Services Advisory Group to complete all Asset Condition Reporting System inspections and reports for Alberta's First Nations has resulted in major cost savings and the ability to have standardized and comparable reports across the province. Just as Technical Services Advisory Group provides a centralized contract for the necessary Asset Condition Reporting System inspection, interviewees noted that strides should be made to bundling similar infrastructure initiatives into singular contracts in order to entice highly qualified firms and to provide cost savings. Additionally, it was a source of frustration for many case study interviewees that while municipal road projects often occur near communities the roads then end at the reserve territory. For example, in Namgis First Nation the community adjacent to the reserve built a boardwalk along the waterfront and the boardwalk ended at the entrance to the reserve land. The FNIF was later able to fund the extension of the boardwalk through the community. In such cases, more meaningful relationships with provincial transportation departments and neighbouring communities would facilitate partnership initiatives that would allow for road projects to continue onto reserve land through a single contract, thereby providing efficiency gains and cost-savings.
In the resource-rich Ring of Fire, First Nations, the provincial government and industry are in discussion to form a joint-governance development corporation to ensure gains are maximized, shared and leveraged for economic development. It is in AANDC's best interest to engage in partnerships like this, as opportunities to align AANDC's investments with provincial, First Nation and industry-driven activities can yield efficiency gains.
The total internal costs to deliver the FNIF were unclear. However, the regional delivery method of using existing CFMP human resources was found to be the most effective and efficient approach.
The actual internal costs associated with the delivery of the FNIF were unclear to the evaluation team. Although human resources and operations and maintenance costs were tracked, the resulting internal cost figure of $2,177,000 to manage the fund would represent 0.9 percent of the total fund or 0.45 percent when leveraged funds are included. These results clearly do not take into account the vast amount of effort required by existing CFMP human resources to select, advise on and track FNIF projects.
The FNIF utilized existing regional CFMP human resources to deliver the program, which was an efficient decision as it drew upon existing resources. Moving forward, it may be ideal to track internal FNIF delivery costs within the overall CFMP budget as regional capital officers are managing all infrastructure projects regardless of the funding source.
The pressure to selectthe lowest cost when infrastructure projects are put to tender was found to be an inefficient policy. There is a need to analyze and improve the Community Infrastructure Branch's tendering policies.
Case studies and interviews revealed that regional office staff have been instructed to have First Nations choose the lowest cost when infrastructure projects are put to tender. This policy has had numerous negative impacts; in some cases the contractors chosen have not properly costed out the project thus requiring substantial updates to the contract during implementation and in some cases poor quality firms are selected. For one FNIF project, the contractor for a road construction initiative went out of business during the process resulting in eight months of delays with lawyers, bond agents and a new bidding process; the final project costs were also substantially higher.
Alberta Region is working to address these challenges by implementing tendering evaluation criteria in the Terms of Reference for a project to allow for selection of the bid which will result in the best value for money for the First Nation and AANDC. Under the guidance of the regional office's technical unit, First Nations develop a Terms of Reference for the project which includes weighted criteria such as understanding the project objective, project delivery methodology, First Nation employment expectations, a work plan and schedule, contractor and sub-contractor experience and total cost. Based on these criteria, a selection team of First Nation representatives, consultants and AANDC staff select the best value for money, which is not necessarily the lowest cost. The regional office's method is fully in compliance with the National tendering policy,Footnote 115 and is designed to ensure First Nations receive high quality service; as a result, the region in now seeing more competitive and comparable bids. As such, this is a best practice which the Community Infrastructure Branch could apply in all regions by reviewing its tendering policies.
Recommendation 4: It is recommended that the Community Infrastructure Branch review the program's tendering policy and best practices across the regions to ensure an effective and consistent approach nationally.
Opportunities exist for better aligning FNIF-related departmental program activities.
As discussed in Section 5.1.2, FNIF projects had positive impacts on higher departmental infrastructure priorities. For example, case studies revealed instances where dust from unpaved roads are a health hazard for students in the neighbouring school and damaging to the school's ventilation systems – fixing these road therefore addressed health issues and operation and maintenance costs for the school. Additionally, as noted in Section 4.1.1, the FNIF categories were found to be the building blocks for economic development. Community infrastructure can have wide-ranging impacts, and therefore, it is important to consider how FNIF investments can better support or be supported by broader departmental programming. As such, the following section provides a list of related programs where better alignment considerations should be made.
Regional Community Development Strategies
As witnessed during all site visits for the FNIF case studies, communities are responsible for locating various sources of funding to address their infrastructure needs. As seen in the T'Souke site visit, aligning funding partners, sources, timelines and reporting can be a massive and complicated undertaking. This scan of T'Souke First Nation's solar energy project plan is a perfect example of where the community must take the initiative to organize the timelines for multiple AANDC funding sources including FNIF and ecoENERGY:

Description of T'Souke First Nation's solar energy project plan
This figure is a picture which depicts a hand-drawn 2009 project timetable for the T'Souke Community Solar Project. One column lists "Funding," and includes three groups of funders, each with multiple specific funder names. The first row of the timetable has abbreviated names of the months from January to just past July.
To support communities in developing better aligned funding and project plans, similar to T'Souke First Nation's above plan of action, the Department's new Community Development Framework Managers Network coordinated by Professional and Institutional Development is working to promote collaboration across directorates, departments and First Nations in order identify the key needs of communities and to align departmental funding and services accordingly thereby representing a more holistic funding and community support action plan. In Ontario and British Columbia in particular, Community Development Directorates have been established to promote integrated and responsive programming. The national network provides an opportunity for sharing best practices when tailoring regional strategies that move the Department away from a programming focus to a community focus. A discussion of integrating community planning, infrastructure investments and economic development should be a key priority for this Network's consideration.
Emergency Management Assistance Program
The Department has an Emergency Management Assistance Program (EMAP) to protect First Nations' health and safety during disasters and to protect and restore community infrastructure. As demonstrated in the following table, addressing natural disasters is a common and costly area for the Department:
| Incident | 2009-2010 | 2010-2011 | 2011-2012 | 2012-2013 |
|---|---|---|---|---|
| Forest fires (evacuations) | 15 | 22 | 30 | 22 |
| Forest fires (no evacuations) | 13 | 7 | 7 | 6 |
| Flooding (evacuations) | 9 | 12 | 48 | 9 |
| Flooding (no evacuations) | 17 | 19 | 15 | 15 |
| Severe weather events (evacuations) | 0 | 4 | 0 | 2 |
| Severe weather events (no evacuations) | 0 | 4 | 14 | 7 |
| Landslides | 0 | 8 | 4 | 0 |
| Total | 54 | 76 | 118 | 61 |
Similarly, experts note that natural disasters are on the rise and are estimated to cost Canadians $60, 000 per day; in British Columbia, this figure may be as high as $184,000 per day.Footnote 117 Interviews and case studies also revealed that fire protection for existing assets is an area of particular concern. As seen in the chart above, forest fires alone accounted for approximately 40 percent of emergencies affecting First Nations between April 2009 and April 2012. One key informant estimated that fires cause ten times as many fatalities on reserve as elsewhere, and explained that risk of fire can prevent First Nations from obtaining insurance.
Key informants noted, however, that EMAP is not well aligned with community infrastructure programming despite the need for physical disaster preparedness and the rebuilding of damaged infrastructure. The January 2013 Review of the Performance of the Emergency Management Assistance Program during the 2011-2012 Manitoba Floods recommended that EMAP develop better linkages with other AANDC programs to work on long-term mitigation-oriented strategies as its activities are primarily reactive as opposed to proactive.Footnote 118 Furthermore, on November 19, 2013, the Honourable Bernard Valcourt, Minister of AANDC, announced that future emergency management funding will include a strong emphasis on preparedness and mitigation, including emergency management plans for communities.Footnote 119
Experts in the field argue that disaster mitigation strategies are the key to prevention and cost savings. For example, when Toronto's Don River breached its banks and twice flooded the Evergreen Brickworks, a former brick factory that has been transformed into a mixed-use public cultural space, incorporating flooding mitigation was key to the re-design of the building itself. While other neighbouring buildings were completely shut down and sustained massive damages, the Evergreen Brickworks was operational within 48 hours as a result of comprehensive flood-mitigation features such as the first floor being designed with only concrete, special floor drains, high positioned electrical outlets, drainage channels around the property, and relocation of mechanical systems to upper floors. The design features saved "hundreds of thousands of dollars in potential clean-up costs."Footnote 120
In areas where flooding has increasingly been recognized as a constant threat, municipalities are beginning to take proactive steps in their infrastructure development plans; these include Calgary's East Village and Toronto's Weather Flow Master Plan. It is therefore logical that AANDC would work to ensure collaboration between its EMAP and Community Infrastructure staff, as was seen in the Alberta Regional Office; furthermore, the Department could work to incorporate disaster mitigation designs into each funded infrastructure project. One interviewee noted that the value of a dollar in an infrastructure project with a disaster mitigation strategy in place (whether through structural mitigation or through non-structural practices such as awareness, training and alert systems) ranges from four to 27 times more valuable than in a case where disaster mitigation has not been considered.
A recent report by the Auditor General also reinforces the need to focus on disaster mitigation. Sections from the report reveal that "the Department does not know whether all First Nations have identified emergency hazards and risks for their communities on reserves, and whether their emergency management plans have been maintained and tested."Footnote 121 Furthermore, upon reviewing some communities' mitigation plans, more than half of the sample had inadequate information and assessments of community risks.Footnote 122 The report then stated that "those First Nations communities may be unprepared when emergency events occur."Footnote 123 In response to the report's release, Michael Ferguson, Auditor General of Canada, made the statement that "Aboriginal Affairs and Northern Development Canada is in a cycle of reacting to emergencies…It has not been able to focus on what can be done to prevent and mitigate these events."Footnote 124
The importance of disaster mitigation strategies is being recognized by First Nations as well. For Simpcw First Nation, following the development of their CCP, designing a disaster mitigation strategy is their next planning priority. This concept of emergency preparedness plans developing out of CCPs is a relatively new concept and one that should be encouraged according to an interviewee from School of Community and Regional Planning working in disaster mitigation with First Nation communities. He recommended that disaster mitigation be included in the CCP process itself.
These examples demonstrate that sustainability and affordability of infrastructure are linked to disaster mitigation, and that co-ordinated planning is therefore important.
Recommendation 2: It is recommended that the Community Infrastructure Branch expand existing management and oversight documents to ensure funded projects include: (a) identification of operations and maintenance funding sources that adequately meet the life-cycle cost of the asset; (b) identification of necessary training requirements; (c) disaster mitigation infrastructure design elements; and (d) an expanded eligible recipients list to allow for more flexible partnerships with the private sector, academia and Aboriginal organizations.
ecoENERGY
The ecoENERGY for Aboriginal and Northern Communities Program was found to fund projects similar to the FNIF's energy systems projects as is demonstrated by T'Souke First Nation's solar energy project mentioned above. ecoENERGY is part of a broader Government of Canada initiative to increase energy efficiency and reduce greenhouse gases. In practice, the program funds feasibility studies and retrofitting of existing infrastructure, all with the goal of reducing reliance on diesel, which is very similar to the FNIF's energy portfolio. Between 2007 and 2010, for example, the program funded 55 renewable energy projects, eight energy efficiency projects and 13 ‘community energy plan' projects, all of which included feasibility studies in some cases and actual implementation in others.Footnote 125 ecoENERGY is also a proposal-based program, although it does not have the resources to devolve project allocation to regional staff and so selection is done at Headquarters.
The benefits of alignment between these two programs are clear. As noted in Section 7.1.5, there is sometimes misalignment between funding for feasibility studies and actual project implementation. Working together, the FNIF and ecoENERGY could more closely align planning and implementation. Additionally, ecoENERGY could benefit from the regional allocation structure the FNIF already has in place.
Special Claims and Treaty Negotiations
Comprehensive Community Planning is a concept being explored by AANDC's Negotiations Directorate as a potential tool for supporting the negotiation and implementation of Special Claims. For example, as a pilot initiative, CCP was officially identified in the Sayisi Dene First Nation's Final Settlement Agreement. For this remote First Nation that has experienced dislocation and challenges in re-building its community, a CCP was identified to help foster a healing process and to build capacity during the negotiation process with the intention that ultimately the CCP will guide any potential future funding settlement. Furthermore, the Negotiations Directorate is receiving increased inquiries from First Nations wanting to participate in Community Planning initiatives thereby demonstrating the value of exploring the potential for CCPs to support negotiation processes.
For K'omoks First Nation, the CCP concept was a direct result of the treaty negotiation team looking to understand exactly what the community wanted so that they had a clear mandate in the negotiation process.
For Skidegate First Nation, the CCP process became the tool for deciding on how to best utilize the money that was awarded to them through a court process. Preserving their language became a key focal point for discussions and a Language and Culture strategy was thus featured as the Plan's main priority for which the trust fund was to be allocated.
One interviewee discussing the benefits of CCP for their community's engagement in treaty negotiations highlighted that communities will vote down potential treaties even when those treaties contain beneficial components just because community members feel that they have not had ownership or involvement in the process. The individual noted that the community engagement and discussion process that is central to developing a CCP should therefore be an essential tool for a community about to embark on negotiations as it allows for clarity in the negotiations, the identification of priorities and community buy-in for the final result.
Urban Aboriginal Strategy
Through the Urban Aboriginal Strategy, AANDC works with communities, local and provincial governments and other stakeholders to support urban Aboriginal Canadians. This includes supporting life and employment skills development for individuals and families with a particular focus on women.Footnote 126
For the Ktunaxa Nation, their community planning process was heavily focused on engaging their urban community members. According to one interviewee, "Communities know who their urban population is and they can better design support systems to engage them, find them the help they need and keep the link to the community alive for emotional support." Coordination between the Urban Aboriginal Strategy and the FNIF could enhance participation of community members off reserve in the planning process.
Health Canada Programs
Health Canada's 'Health Infrastructure Support for First Nations and Inuit'Footnote 127 Program partnered with AANDC on certain FNIF projects in the connectivity category in order to provide communities with remote access to medical expertise and examination. This also contributed to Health Canada's 'Supplementary Health Benefits for First Nations and Inuit' program's goal of assisting with travel for medical purposesFootnote 128 as online access to medical staff reduced travel costs significantly for some case study communities. Therefore, opportunities for collaboration on connectivity infrastructure with Health Canada are ideal. Additionally, harmonization of programs with AANDC was noted as a priority in Health Canada's First Nations and Inuit Health Strategic Plan published in 2012.Footnote 129
Lands and Environmental Management Fund
The Lands and Environmental Management Fund was developed to improve environmental management on reserve. Under Lands and Environmental Management Fund, First Nations are eligible for asset management training as it relates to environmental sustainability.Footnote 130 As noted in sections 4.1.3, 5.1.3 and 6.1.3, training for operation and maintenance of assets has been an issue, especially for the solid waste management category. Alignment of Lands and Environmental Management Fund training funding for completed FNIF projects would help to address infrastructure sustainability issues.
First Nations Land Management Act and Economic Development programs
The First Nations Land Management Act came into force in 1999 after being developed by several First Nations in collaboration with the Department. The First Nations Land Management Act stipulates that if a community develops a land use code outlining their intention for reserve land, licensing, purchase and transfer procedures, resource revenue regulations, consultation procedures and other key provisions related to land use, they may enter into agreement with the Minister for the right to manage their own land.Footnote 131
Case studies conducted for this evaluation showed that First Nations are interested in participating in the First Nations Land Management Act. Penticton, Wawku Put, Whitecap Dakota, Saddle Lake, and Westbank First Nations see CCPs and Physical Land Use Planning as the precursors to being able to manage their land and to ultimately engage in economic development activities. Key informant interviews and case studies also revealed the difficulties communities experience in trying to locate funding to support the creation of these planning documents.
Interviews with communities that have not completed the First Nations Land Management Act process indicated that building economic development infrastructure is a burdensome process that is often too onerous for potential investors, who usually walk away from projects. When asked whether First Nations Land Management Act was of interest to these communities, the majority indicated that they are currently looking into how to be scheduled into the Act as they also believe there are natural linkages between community planning, infrastructure development, land management and economic development.
In fact, 19 percent of First Nations who directly received FNIF CCP funding are engaged in the process (eight percent operations and 11 percent developmental). Of these First Nations, 45 percent decided to engage in the process in the same year as or after they received FNIF funding. In British Columbia, where the planning category was a top priority for the regional office and many First Nations, 26 percent of FNIF/CCP-funded First Nations are currently engaged in the process. Additionally, in Saskatchewan, where pre-existing community plans are common, 16 percent of the province's bands are engaged in the First Nations Land Management Act. These figures demonstrate that there is significant potential to align the FNIF's CCP funding with First Nations scheduled into the First Nations Land Management Act regime.
On the economic development side, FNIF projects that facilitated community beautification and better accessibility to the community made communities more attractive for economic development ventures. In Whitecap Dakota, paved roads allowed for one private business to invest in a storage facility on reserve and have allowed visitors to access the casino and golf course more readily while keeping vehicles clear from the previously typically muddy experience. Similarly, case study interviews indicated that the combination of having a CCP, Physical Land Use Plan, and the ability to manage land through the First Nations Land Management Act, has given banks the confidence they need to work with the community in pursuing economic development ventures.
For communities interviewed with completed CCPS, leadership has identified a very clear path to economic development: 1) Comprehensive Community Planning to set the foundation and a common vision moving forward; 2) Develop technical infrastructure plans and Physical Land Use Plans; 3) Address zoning by-laws and other land management issues, preferably through the First Nations Land Management Act and 4) Develop an economic development strategy that engages private sector and surrounding municipalities.

Description of Gitanmaax's Community Vision
This figure is a picture which contains text describing "Gitanmaax's Community Vision." The text covers the entire image, and reads, "Gitanmaax's Community Vision. Our vision is to restore and maintain health traditional community values; while actively participating in the new economy. Gitanmaax envisions a healthy community that is sustainable in its economy and social infrastructure. We will value all people for their knowledge and skills. We will make available opportunities and resources to empower community members to reach their potential."
The literature review reinforced the finding that community infrastructure development should ultimately be linked with economic development strategies. The National Aboriginal Economic Development Board argues that the best way to achieve self-reliance among Aboriginal communities is through economic development initiatives.Footnote 132 To that end, the National Aboriginal Economic Development Board reaffirms that infrastructure is critical, especially transportation infrastructure, which opens up market opportunities; community infrastructure, which provides the necessary services and supports to ensure public health and safety; and communications infrastructure that connects communities to domestic and international networks.
Bob Chamberlain, the Vice-President of the Union of British Columbia Indian Chiefs, responded to the government-commissioned Eyford study on energy investments by stressing the importance of linking planning with economic development. Specifically, Chamberlain said that in order for First Nations to take advantage of energy-related economic development initiatives, the federal government should prioritize the funding of land and marine use plans.Footnote 133
Aligning CCP Funding and Support Provided by the FNIF and Professional and Institutional Development
The most concerted effort to advance community planning processes has been done through the Professional and Institutional Development directorate at AANDC, which offers a proposal-based program for governance capacity development projects. Each region of AANDC has an independent budget for the Professional and Institutional Development Program for use in funding projects that will benefit the governance capacity of First Nations and Inuit communities including the development of Comprehensive Community Plans. However, this budget is provided on a project by project basis and does not have a secure source of funding. In addition to providing funding for the development of CCPs, Professional and Institutional Development has also begun piloting support tools for completing the process. These tools are being piloted for educational planning in northern Ontario and a version for capital planning is in development. Although funding through the FNIF for CCPs was found to be a huge benefit for communities, interviewees noted that after years of CCP funding being provided from multiple sources (e.g., the FNIF, CCP Saskatchewan Pilot and Professional and Institutional Development) and on an ad-hoc basis (although the FNIF funding is now stable as the Gas Tax Fund was legislated in December 2011), there is a need to centralize funding and support for CCP investments. Additionally, an opportunity exists to align similar planning processes such as infrastructure planning, physical land use planning and economic development planning.
Improving the Tracking of Feasibility Studies and Community Plans
The evaluation found that despite various internal information management systems and policies, regional front-line staff experience challenges in locating all of the various feasibility studies, community plans, physical land use plans and economic development plans that have been funded by the Department related to a First Nation. For example, in relation to the FNIF, AANDC regional officers are unaware of completed ecoENERGY feasibility studies that could support FNIF energy projects. Similarly, for the FNIF funded Community Plans, regional staff find it difficult to centrally track completed community plans as there have been previously funded community planning initiatives across the Department. Although these documents are produced and owned by the First Nation, the documents completed by way of AANDC funding are submitted to the Department for final project reporting and should theoretically have been recorded on the First Nations and Inuit Transfer Payment (now the Grants and Contributions Information Management System) database. However, such reports have been difficult for front-line workers to retrieve. Interviewees indicated that in order to promote a more holistic approach for supporting a First Nation, the procedures and systems for tracking these documents should be revisited to ensure that officers are able to easily access all related planning and feasibility documents when searching by a First Nation.
Recommendation 5: It is recommended that the Community Infrastructure Branch engage ecoENERGY in order to identify a strategy for sharing completed feasibility studies to support potential FNIF-funded energy projects and ensure information is accessible to regional front-line officers.
7.1 There are opportunities to improve the alignment of departmental planning and reporting activities to establish a ‘Single Window' approach for First Nation communities.
Through the completion of the case studies, evaluators came to the conclusion that infrastructure and planning processes funded through the FNIF form an integral foundation for economic growth in First Nation communities. Community plans, such as those developed through the FNIF, can potentially provide the foundation for a ‘single window' approach that aligns departmental programming and reporting requirements to facilitate a more holistic approach to funding First Nations and reporting on programming performance. While the creation of such a single window approach falls outside of the scope of the FNIF and should include other planning, reporting and infrastructure development stakeholders, it is important to note the foundational role that planning and infrastructure should play in the establishment of a community-based approach that promotes economic development.
The Annual Report to Communities
As reiterated throughout this report, AANDC funds and supports numerous types of planning processes for First Nation communities, including CCPs, capital plans, physical land use plans, economic development plans, and disaster mitigation plans. Recognizing the resource and capacity requirements these plans and their subsequent reporting requirements place on communities, the Department has been working on various ways to reduce their reporting burden. One such initiative is the Annual Report to Communities pilot currently underway led by the Audit and Evaluation Sector. The goal of the Annual Report to Communities is to provide a reporting alternative to communities instead of completing the considerable number of Data Collection Instrument reports required by various areas of the department. As a result of the work to design the Annual Report to Communities model, the developers are also including a complementary operational planning tool that will be community-focused, scalable and operational in nature. Although additional tools and support services provide communities with planning options, there is a risk of duplication of efforts if clear linkages are not made between a new operational planning tool and the community planning, capital planning, physical land use planning and economic development planning work already underway.
Interviewees from communities involved in completing AANDC reporting requirements noted that a single report would be much more efficient and for communities that have CCPs, it would be perfectly aligned with their completed community plan. For Penticton First Nation (one of the Annual Report to Communities pilot communities with a completed FNIF-funded CCP) their vision is to make the Annual Report to Communities a report card on their CCP for the community to be shared and discussed at their Annual General Meeting. The concept of having an overarching Comprehensive Community Plan with annual Operational Plans and a corresponding Annual Report Card to measure progress is being explored by multiple First Nations of their own initiative. For Gitanmaax First Nation, a small 13 page Progress Report for 2013 was printed in the form of a brochure for community members.
A Vision for AANDC

Description of A Vision for AANDC
This figure is a diagram framed by the text of a section titled, "A Vision for AADNC." The diagram is shaped like a triangle, with 5 rectangular boxes. Each of the five boxes includes one of the following statements: "Annual Report to Community," "Contribution Agreements," "Annual Financial Plan," "Annual Operational Plan," and "Comprehensive Community Plan."
For many of the departmental, regional and First Nation interviewees engaged in this evaluation, the ideal vision for AANDC moving forward is to promote a holistic approach to providing programs and services that is based on solid community-driven planning with extensive local engagement and consultation. Informants have suggested long-term planning could then support annual operational planning, budgeting and the design of contribution agreements with the department as well as final reporting requirements that meet the accountability and transparency needs of AANDC and community members. Such a focus is also aligned with the Department's current Community Development Training led by Professional and Institutional Development for AANDC staff to support the wider initiative to encourage departmental programming that is focused on individual community needs and priorities instead of programming conducted in departmental silos.
As well articulated by one planner from a First Nation interviewed for this evaluation, it is about:
encouraging communities to think about what they want to ultimately achieve instead of chasing funding that becomes available and applying for whatever they stumble across as eligible. Communities are project-driven instead of priority-driven. It is possible to address priorities sometimes with little to no funding. For example, a multi-purpose recreation center may be a great thing for a community. But it is expensive. But if the main goal of the community is not about getting a centre, but it is really about getting the youth active, then you can still meet that priority by buying a truck to take youth into the bush to camp, learn their history and traditions and build their community bonds. If the focus is just on the center and funding isn't available, then you aren't looking to meet the need… We need to switch the focus to meeting priorities instead of chasing funders.
Another planner working with First Nation communities also noted:
If we are going to be serious about communities having more control to plan and creatively using their resources… requirements on the funding and accountability side need to recognize that this is happening so that there is some traction on the Plan. It is unfair to their passion, energy and commitment that they've put into the process.
The key challenges to overcome in developing a new community-based approach with Community Planning as a foundational component will be (1) ensuring the process has sustained AANDC support; (2) that the intention of ultimately reducing the reporting burden is upheld; and (3) that future AANDC funding allocations are aligned with the planning documents. As one interviewee noted, community members are tired of similar pilots coming and going and losing momentum: "We have tried this already and Chief and Council didn't implement it or AANDC didn't fund it." Similarly, a CCP Champion currently leading the process in their community stated that it is "hard to get past all the cynical people. People feel that we've been here before, we've done this before."
However, it should be noted that internal, regional and First Nation interviewees made it a point that community planning cannot become a mandatory requirement institutionalized by AANDC. Concerns were that any move to promote a national requirement would likely put the process into the hands of consultants and thus, the process would lose the key community-driven and community engagement elements that made certain processes so successful. Instead, interviewees suggested building incentives into programs such as First Nations Land Management Act, settlement agreements, funding for structural disaster mitigation and reducing other required reporting.
Finally, numerous studies and informants have noted that planning and implementing projects is only the first step. For infrastructure developments on reserve to be effective, they must be linked to economic development. Significant gains, particularly in the energy sector, are increasingly a possibility for First Nations. However, returns to the community in revenue, skills development, employment and social sectors are needed to ensure local capacity and sustainability are truly built. This should be a core consideration of planning moving forward.
In summary, the current push to reduce the reporting burden should also take note of consolidating planning processes and aligning them with reporting requirements.
Annex A - National Priority Funding Evaluation and Measurement Matrix

Description of National Priority Funding Evaluation and Measurement Matrix
This figure is a matrix titled, "National Priority Funding Evaluation and Measurement Matrix." This matrix is comprised of three sub-matrices. The main sub-matrix is comprised of five Program Activities and four AANDC Capital Asset Funding Categories.
The five Program Activities listed in the main matrix apply to all three sub-matrices. They are labeled "Protection of health and safety and assets," "Health and safety improvements," "Recap. / Major Maintenance," "Growth / Need Less than 2 years," and "Growth / Need After 2 years."
The main sub-matrix contains the Funding Priorities for the following AANDC Capital Asset Funding Categories: "Community Infrastructure.," "Education Facilities, "Water / Sewer" and "Custodial Areas." The additional sub-matrix contains the Funding Priorities for the AANDC Capital Asset Funding Category of "Contaminated Sites," and the third sub-matrix contains the Funding Priorities for the AANDC Capital Asset Funding Category of "Housing."
The Funding Priority Legend for the matrix differentiates between four levels of priorities. As well, each matrix block for all three sub-matrices contains a Priority Code (from A-1 to F-5), and the two smaller sub-matrices contain some additional text in each of their blocks. What follows will be a Description of each block of the matrix, containing its priority level (as based on the aforementioned legend), its Priority Code, and any additional text (for the two smaller submatrices):
Main Sub-Matrix
For the "Custodial Assets" AANDC Capital Asset Funding Category: "Protection of health and safety and assets" is labeled as Priority Two and coded A-1. "Health and safety improvements" is labeled as Priority Two and coded A-2. "Major Maintenance" is labeled as Priority Two and coded A-3. "Growth / Need Less than 2 years" is labeled as Priority Three and coded as A-4. "Growth / Need After 2 years" is labeled as Priority Four and coded as A-5.
For the "Water / Sewer" AANDC Capital Asset Funding Category: "Protection of health and safety and assets" is labeled as Priority One and coded B-1. "Health and safety improvements" is labeled as Priority One and coded B-2. "Major Maintenance" is labeled as Priority Two and coded B-3. "Growth / Need Less than 2 years" is labeled as Priority Two and coded as B-4. "Growth / Need After 2 years" is labeled as Priority Three and coded as B-5.
For the "Education Facilities" AANDC Capital Asset Funding Category: "Protection of health and safety and assets" is labeled as Priority Two and coded C-1. "Health and safety improvements" is labeled as Priority Two and coded C-2. "Major Maintenance" is labeled as Priority Two and coded C-3. "Growth / Need Less than 2 years" is labeled as Priority Three and coded as C-4. "Growth / Need After 2 years" is labeled as Priority Four and coded as C-5.
For the "Community Infrastructure" AANDC Capital Asset Funding Category: "Protection of health and safety and assets" is labeled as Priority Two and coded D-1. "Health and safety improvements" is labeled as Priority Two and coded D-2. "Major Maintenance" is labeled as Priority Three and coded D-3. "Growth / Need Less than 2 years" is labeled as Priority Three and coded as D-4. "Growth / Need After 2 years" is labeled as Priority Four and coded as D-5.
Contaminated Sites Sub-Matrix
This sub-matrix contains the "Contaminated Sites" AANDC Capital Asset Funding Category.
"Protection of health and safety and assets" is labeled as Priority Two and coded E-1. This block also contains the text "NCSCS Type 1."
"Health and safety improvements" is labeled as Priority Three and coded E-2. This block also contains the text "NCSCS Type 2."
"Major Maintenance" is labeled as Priority Three and coded A-3. This block also contains the text "NCSCS Type 3."
"Growth / Need Less than 2 years" and "Growth / Need After 2 years" are simply labeled as N/A.
Housing Sub-Matrix
This sub-matrix contains the "Housing" AANDC Capital Asset Funding Category.
"Protection of health and safety and assets" is labeled as Priority Two and coded F-1. This block also contains the text "Renovation."
"Health and safety improvements" is labeled as Priority Two and coded F-2. This block also contains the text "New Const."
"Major Maintenance" is labeled as Priority Two and coded F-3. This block also contains the text "O & M."
"Growth / Need Less than 2 years" is labeled as Priority Three and coded F-4. This block also contains the text "New Construction Growth less than 2years."
"Growth / Need After 2 years" is labeled as Priority Four and coded F-5. This block also contains the text "New Construction Growth greater than 2 years."
National Priority Ranking Framework-Background
The Department has a consistent and transparent ranking system to address the most pressing needs in First Nation communities.
The Department is committed to the following priorities, listed in order of importance, over the next five years:
- Protecting and maintaining the life cycle of existing assets, with an emphasis on health and safety;
- Mitigating health and safety risks through existing and new assets;
- Addressing the backlog regarding water and sewage systems under Capital and Facilities Maintenance activities; and
- Investing in other priorities, including investments in sustainable communities (e.g., housing, electrification, roads, educational facilities and community buildings) and investments in community assets to resolve claims or self-government agreements.
Development of the Priority Framework
AANDC regional offices employ a ranking system as a normal course of business in developing capital plans, as demand historically exceeds available funding resources. The National Priority Framework was designed to align existing regional processes (at the highest level) with departmental priorities, to enable reporting and demonstrate progress in a consistent manner.
Use of the Priority Matrix
Regions are requested to:
- Classify all major and minor capital projects to a "best fit" within the matrix areas using definitions in the Project Grid, and
- Enter the priority code (i.e. A-2) in the companion reporting spreadsheets.
In this way the Department rolls-up funding allocations to the national priorities by asset category. The objective is to demonstrate allocation to the highest priorities as regions see fit, however, pending direction from the allocation methodologies study it may be necessary to set funding levels or targets for the priority areas. The Department may also wish to roll-up unfunded projects in each priority area as a way to demonstrate where the needs reside and how they may shift over time.
AANDC Capital Asset Funding Categories
Custodial Assets: Administration buildings, vehicles, machinery and equipment required to deliver programs to First Nations, Inuit, and northern communities.
Water / Sewer: Assets that comprise the distribution / collection system and assets required in the treatment and disposal process including major equipment, vehicles, machinery and buildings.
Education Facilities: Schools, staff residences (teacherages), student residences, temporary facilities associated with delivering the educational program in the community.
Community Infrastructure: Assets and systems not already specified above – including operative, administrative, utility and recreational buildings; solid waste vehicles, dumps and transfer stations; community roads and bridges; electrical power supply and distribution; fire-fighting vehicles and supporting buildings; and fuel tanks and distribution systems.
Contaminated Sites: Sites requiring assessment, remediation / risk management to protect the health and safety as well as the environment of communities.
Housing: Funding to assist in community housing services i.e., the construction, maintenance and management of the community housing portfolio.
Annex B - Evaluation Issues and Questions
Evaluation Issues and Questions
Relevance
Continued Need
1. To what extent did the FNIF respond to the community infrastructure needs and priorities of its targeted beneficiaries/clients?
2. Is there a continued need to provide targeted funding for First Nations infrastructure projects on reserve?
Alignment with Government Priorities
3. To what extent was the FNIF consistent with the objectives and priorities of the federal government and AANDC?
Alignment with Federal Roles and Responsibilities
4. Is there a legitimate, appropriate and necessary role for the federal government in providing funding for proposal-based on-reserve infrastructure projects?
5. Was the division of roles and responsibilities between AANDC and Infrastructure Canada appropriate and necessary?
Performance
Effectiveness
6. To what extent was the FNIF fund able to achieve its expected outcomes? Specifically:
- improving the health and safety of First Nation communities
- improved road safety on local roads
- increased support to long-term sustainable community development in First Nation communities
- improved First Nations' infrastructure management and technical capacity to maintain their infrastructure
- contributing to a cleaner and healthier environment
- reduced per capita tonnage of solid waste sent to landfill
- improved solid waste management
- improved energy recovery
- reduced energy usage
- alternative sources of energy
- more reliable, sustainable energy supply that better meets the needs of First Nation communities
- off-grid communities are connected to grid-based power generation
- improving the delivery of public/government services, including education and e-health to First Nation communities
- reduced travel requirements out of the region for health
- increased e-access to health, education and learning resources
- enhanced e-access to/delivery of public/government services
- enhancing collaboration among First Nation communities, municipalities and provinces
- fostering First Nation to First Nation collaboration resulting in joint proposals that were of benefit to more than one First Nation
- fostering First Nation collaboration with municipalities and/or provinces on specific projects
- leveraging other sources of funding for infrastructure projects in First Nation communities, by way of involving First Nations’ own source revenues and enhancing municipal, provincial, or private sector partnerships
7. Were there any unexpected outcomes (positive and negative) as a result of delivering the FNIF?
8. What were the major factors (internal and external) that impacted on the ability of the FNIF to achieve its intended outcomes?
9. To what extent were the recommendations from the formative evaluation concerning the design, delivery and performance measurement activities of the FNIF implemented?
10. Are there any suggestions for altering the design and/or delivery of the FNIF in order to improve its performance?
Demonstrations of Efficiency and Economy
11. To what extent was the fund able to complement, or did it unnecessarily duplicate, infrastructure funding and related activities provided by AANDC programs and other governmental or private entities?
12. What were the lessons learned and best practices gleaned when funding infrastructure projects on reserve under FNIF that could be applied to current and/or future AANDC programming?
13. Is there another program design that would be the most appropriate and efficient means to achieve the expected outcomes of the FNIF while minimizing costs?
Annex C - FNIF Community Project Sites
| Community | AANDC Region | Site Visit During Formative Evaluation(Yes/No) | Project & Cost | Date of Project | Mode of Project Assessment |
|---|---|---|---|---|---|
| Solid Waste Case Study | |||||
| Whitecap Dakota First Nation (#372) | SK | NO | 1 transfer station project with $277,800 in FNIF funds and $67,307 in other funding | 2008/09 & 2009/10 | In-person focus group with director of public works and senior project manager (2 interviewees) |
| Peguis First Nation (269) | MB | YES | 1 recycling depot and landfill project with $817,300 in FNIF funds and $52,000 in other funding | 2009/10 | In-person tour of facility with employee (1 interviewee) |
| Roads and Bridges Case Study | |||||
| Poplar River First Nation (277) | MB | NO | 1 bridge upgrade project totaling $814,000 | 2009/10 & 2010/11 | In-person focus group with community members (8 interviewees) |
| Fisher River Cree Nation (264) | MB | NO | Roads and Drainage Infrastructure with $1,301,098 in FNIF funds and $153,500 in other funding | 2008/09, 2009/10, 2010/11, & 2012/13 | In-person focus group with members of band administration (5 interviewees) |
| Whitefish Lake First Nation (459 and 864) | AB | NO | Road and bridge construction and upgrading; 3 projects with $6,243,288 in total FNIF funds and 2,000,000 in other funding | 2010/11 & 2012/13 | In-person visit with Chief and Council (4 interviewees) |
| Community Planning and Skills Development Case Study | |||||
| Musqueam Indian Band (550) | BC | NO | 1 project with $136,650 in FNIF funds, $43,466 in additional departmental funding and $35,600 in other funding (It was noted in the regional office that the final cost for developing the CCP was approx. $500,000) | 2011/12 | In-person visit with CCP coordinator and Council member (2 interviewees) |
| Penticton First Nation (597) | BC | YES | 1 project with $164,000 in FNIF funds, $100,000 in additional departmental funding and $100,000 in other funding. | 2010/11 & 2011/12 | In-person visit with Chief CCP coordinator (2 interviewees) |
| T’Souke First Nation (657) | BC | NO | 2 projects for $266,000 in FNIF funds with $70,000 in other funding. | 2010/11 & 2012/13 | In-person visit with planning mentors, planning champion, spiritual healer and band councillor (5 interviewees) |
| Saddle Lake Cree Nation (462) | AB | NO | 1 project with $150,000 in FNIF funds and $12,500 in other funding | 2008/09 | In-person visit with engineer, councillors and housing co-ordinator (4 interviewees) |
| Energy Systems Case Study | |||||
| Kitasoo First Nation (540) | BC | NO | 3 related projects totalling $2,896,713 in FNIF funds with $6,600,000 in other funding | 2007/08 & 2008/09 | Teleconference with project manager (1 interviewee) |
| Gitga’at First Nation | BC | NO | 1 project with $1,500,000 in FNIF funds and $6,088,000 in other funding | 2012/13 | Teleconference with project manager (1 interviewee) |
| T’Souke First Nation (657) | BC | NO | 1 project with $49,600 in FNIF funds and $48,000 in other funding | 2008/09 | In-person visit with planning mentors, planning champion, spiritual healer and band councillor (5 interviewees) |
| Connectivity Case Study | |||||
| Alberta Supernet/Technical Services Advisory Group Connectivity Project | AB | NO | 1 project connecting multiple communities; $6,085,688 in FNIF funds | 2009/10, 2010/11, & 2011/12 | In-person visit with Technical Services Advisory Group (2 interviewees) |
| Nishnawbe Aski Nation (1033) | ON | NO | 1 project connecting multiple communities; $8,651,000 in FNIF funds with $75,122, 295 in other funding | 2012/13 | Key informant interviews with project stakeholders (2 interviewees) |
| Conseil en éducation des Premières nations | QC | NO | 1 project spanning 22 communities; $2,538,682 in FNIF funds with $3,831,283 in other funds | 2010/11, 2011/12, & 2012/13 | In-person visit with CEPN at Wendake including meeting with project manager in Manawan and visit to school (4 interviewees) Video-conference with beneficiaries in Opiticiwan, Khanisitake (3 interviewees) |
| Total number of participants : | 46 | ||||
Annex D - Economic Impact Analysis of First Nations Infrastructure Fund
Final Report
Economic Impact Analyis
of First Nations Infrastructure Fund
Project Number: 1507-7/13066W UNC
Prepared for
Aboriginal Affairs and Northern Development Canada
Prepared by
R.A. Malatest & Associates Ltd.
February 3, 2014
INTRODUCTION AND OVERVIEW
Overview of the First Nations Infrastructure Fund
Since 2007, Aboriginal Affairs and Northern Development Canada has invested $235 million in the infrastructure of First Nations communities through the First Nations Infrastructure Fund (FNIF). The Department has since launched three calls for proposals in order to identify projects for investment to which 1,242 funding proposals were received. After the Department evaluated each proposal on their merits, 434 projects were approved for funding.
These projects aimed to foster healthier and more connected First Nations communities by investing in:
- Solid waste management to allow First Nations communities to better address their long-term waste requirements;
- Energy systems to connect First Nations communities to existing grids and to have them become more self sustainable through local energy sources;
- Local roads and bridges to enhance safety, commerce and access to schooling and healthcare resources;
- Community planning and skills development to support long-term sustainable community development; and
- Connectivity to allow First Nations communities to gain access to the information and development associated with the Internet.
Purpose of the Evaluation
As part of the Summative Evaluation of the First Nation Infrastructure Fund, Aboriginal Affairs and Northern Development Canada is looking to understand how and to what extent the Fund has had an impact on First Nations communities, as well as the broader Canadian context. The Department wants to quantify the economic impact on infrastructure investment activities by region, funding category and industry sector.
The purpose of the Evaluation of the First Nation Infrastructure Fund is to evaluate the success of the fund and determine the Input-output per dollar spent and the number of possible jobs being created.
Methodology
The Consultant undertook a review of submission and decision documents for the 434 projects funded under the First Nation Infrastructure Fund. The Consultant also reviewed the databases provided by the Department that summarized various aspects of all the 434 projects.
The submission and decision documents provided the detail required to attribute funding amounts by province, project category, and to allocate proportions of the funding to specific industry sectors. However, many funded projects were not supported by submission and decision documents. In these instances, the consultant attributed all funds to the single, most appropriate industry sector.
The summary spreadsheets provided further information on the funded projects. In particular, the summary spreadsheets shed light on cases where there were discrepancies between the proposed and the actual funding amounts.
The consultant then used provincial and industrial multipliers to determine the outcomes of the funding on economic and employment impacts.Footnote 134 The multipliers have been developed by Statistics Canada to estimate the impact that a dollar of investment would have on various economic and employment dimensions. The different economic and employment dimensions estimated from this analysis are described below.
| Outcome | Description | |
|---|---|---|
| Economic | Output | The total value of the economic activity created by the program(s) receiving funding |
| GDP | The total value of the economic activity created within Canada by the program(s) receiving funding (i.e. output minus imports) | |
| Employment | Income | The total amount of income earned by the jobs created by the funding. |
| Jobs | Number of full time equivalent jobs estimated to have been created by the program(s) receiving funding | |
Defining Northern Communities
Due to the remote location of many of the communities receiving funding, the Consultant recommended not using the relevant provincial multiplier in all cases. Rather, remote northern communities were deemed to have more in common with the Northwest Territories than the province in which they were located. It was decided that for northern communities, the relevant Northwest Territories multipliers would be more accurate and would be applied for this analysis.
The consultant defined remote First Nation communities using a map of Canadian population density. The Consultant drew a line across Canada where communities north of the line have population densities less than 0.5 per square kilometre. Communities north of this line used the Northwest Territories multiplier for this analysis regardless of their province (see figure 1 below).
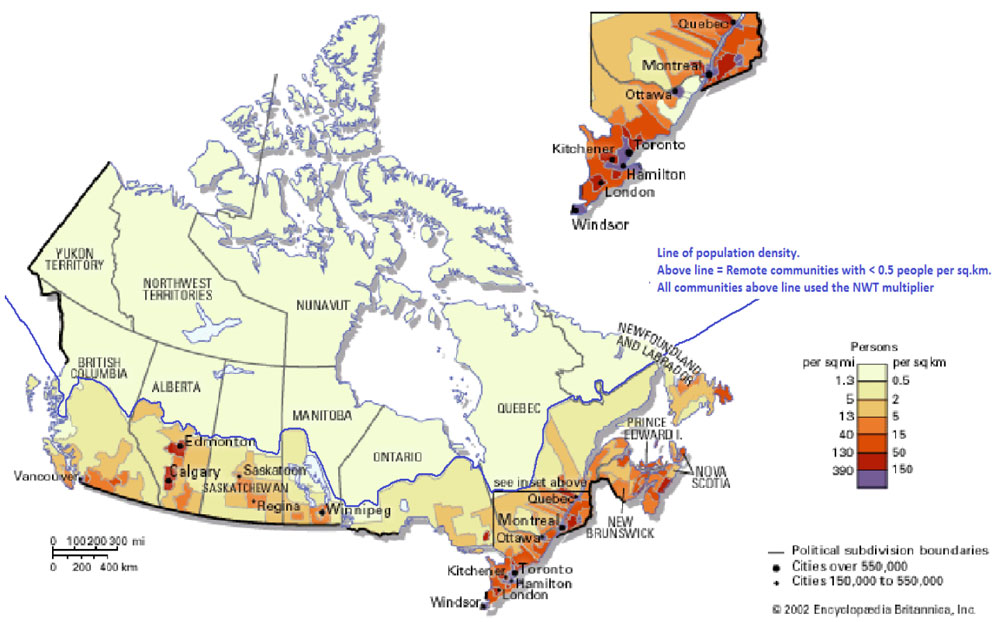
Description of figure 1 - Defining Northern Communities by Population Density
This figure is a map of Canada with its provincial and territorial boundaries. It illustrates the population density of Canada. A scale is included that reflects population density. Population density is measured by persons per square mile and/or by persons per square kilometer.
A line of population density delineates a boundary, north of which are areas that have fewer than 1.3 persons per square mile, or fewer than 0.5 persons per square kilometer. All communities north of this line used the NWT multiplier. South of the line, population density increases from less than 0.5 persons per square kilometer to 0.5 to 2 persons per square kilometer to even higher densities nearer to major urban centres.
One portion of the map shows a more detailed version of the area from Windsor, ON to Quebec City. The population density in these areas varies from 0.5 to 2 persons per square kilometer South and North of Ottawa to more than 150 people per square kilometer in the area surrounding Toronto and Hamilton, ON.
RESULTS
The overall results of the FNIF on the economic and employment outcomes are first described below. The results are then disaggregated by province, by project category, and by industry sector.
Overall Results
Since 2007, the $235 million invested into Aboriginal communities through the FNIF is estimated to have generated $503 million in total economic output, including $250 million towards Canadian national GDP. The funding has created 2,800 jobs with $162 million in associated revenues.
Results by Province
Table 2 below shows the distribution of the FNIF fund by province and the Input-output values, as well and projected jobs created for each of the provinces.
| PROVINCE | FNIF Amount Approved (Million $) |
Output (Million $) |
GDP (Million $) |
Labour (Million $) |
Jobs (#) |
|---|---|---|---|---|---|
| Manitoba | $45.1 | $96.9 | $45.1 | $29.0 | 512 |
| 19.2% | 19.3% | 18.0% | 17.9% | 18.3% | |
| Saskatchewan | $43.4 | $92.8 | $45.7 | $29.4 | 510 |
| 18.4% | 18.4% | 18.3% | 18.1% | 18.2% | |
| Ontario | $40.9 | $84.6 | $43.3 | $28.4 | 486 |
| 17.4% | 16.8% | 17.3% | 17.5% | 17.4% | |
| British Columbia | $34.5 | $75.6 | $40.5 | $26.7 | 468 |
| 14.7% | 15.0% | 16.2% | 16.5% | 16.7% | |
| Alberta | $33.7 | $72.0 | $36.0 | $23.4 | 363 |
| 14.3% | 14.3% | 14.4% | 14.5% | 13.0% | |
| Quebec | $27.7 | $59.0 | $28.5 | $17.9 | 312 |
| 11.8% | 11.7% | 11.4% | 11.0% | 11.2% | |
| New Brunswick | $6.0 | $13.3 | $6.4 | $4.4 | 91 |
| 2.6% | 2.6% | 2.6% | 2.7% | 3.3% | |
| Nova Scotia | $2.2 | $4.9 | $2.4 | $1.6 | 32 |
| 0.9% | 1.0% | 1.0% | 1.0% | 1.2% | |
| Prince Edward Island | $1.4 | $3.0 | $1.5 | $1.0 | 21 |
| 0.6% | 0.6% | 0.6% | 0.6% | 0.7% | |
| Newfoundland and Labrador | $0.6 | $1.3 | $0.6 | $0.4 | 6 |
| 0.2% | 0.3% | 0.2% | 0.2% | 0.2% | |
| Total | $235.5 | $503.4 | $250.0 | $162.1 | 2,803 |
| 100.0% | 100.0% | 100.0% | 100.0% | 100.0% |
Based on the data collected, there was a similar trend in Input-output values by province with Manitoba being the highest recipient of FNIF funding (19 percent), and as a result also the highest output and jobs estimated. The output by province is shown in Figure 2 below.
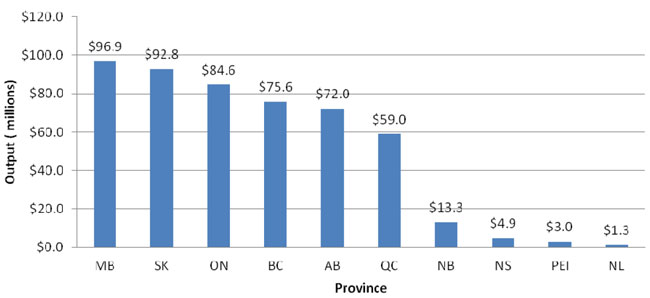
Description of Figure 2 - Projected output for FNIF Funds by Province 2007-2013
This figure is a bar chart showing "Projected output for FNIF Funds by Province." The scale of one axis of the graph is "Output" in millions of dollars, beginning at zero and increasing in increments of $20.0 million dollars to $120.0 million dollars. The other axis shows the 10 provinces beginning with Manitoba, which has the highest value, at $96.9 million. Following Manitoba, Saskatchewan was $92.8 million, Ontario was $84.6 million, BC was $75.6 million, Alberta was $72.0 million, Québec was $59.0 million, New Brunswick was $13.3 million, Nova Scotia has $4.9 million, PEI has $3.0 million, and Newfoundland and Labrador has $1.3 million.
The Atlantic provinces combined received less than five percent of the FNIF funds between 2007 and 2013 while all the other provinces received approximately similar proportions of FNIF funds. Figure 3 below shows the proportion of FNIF funding received by province.
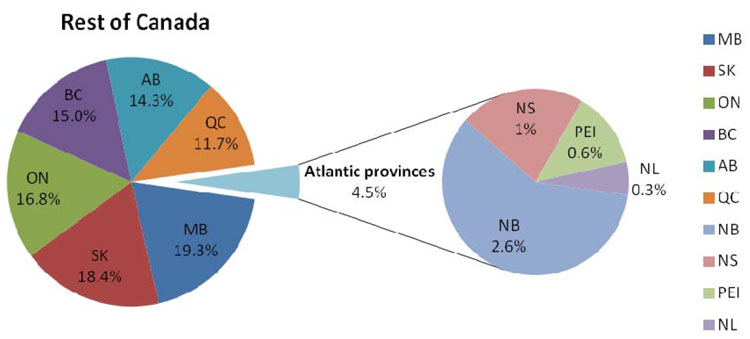
Description of figure 3 - Distribution of FNIF Funds by Province 2007-2013
This figure is a pie chart showing "Distribution of FNIF Funds by Province." The main pie chart entitled "Rest of Canada" is divided into seven segments: Manitoba comprises 19.3%; Saskatchewan comprises 18.4%; Ontario comprises 16.8%; British Columbia comprises 15.0%; Alberta, comprises 14.3%; Québec comprises 11.7%. The Atlantic provinces constitute the seventh segment of the main pie chart. A second pie chart shows the distribution of FNIF funds among the Atlantic provinces. New Brunswick comprises 2.6%; Nova Scotia comprises 1%,PEI comprises 0.6%, and Newfoundland and Labrador comprises 0.3%.
Results by Project Category
As discussed above, the FNIF is intended to improve First Nation communities through five priority areas:
- Solid waste management;
- Energy systems;
- Local roads and bridges;
- Community planning and skills development; and
- Connectivity.
All projects funded under FNIF were categorized based on the priority area it addressed. The distribution of the funds and their outcomes for each of these project categories are outlined in Table 3 below.
| Project Category | FNIF Amount Approved (Million $) | Output(Million $) | GDP (Million $) | Labour(Million $) | Jobs (#) |
|---|---|---|---|---|---|
| Connectivity | $43.4 | $96.4 | $45.9 | $28.7 | 477 |
| 18.4% | 19.1% | 18.4% | 17.7% | 17.0% | |
| Energy Systems | $11.7 | $26.3 | $12.6 | $8.0 | 132 |
| 5.0% | 5.2% | 5.1% | 4.9% | 4.7% | |
| Planning and skills Development | $17.3 | $35.9 | $21.9 | $14.8 | 246 |
| 7.3% | 7.1% | 8.7% | 9.1% | 8.8% | |
| Roads and bridges | $130.8 | $278.7 | $129.4 | $83.3 | 1,396 |
| 55.5% | 55.4% | 51.8% | 51.4% | 49.8% | |
| Solid waste management | $32.4 | $66.1 | $40.2 | $27.3 | 552 |
| 13.8% | 13.1% | 16.1% | 16.8% | 19.7% | |
| Total | $235.5 | $503.4 | $250.0 | $162.1 | 2,803 |
| 100.0% | 100.0% | 100.0% | 100.0% | 100.0% |
It was determined that more than half (55 percent) of the FNIF funds were allocated to the building of roads and bridges, while the smallest allocation was towards energy systems. Figure 4 below shows the distribution of the FNIF funds by project category.

Description of figure 4 - Projected output for FNIF Funds by Project Categories
This figure is a bar graph showing "Projected output for FNIF Funds by Project Categories." The scale of one axis of the graph is "Output" in millions of dollars, beginning at zero and increasing in increments of $50.00 million dollars to $300.00 million dollars. The other axis shows the Project categories. The first bar is for "Roads and bridges," and accounts for $279.7 million dollars. The second bar is for "Connectivity," which accounts for $96.4 million dollars. The third bar is for "Solid waste management," which accounts for $66.1 million dollars. The fourth bar is for "Planning and skills development," which accounts for $35.9 million dollars. The final bar is "Energy systems," accounting for $26.3 million dollars.
Results by Industry Sector
The submission and decision documents provided the detail required to attribute funding amounts to specific industry sectors. The distribution of the funds and their outcomes for each of these industry sectors are outlined in Table 4 below.
| INDUSTRY SECTOR | FNIF Amount Approved (Million $) | Output (Million $) | GDP (Million $) | Labour (Million $) | Jobs (#) |
|---|---|---|---|---|---|
| BS23B - Non-residential Construction | $126.7 | $270.4 | $124.4 | $79.9 | 1342 |
| 53.8% | 53.7% | 49.7% | 49.3% | 47.9% | |
| BS23C - Engineering Construction | $53.5 | $119.4 | $56.6 | $35.4 | 588 |
| 22.7% | 23.7% | 22.6% | 21.9% | 21.0% | |
| BS560 - Administrative and support, waste management and remediation services | $31.6 | $64.5 | $39.3 | $26.6 | 542 |
| 13.4% | 12.8% | 15.7% | 16.4% | 19.3% | |
| BS540 - Professional, scientific and technical services | $23.7 | $49.1 | $29.8 | $20.2 | 331 |
| 10.1% | 9.8% | 11.9% | 12.4% | 11.8% | |
| Total | $235.5 | $503.4 | $250.0 | $162.1 | 2803 |
| 100.0% | 100.0% | 100.0% | 100.0% | 100.0% |
More than half (54 percent) of the FNIF funds were allocated to non-residential construction. Figure 6 below shows the distribution of the FNIF funds by industry sector.

Description of figure 5 - Projected output for FNIF Funds by Industry Sector 2007-2013
This figure is a bar graph ranking "Projected output forFNIF Funds by Industry Sector." The scale of one axis of the graph is "Output" in millions of dollars, beginning at zero and increasing in increments of $50.00 million dollars to $300.00 million dollars. The other axis of the graph shows the Industry sectors. The first bar is "BS23B – Non-residential construction," which accounts for $27.40 million dollars. The second bar is "BS123C – Engineering Construction," accounting for $119.40 million dollars. The third bar is "BS560 – Administrative and support, waste management and remediation services," accounting for $64.49 million dollars. The last bar is for "BS540 – Professional, scientific and technical services," accounting for $49.11 million dollars.
However, since our Input-output multipliers were based on the industry sector, the percentage of of jobs created differed slightly. Despite having an output of only 13 percent, 19 percent of the jobs created were in administrative and support, waste management and remediation services. Figure 7 shows the projected number of jobs by industry sector
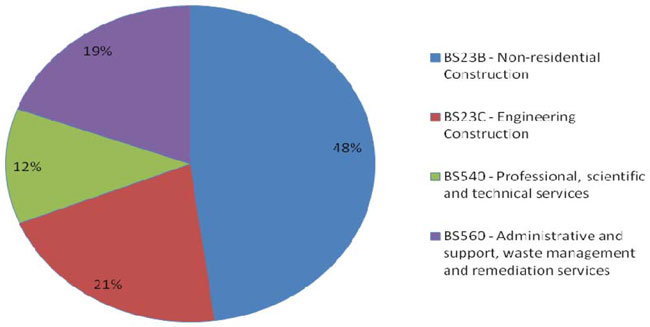
Description of figure 6 - Projected Number of jobs by Industry Sector
This figure is a pie chart illustrating the "Projected Number of Jobs by Industry Sector." The largest segment is "BS23B – Non-residential Constriction," accounting for 48%. The second-largest segment is "BS23C – Engineering Construction," accounting for 21%, followed by "BS560 – Administrative and support, waste management and remediation services," accounting for 12%, and "BS540 – Professional, scientific and technical services," accounting for 12%.
CONCLUSION
Although, the First Nations Infrastructure Fund may have had qualitative impacts, investment in First Nations communities has been shown to have important economic and employment impacts as well. Not only did the fund represent a direct expenditure of $235 million, but has been shown to have had considerable indirect and induced economic impacts as well. The estimated output from the investment is upwards of $500 million and likely created approximately 2,800 jobs nationally. These impacts were spread relatively evenly from the West Coast to Quebec. The Fund produced fewer impacts in Atlantic Canada. Much of the funding went to develop roads and bridges and it is thus, in construction industries where the impacts are to be felt most directly.