Archived - Annual Report on the State of Performance Measurement in Aboriginal Affairs and Northern Development Canada for 2011-12 and 2012-13
Archived information
This Web page has been archived on the Web. Archived information is provided for reference, research or record keeping purposes. It is not subject to the Government of Canada Web Standards and has not been altered or updated since it was archived. Please contact us to request a format other than those available.
Date : April 2013
PDF Version (394 Kb, 52 Pages)
Table of contents
Glossary
- AANDC
- Aboriginal Affairs and Northern Development Canada
- DPR
- Departmental Performance Report
- EPMRB
- Evaluation, Performance Measurement and Review Branch
- EPMRC
- Evaluation, Performance Measurement and Review Committee
- GA
- General Assessment
- HQ
- Headquarters
- IT
- Information Technology
- MAF
- Management Accountability Framework
- NCR
- National Capital Region
- PAA
- Program Alignment Architecture
- PM
- Performance measurement
- PMF
- Performance Measurement Framework
- RPP
- Report on Plans and Priorities
- SO
- Strategic outcome
- SPPD
- Strategic Policy and Programs Directorate
- SSOA
- Senior Strategic Outcome Analyst
- TBS
- Treasury Board Secretariat
Executive Summary
Background
The Treasury Board Secretariat Directive on the Evaluation FunctionFootnote 1 requires that departmental heads of evaluation prepare an annual report on the state of performance measurement in support of evaluation. In 2009, Aboriginal Affairs and Northern Development Canada (AANDC) tabled its first report, which covered activities for 2008-09. In 2011, AANDC completed its second report covering activities from 2009-2010 and 2010-2011. Both reports identified ten attributes of quality performance measurement systems in high performing organizations. These attributes were then employed as benchmarking criteria against which the AANDC performance measurement activities could be examined. These same criteria form the basis of the current report, which covers activities from 2011-12 and 2012-13.
The purpose of this project is to undertake an objective and comprehensive assessment of the state of performance measurement at AANDC, while focusing on the "collection of credible, timely and neutral information to support the ongoing assessments of relevance and performance"Footnote 2 of AANDC programming. In addition, this report considers the status of results-based management at AANDC.
Four lines of evidence were pursued to assess the impact of activities identified above: a document review, literature review, interviews and surveys. The ranking of AANDC's performance in each of the 10 key attributes identified in the Benchmarking Report is as follows:
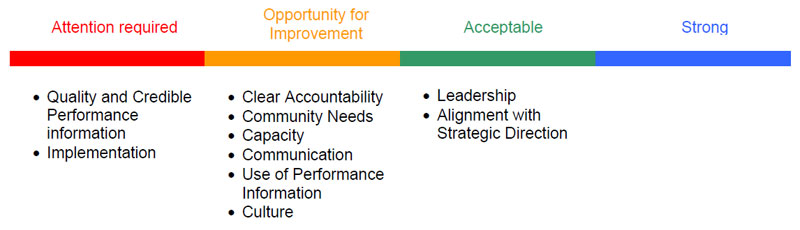
Text description of The ranking of AANDC's performance
This figure is a depiction of the scale used to rank AANDC's performance in 10 key attributes. From left to right, the rankings on the scale are as follows: attention required, opportunity for improvement, acceptable, and strong. On the scale, "quality and credible performance information" as well as "implementation" rank in the "attention required" category. "Clear accountability," "community needs," "capacity," "communication," "use of performance information," and "culture" all rank in the "opportunity for improvement" category. "Leadership" and "alignment with strategic direction" both rank within the "acceptable" category.
Key Findings
Overall, it was found that some progress has been made towards advancing a results-based management culture at AANDC (see Figure 1), although it is clear that a cultural shift remains in its infancy. The foundations for results-based management are currently being built at senior levels as awareness and understanding are being strengthened. The Department has made major headway in aligning its performance measurement and corporate reporting tools, as well as in its efforts to reduce the reporting burden on recipients through its Modernizing Grants and Contributions Initiative and an overhaul of the Recipient Reporting Guide.
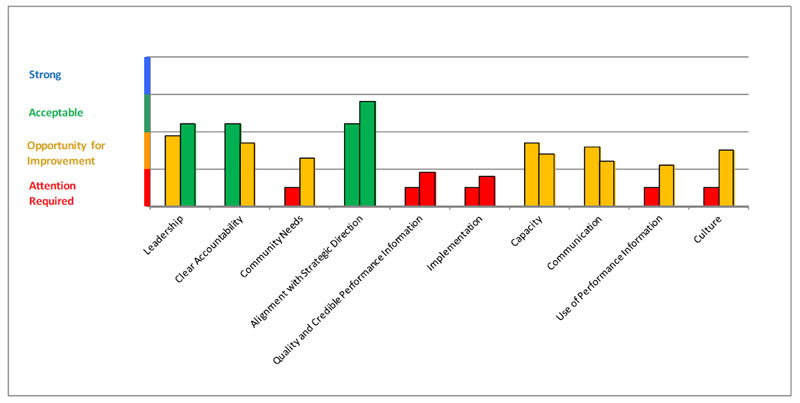
Text description of Figure 1
This graph compares the rankings of AANDC's performance in leadership, clear accountability, community needs, alignment with strategic direction, quality and credible performance information, implementation, capacity, communication, use of performance information, and culture. The ranking categories are in the following order: attention required, opportunity for improvement, acceptable, and strong. The performance categories are represented on the 'x' axis and the ranking categories are represented on the 'y' axis. In 2009-10/2010-11, "leadership" was ranked high in the "opportunity for improvement" category. In 2011-12, leadership was ranked as "acceptable," although still just above "opportunity for improvement" on the scale. In 2009-10/2010-11, "clear accountability" was ranked as "acceptable" on the lower end of the scale within that category. In 2011-12, "clear accountability" was ranked as "opportunity for improvement," but still ranked closer to the "acceptable" category on the scale than the "attention required" category. In 2009- 10/2010-11, "community needs" was ranked as "attention required." In 2011-12, the ranking of "community needs" improved from "attention required" to "opportunity for improvement," although still ranked low on the scale in that category. In 2009-10/2010-11, "alignment with strategic direction" was ranked in the "acceptable" category, although still relatively low on the scale within this category. By 2011-2012, "alignment with strategic direction" was ranked higher on the scale within the category of "acceptable." In 2009-10/2010-11, "quality and credible performance information" was ranked as "attention required." By 2011-12, "quality and credible performance information" still ranked as "attention required," but ranked slightly higher on the scale within this category. In 2009-10/2010-11, implementation was ranked as "attention required." In 2011-12, "implementation" was still ranked as "attention required," but ranked higher on the scale within this category. In 2009-10/2010-11, "capacity" was ranked as "opportunity for improvement," but ranked high on the scale within this category. By 2011-12, "capacity" was still ranked as "opportunity for improvement," but ranked lower on the scale within this category compared to 2009-10/2010-11. In 2009-10/2010-11, "communication" was ranked high on the scale within the category of "opportunity for improvement." By 2011-12, "communication" ranked quite low on the scale within the category of "opportunity for improvement." In 2009-10/2010-11, "use of performance information" was ranked as "attention required." By 2011-12, "use of performance information" ranked as "opportunity for improvement," although just above "attention required" on the scale. In 2009-10/2010-11, "culture" was ranked as "attention required." By 2011-12, "culture" was ranked as "opportunity for improvement," approximately at the midway point between "attention required" and "acceptable" on the scale.
While the Department collects a vast amount of data, much of the data remains unanalysed. Developing competencies to use performance management tools (e.g. dashboards), develop appropriate indicators and analyze the data collected were among the key training suggestions to improve capacity around performance measurement. Multiple lines of evidence confirm that there is a lack of quality performance data and that many indicators lack targets, baselines, and quality sources of data. Cost-effectiveness remains an area with few indicators dedicated to it, making it difficult for the Department to report on questions of efficiency and economy.
The use of performance information varies widely from program to program, from fully integrating performance information into decision making to programs not wanting to be held responsible for outcome information that they do not control. In many instances, program staff still largely see reporting as a mechanism for compliance.
As in previous years, the Department continues to encounter issues with gathering and analysing existing information, accessing information by relevant users, and poor tracking tools. The Department continues to use MS Office as a primary method for collecting information, though some programs are currently undertaking steps to create and implement IT systems to improve the integrity of their data and make it easier to analyse.
In large part, the Department's culture remains focused on transactions, funding and outputs. A lack of communication remains one of the primary reasons why the Department continues to struggle with program silos, duplication of information and missed opportunities to learn from past mistakes. It further lacks a comprehensive strategy to manage poor performance, and a strong understanding of roles and responsibilities around meeting strategic objectives.
Conclusion and Next Steps
In order to address the key findings identified above, AANDC should consider:
- Improving the coordination between centres responsible for performance measurement and corporate reporting tools to increase the alignment and dissemination of information;
- Working more collaboratively with regional staff and stakeholders when developing performance frameworks and indicators;
- Developing stronger indicators around cost-effectiveness and efficiency to respond to the demand for more information in these areas; and
- Establishing standards and targets to measure the 10 attributes for the annual report on the state of performance measurement in collaboration with key internal partners.
1 Introduction
The purpose of this report is to provide an assessment of the state of performance measurement in support of evaluation at Aboriginal Affairs and Northern Development Canada (AANDC). In addition to the clear value in assessing the state of the Department's performance measurement to ensure high quality performance measurement, the annual report ensures compliance with the 2009 Treasury Board Secretariat's (TBS) Policy on Evaluation and Directive on the Evaluation Function ,which state that the Head of Evaluation is responsible for the"provision of an annual report on the state of performance measurement of programs in support of evaluation to the Departmental Evaluation Committee."
In 2009, the Benchmarking Report introduced a broad frame of reference in interpreting and assessing the performance measurement (PM) work throughout the Department, including 10 attributes of high performing organizations to guide the assessment against which the Department's PM activities could be examined. For this report, a comprehensive literature review assisted in refining the description of these 10 attributes, as described below.
| KEY ATTRIBUTE | BRIEF DESCRIPTION |
|---|---|
| Leadership | Senior levels of an organization are involved and actively support a performance measurement culture |
| Clear Accountability | PM roles and responsibilities related to development, implementation and reporting are well articulated and understood at all levels in the Department, as well as external partners |
| Community Needs | Needs and capacity of the community being served by PM activities are integrated into the process |
| Alignment with Strategic Direction | Performance measurement is aligned with strategic direction of the Department |
| Quality and Credible Performance Information | Performance measures have established baselines, clear performance targets, and are easily accessible. There is confidence in the information and data captured through PM activities |
| Implementation | PM activities are fully implemented and monitored by effective systems and processes (e.g. databases, software) |
| Capacity | Managers and staff have knowledge, skills and proper training to fulfill PM requirements |
| Use of Performance Information | PM information and data are used to inform program management, program improvement, planning, decision making, policy development, and reporting |
| Communication | Key performance information is cascaded through the organization and all stakeholders, partners and staff understand its significance and their role in achieving expected results |
| Culture | AANDC collectively values result-based management through proper mechanisms and leadership |
1.1 Previous Reports
In September 2009, the Evaluation, Performance Measurement and Review Committee (EPMRC) approved the first annual report: "State of Performance Measurement in Support of Evaluation at Indian and Northern Affairs Canada," which covered activities for 2008-09. This benchmark report illuminated AANDC's achievements in the area of performance measurement and offered insight into the challenges and opportunities ahead. The report identified 10 key attributes characteristic of organizations with quality performance measurement systems. AANDC's performance measurement activities were assessed within this context. The report found that while the Department has made strides to address challenges associated with quality performance measures, data collection processes and reporting burden, there is still a need for enhanced communication around the roles and responsibilities of staff in relation to performance measurement activities, as well as greater coordination within the Department, across national and regional levels, with First Nations and external partners.
In November 2011, EPMRC approved the second annual report: "State of Performance Measurement in Support of Evaluation for 2009-10 and 2010-11." The same 10 criteria used in the 2009 report formed the basis of this report, though it was deemed difficult to assess departmental progress in relation to these attributes as metrics were not established in advance of data collection. Indictors were established to help identify what to look for, but the indicators were identified after data collection was complete. As a result, the ranking drew upon available information, which did not always relate to the indicators. It was recommended then that a balance of quantitative and qualitative sources be established for future reports to reduce reliance on interviews and/or focus groups.
The report found that the Department made progress in advancing performance measurement but that there remains some areas for improvement. AANDC lacks a coordinated approach to developing leadership in performance measurement, engaging communities and increasing capacity in support of a results-based culture. In addition, the report found a lack of usable performance data (data that can be used to assess whether a program has achieved stated objectives). In short, the development of a results-based culture was deemed to be in its infancy at AANDC.
1.2 Rationale and Scope
Recognising that performance measurement contributes to results-based management as well as to evaluation, the report explores the contribution of performance measurement to program management, monitoring and reporting as well as to evaluation. It further assesses departmental progress in improving its results-based management culture.
For the purposes of this report, performance measurement activities refer to those activities undertaken to support monitoring, measuring, evaluating and reporting on the performance of AANDC programs and services. An emphasis was placed on examining activities related to the development and implementation of performance measurement strategies, given their key role in supporting the Department as it responds to commitments under the Policy on Evaluation and the associated directive.
In addition, a review of the 10 key attributes and indicators was done to bring more of a balance between quantitative and qualitative sources and to overcome the limitations of last year's report.
1.3 Data Collection and Methodology
In June 2012, the Terms of Reference for this project were approved by EPMRC. Research activities commenced in August 2012 and were concluded in December 2012. In addition to meeting TBS requirements, this report will help to advance AANDC's performance measurement agenda by identifying lessons learned, best practices and opportunities for moving forward. The report looked at data from fiscal year 2011-12, as well as some from 2012-13 where relevant.
Four lines of evidence were pursued to assess the impact of activities identified above: a document review, literature review, interviews and surveys, as outlined below.
1.3.1 Document and Literature Review
The purpose of the literature review was to examine past research on the implementation of a results-based-management regime and performance measurement system in the public sector. The review helped to provide reference material associated with the 10 key attributes, including best practices and lessons learned. Literature reviewed included academic articles and governmental reports (e.g. Government of Canada, Office of Auditor General, United States General Accounting Office, United Nations, etc.).
In addition to the literature review, a comprehensive review of internal documentation was undertaken that could be grouped under the following categories:
- Planning and Reporting documentation (i.e. Corporate Business Plan, Report on Plans and Priorities, Quarterly reports, Departmental Performance Report, etc.);
- Performance measurement strategies approved since 2009 (n= 25);
- Evaluation reports completed since April 2011 (n= 14);
- Official documentation from Treasury Board Secretariat (Policy and Directives); and
- Evaluation, Performance Measurement and review Branch (EPMRB) documentation (i.e. previous annual reports on the state of performance measurement, special initiatives and studies).
1.3.2 Interviews
A total of 33 key informant interviews were conducted for this evaluation. The breakdown of the interviews is as follows:
- Senior Management, including eight (8) Assistant Deputy Ministers, three (3) Regional Directors General, and three (4) Directors General (Headquarters - HQ);
- Program staff affiliated with Performance Measurement Strategies , including one (1) Director and nine (9) Analysts;
- Internal experts, including two (2) from the Strategic Policy and Programs Directorate (SPPD), and three (3) from EPMRB; and
- External experts, including one (1) from the Centre of Excellence in Evaluation at TBS and one (1) from Canadian Heritage.
Interview guides were provided in advance of the interviews as requested. The data was compiled and analysed to highlight perceptions, common trends and compliment the other lines of evidence.
1.3.3 Surveys
In order to obtain a wider range of opinions, insights and information, a survey was conducted with AANDC staff from Headquarters and regional offices. Two web based surveys were developed around the 10 key themes using the software FluidSurveys. Most of the questions were closed-ended based on a 4-point Liker scale ranging from "strongly agree" to "strongly disagree," with the option to provide additional comments on most questions.
Following a pilot test conducted among EPMRB's evaluators, the surveys were administered online between December 10, 2012, and December 21, 2012. A survey invitation and a follow-up reminder were sent through e-mail to two multi-stage stratified random samples. Group 1 included a multi-stage stratified random sample of 494 out of a population of 1098 employee from Headquarters; group 2, a multi-stage stratified random sample of 500 out of a population of 1150 from regional offices. Group 2 was stratified in a way so that the sample was representative of the number of employee across all AANDC regional offices. Both samples were stratified to include employees working at the program level as well as in internal services with a proportion of 90 percent/10 percent. The samples were drawn from the October 2012 Human Resources personnel data file and included employees in the EC, CO, PM, AS and EX-01 classifications.
Evaluators received completed surveys from 167 employees in the Nation Capital Region (NCR) for a response rate of 33.8 percent, and 183 completed surveys from regional employees for a response rate of 36.6 percent. It should be noted that during the course of the survey, 19 additional people were added to the regional sample to replace those who were on holiday during the period of the survey, retired and/or had left the Department.
1.3.4 Ranking
Similar to last year's report on the State of Performance Measurement is a ranking of the Department's performance in each of the 10 key attributes identified in the Benchmarking Report. The levels of measurement used are the same as those used for the Management Accountability Framework (MAF):
(Levels of measurement: attention required; opportunity for improvement; acceptable; strong)
In order to guide the ranking, the key attributes were further defined and indicators were developed. The rankings were assigned using the information collected through the document and literature review, interviews and surveys.
1.4 Considerations and Limitations
In order to overcome the limitations identified in last year's report, a number of measures were implemented prior to data collection, including the development of 32 qualitative and quantitative indicators to measure the 10 criteria; following up with all program managers with a performance management strategy to get the most recent version; and increasing the number of interviews to get as many perspectives as possible. Nevertheless, the annual report on the state of performance management for 2011–2012 also has limitations that should be considered for the next report.
The development of 32 indicators allowed a better definition of the 10 criteria identified in this report. However, in order to better measure these criteria, standards or even targets should be established that would allow a better gauge of AANDC's progress along the "attention required – strong" scale. The literature provides a large amount of information on practices that must be put in place to ensure sound, results-based management within organizations. The fact remains that AANDC should first determine the level of excellence it wants to achieve in terms of results-based management in order to determine where the priorities should be and to put in the necessary efforts, while keeping its internal and external environment in mind. Senior management and key stakeholders will have to study this to establish these criteria. The Public Health Agency of Canada has previously engaged in a similar study and its experience could be examined.
The data analysis showed that the term "performance measurement" caused some confusion among those interviewed and surveyed, even though each term had been defined. Some people who were unfamiliar with performance measurement strategies adapted this terminology to their own reality and approached it in a broader accountability context. Therefore, some care should be taken when interpreting the results in terms of performance measurement strategies, but this does in no way change their value in a results-based management context.
Finally, this study's initial methodology indicated that specific emphasis would be placed on the community needs theme in order to better identify the knowledge and experience of Aboriginal communities and organizations in terms of AANDC's performance measurement strategies, the communities' involvement in developing these strategies, and whether the indicators were in line with the community needs. After completing the document review and assessing the level of Aboriginal community and organizational involvement, it was determined that it was too early to explore this avenue. Rather than conducting a survey of Aboriginal stakeholders, the evaluation group developed a survey targeting regional employees, in order to better understand their involvement and, indirectly, the involvement of Aboriginal communities and organizations in developing performance measurement strategies.
2 Key Findings
2.1 Leadership
Senior levels of an organization are involved and actively support a performance measurement culture.
Strong leadership is critical for the success of the creation, implementation and use of performance measurement and results-based management systems. An analysis of interviews conducted for this report demonstrates that there is an increased understanding and appreciation for results-based management at the senior levels of the Department, though it is acknowledged that it presents a culture change and is still a relatively new way of thinking about performance information. Survey results indicate that 88 percent and 84 percent of respondents in the NCR and regions, respectively, believe that senior management is supportive of results-based management.
In a strong results-based management organization, senior managers must demonstrate their willingness and ability to make decisions and manage programs on the basis of results by clearly articulating their goals and showing that decisions are made based on the results measured against these goals.Footnote 3 When asked about whether performance results were being sufficiently discussed at senior levels, almost all interviewees responded that performance outcomes are not consistently part of discussions among senior management, and that discussions tend to be more process-oriented. It was also noted that the Deficit Reduction Action Plan consumed a large portion of time and energy over the past year so that some projects and initiatives were either slowed down or stalled.
Senior management did, however, express a strong appetite for integrating results-based management into day-to-day activities and operations, and most could provide examples of PM activities being undertaken in their sector. Thus, awareness in this area is considered high among senior management. Others observed that senior level committees and quarterly reporting could be better utilized to generate and focus the discussion around results.

This figure is a scale which represents four categories in the following order, from left to right: attention required, opportunity for improvement, acceptable, and strong. On this scale, "leadership" is being measured. "Leadership" ranks in the "acceptable" category on the scale, but the ranking is low on the scale within this category, closer to the "opportunity for improvement" category.
Based on the findings above, AANDC was ranked with "acceptable" in leadership. In a strong results-based management culture, senior managers must continuously ask for results information at the planning, implementing and reviewing steps to the point that is becomes routine. Senior management must also be committed and involved in long-term planning, which includes revisiting performance measurement tools on a regular basis to ensure they remain relevant in a changing environment.
2.2 Clear Accountability
Performance measurement roles and responsibilities related to development, implementation and reporting are well articulated and understood at all levels in the Department, as well as external partners.
One of the mechanisms through which the Department outlines its roles and responsibilities for a program is through performance measurement strategies. In most performance measurement strategies reviewed, a clearly articulated governance section was found, and all PM strategies had clear roles and responsibilities outlined for managers and staff.
Accountability for results-based management typically lags when management and staff fail to see the usefulness of performance measurement tools as well as the opportunity to relate day-to-day operations with the larger strategic vision. Consistent with previous annual reports, it was found that roles and responsibilities associated with performance measurement were not always clear at all levels. In particular, some interviewees expressed the larger departmental role as simply being a "funder," and thus, did not feel comfortable setting targets for outcomes that are influenced by external factors.
For its part, interviewees largely saw EPMRB staff as being helpful in the development of their performance measurement strategies, and noted that one of the keys to success was the consistency of staff dedicated to the file. They further noted that while materials and guidance documents were provided that gave some general insight into creating a PM strategy, they were not considered as useful as they could be. The guidance document is currently under review.
There was also some confusion around the roles of EPMRB and the Planning, Research and Statistics Branch (PRSB), both of whom work on performance measurement in the Department. EPMRB is heavily involved in PM strategy development, while PRSB works directly with departmental performance reporting, such as Quarterly Reports and the Departmental Performance Report (DPR). A Performance Measurement Working Group meeting was held in October 2012 to discuss how the two branches could work more collaboratively, including the development and use of joint tools. Interviewees who had developed their program's PM strategy also expressed the importance of bringing in key players together at the beginning of the process to reduce confusion that can arise from ad hoc meetings where not all parties are present.

This figure is a scale which represents four categories in the following order, from left to right: attention required, opportunity for improvement, acceptable, and strong. On this scale, "clear accountability" is being measured. "Clear accountability" ranks in the "opportunity for improvement" category, closer to the "acceptable" category than the "attention required" category.
Based on the findings above, AANDC was ranked with "opportunity for improvement" in clear accountability. More work can be done to ensure that collaboration between the two performance measurement functions are taking place, and that training/workshops are made available for program staff requiring assistance in this area, as this has been proven helpful in the past.
2.3 Community Needs
Needs and capacity of the community being served by PM activities are integrated into the process.
Reducing the recipient reporting burden is a key priority for the Department. One of the major initiatives underway in this respect is the modernization of grants and contributions. According to AANDC's website:
"Modernizing grants and contributions management has advantages for Aboriginal Peoples by focusing on service to communities, and their members, achieving economies of scale, reducing the administrative burden on recipients, saving taxpayers' dollars and ultimately ensuring more value for money."Footnote 4
As part of this initiative, the Department has worked closely with First Nations financial specialists to develop a General Assessment tool that assesses the risk associated with each recipient according to their particular track record. The goal is to reduce reporting requirements and provide longer-term funding arrangements to recipients that are assessed as being a low risk.
Furthermore, AANDC is working closely with Health Canada to align their approach to grants and contributions by taking the same approach to risk assessments and funding agreements. Moreover, it is expected that both departments will share the same IT systems for financial and grants and contribution management to decrease the reporting burden to recipients where possible.
Over the past year, the Department has placed a strong focus on how it uses the data provided by funding recipients, which has resulted in a significant reduction in the number of ad-hoc reports the Department requests of recipients from 4800 in 2011-12 to 800 in 2012-13.Footnote 5 In December 2012, a Performance Measurement Summit was held to discuss how the Recipient Reporting Guide could be further reduced to eliminate duplications and inefficiencies. As it stands, 412 distinct performance indicators still exist within the Department. At the program level, 56 percent of survey respondents in the NCR and 69 percent in the regions believe that their particular Branch/ Directorate is working to reduce the reporting requirements on Aboriginal communities and organizations. These numbers are likely to improve as further work on reducing the Recipient Reporting Guide is undertaken.
According to the literature, the development of a performance measurement framework should be done in collaboration with stakeholders (i.e. partners, staff, and beneficiaries) that will have an influence in the achievement of outcomes. By including stakeholders in all the steps to define expected results and indicators, a sense of ownership is created to support a sustainable performance measurement system. Studies demonstrate that a common pitfall is to develop an outcome framework by retro-fitting actual services to the desired outcome instead of starting with the intended outcomes to activities.Footnote 6 Furthermore, consultation and collaboration help to overcome challenges met in the implementation of performance measurement frameworks.Footnote 7 In recent years, the Department has highlighted the importance of First Nations and tribal councils reporting to their members, which strengthens the importance of considering Aboriginal needs in the development of an outcome framework. As mentioned in the current AANDC recipient reporting guide:
First Nations need to have information to inform their community members about the effectiveness of programs, as well as to be able to adjust the programs to meet the specific needs of their members more efficiently and effectively. Working in partnership with First Nations is key and information identified and collected should be beneficial for First Nations or tribal councils, as well as for AANDC, in effectively administering and managing funded programsFootnote 8.
Interviewees generally observed that when it comes to performance measurement, there remains a disconnect between HQ, regions and stakeholders. When asked whether the development and implementation of performance measurement tools (e.g. performance measurement strategies) was done collaboratively, the response by regional staff was that there is some collaboration with regional staff (56 percent), but less so with Aboriginal community service delivery agents and organizations (31 percent). While some interviewees at the program level were able to provide examples of how community capacity was taken into consideration when developing indicators, the difference between what is considered important and being measured at the community level and what is required by AANDC remains wide.

This figure is a scale which represents four categories in the following order, from left to right: attention required, opportunity for improvement, acceptable, and strong. On this scale, "community needs" is being measured. "Community needs" ranks in the "opportunity for improvement" category, but lies closer to the "attention required" category that the "acceptable" category.
Based on the findings above, AANDC was ranked with "opportunity for improvement" in community needs. The Department is taking strong steps to reduce the reporting burden for recipients by simplifying the reporting structure and reducing the number of ad-hoc reporting required. AANDC could improve in this area by working more collaboratively with stakeholders when developing performance frameworks and indicators.
2.4 Alignment with Strategic Direction
Performance measurement is aligned with the strategic direction of the Department.
An important element for a successful results-based management organization is to align its program and performance measures with its strategic goals and priorities and to measure performance against those goals.Footnote 9 In the past year, the Department has restructured the Policy and Strategic Direction (PSD) Sector, which now has a Results-Based Management Directorate (RBMD) within its PRSB. Within PRSB, extensive work has been completed to ensure the alignment of PM strategies with the Program Alignment Architecture (PAA) and the Performance Measurement Framework (PMF). To date, it is estimated that there is 43 percent PAA coverage by PM strategies, and a review of PM strategies reveals that all but three of them have a clearly established link to the PAA. An analysis of alignment between the PMF and PM strategies shows that alignment between these documents has increased significantly in the past year.
Moreover, the Department is undertaking work to better align higher level outcomes of PM strategies to the Report on Plans and Priorities (RPP) and Departmental Performance Report (DPR). The Corporate Business Plan is also expected to use outcomes outlined in the PMF beginning in 2013-14. A number of interviewees noted that improvements could be made in aligning the Quarterly Reports with the Corporate Business Plan to solidify the link between the Department's strategic goals and day-to-day operations. Senior managers also generally noted that Quarterly Reports have been helpful in aligning priorities. Interviewees largely agreed that alignment between performance measurement and corporate reporting tools is critical in strengthening AANDC's performance measurement culture.
The foundation for results-based management in the Government of Canada lies in the Financial Administration Act, the Federal Accountability Act and the Expenditure Management System.Results-based management is expected to grow in importance as parliamentarians increasingly request performance and financial information. TBS acknowledges that performance information is becoming more of a central focus, and is becoming more sought after than reporting on expenditures. To this end, the next iteration of the DPR will be looking departmental activities at the sub-sub program level. Thus, the alignment work currently being undertaken by the Department is critical to its ability to successfully report to Canadians on program results.

This figure is a scale which represents four categories in the following order, from left to right: attention required, opportunity for improvement, acceptable, and strong. On this scale, "alignment with strategic direction" is being measured. "Alignment with strategic direction" ranks as "acceptable" on the scale, closer to the "strong" category than the "opportunity for improvement" category.
Based on the findings above, AANDC was ranked with "acceptable" for alignment with strategic direction. The Department has made major headway in aligning its performance measurement and corporate reporting tools and should continue its efforts to increase this alignment to improve its ability to report on performance.
2.5 Quality and Credible Performance Information
Performance measures have established baselines, clear performance targets, and are easily accessible. There is confidence in the information and data captured through performance measurement activities.
A lack of quality performance data remains an issue for the Department. Between April 2011 and November 2012, of the 19 evaluations that were approved by EPMRC, only three did not reference a lack of quality or reliable performance data as a limitation. In particular, from the 16 evaluations with performance limitations, seven reported poor/limited performance measures (i.e. some indicators were not collected), two evaluations cited no performance measurement strategies and one evaluation reported that there was no program logic model. Furthermore, nine evaluations specifically noted significant challenges pertaining to data quality, reliability and completeness when it was available. According to survey respondents, 62 percent in the NCR and 53percent in the regions expressed doubt around the reliability of performance information collected and/or reported on.
As part of the PM strategy review, it was found that almost all PM strategies identified more than one source of data, though many of the data sources could only speak to outputs or did not qualify as a source of data (i.e. TB Submissions or the PM strategies themselves). The review also found that a source of data for six percent of indicators in PM strategies had yet to be determined. One of the key areas for review during the implementation process will be to determine a source of data for each indicator.
As the Department shifts towards a more results-based culture, it must consider developing and improving its baseline data and targets in order to obtain more meaningful information around performance. The PM strategy review found that only 13 percent of indicators had established baseline data, and only 41 percent of indicators had targets attached to them. Furthermore, 41 percent of survey respondents reported that the performance information collected and/or reported on did not meet the needs of their specific Branch/Directorate.
One of the clear reasons for collecting performance information is to identify efficiencies and cost-effectiveness. There is a sense among AANDC employees that performance information is being used increasingly to measure cost-effectiveness, with 67 percent of NCR survey respondents and 57 percent in the regions agreeing with this statement. In terms of actual indicators that can be used for assessing cost-effectiveness, only eight percent could be found to have a direct link. Thus, developing indicators for measuring cost-effectiveness should be a priority for the Department to increase its ability to meaningfully report on this area.
Several interviewees made the point that quality and credible information only matters if it is accessed and used for decision making, and many claim that accessibility of information to relevant stakeholders and decision-makers remains an issue. In terms of carrying out evaluative or policy work in the Department, it was noted that it can be difficult to obtain relevant program data, and that it can take time before being able to access information that should be readily available. In addition, 41 percent of NCR survey respondents and 50 percent in the regions believe that performance information is being used solely for compliance purposes.

This figure is a scale which represents four categories in the following order, from left to right: attention required, opportunity for improvement, acceptable, and strong. On this scale, "quality and credible performance information" is being measured. "Quality and credible performance information" ranks in the category of "attention required," but lies extremely close to "opportunity for improvement" on the scale.
Based on the findings above, AANDC was ranked with "attention required" for quality and credible performance information. Quality and credible performance information is the backbone of a strong results-based management culture, which requires that information be complete, accurate, consistent, credible, relevant, accessible, valid, in time and easy to use.Footnote 10This area must be a key priority for the Department in its effort to strengthen its performance measurement function.
2.6 Implementation
PM activities are fully implemented and monitored by effective systems and processes (e.g. databases, software).
The success around implementing a results-based management system depends on a management system that includes the collection, recording, analysis and systematic reporting of information on performance and the use of an appropriate number of indicators.Footnote 11 Performance measurement strategies are a revealing indicator of the state of the implementation of a results-based management system in the Department, as it allows program results to be systematically assessed and monitored.
An analysis of the performance measurement strategies demonstrates that, to date, 14 PM strategies do not identify whether the indicators are in Stage I or Stage II. Stage I indicates information that is currently collected within the Department, and Stage II is information that is not yet collected but deemed feasible to obtain. In terms of the remaining 11 PM strategies, of the 164 indicators identified as either being in Stage I or Stage II, 97 indicators (59 percent) are in Stage I, and 67 (41 percent) are in Stage II.
The Annual Report on the State of Performance Measurement for 2009–2010 and 2010–2011 mentioned a number of factors that hindered the implementation of the performance measurement strategies, such as issues with gathering and analysing existing information, accessibility for relevant users, and poor tracking tools. This year's interviews revealed that these factors were still a problem within the Department. According to certain authors, these elements are also the main reasons why the implementation of a performance measurement system can fail.Footnote 12
Initially, program managers encountered problems in measuring their performance when their indicators depend on external data sources that are outside their program's control (e.g. provincial government, other programs, etc.). Due to this dependence on external sources, a considerable amount of time and effort are often required to obtain the data, which is occasionally incomplete. Also, when a program is being restructured, performance measurement strategies are implemented more slowly, either because it takes time to incorporate indicators into the new program structure, or because program leads prefer to wait until the restructuring is complete so they can change the performance measurement strategy.
With regards to data management, most of the people interviewed feel that AANDC's computer system is not suitable for ensuring data integrity or for collecting and analysing performance data. The MS Office suite (i.e. Excel) is reportedly used most often to collect performance data for the regional offices (57 percent) and HQ (59 percent) alike, followed by hard-copy reportsFootnote 13 (44 percent for the regions, 34 percent for HQ). The databases developed with IM/IT reportedly account for only 22 percent in both groups.

This figure is a scale which represents four categories in the following order, from left to right: attention required, opportunity for improvement, acceptable, and strong. On this scale, "implementation" is being measured. "Implementation" ranks in the "attention required" category on the scale, but is close to the "opportunity to improvement" category.
Based on the findings above, AANDC was ranked with "attention required" for implementation. Some programs have proposed integrated IT systems to improve the integrity of their data (e.g. ICMS, CLCA). This is a work in progress, though, and much work still needs to be undertaken, not only to implement the systems, but to ensure that key people are using them. AANDC has set up a pilot project with the education group to create a centralized platform (Electronics and Informatics Services) to collect data and access the information.
2.7 Capacity
Managers and staff have knowledge, skills and proper training to fulfill PM requirements.
Within an organization, capacity is a key component in ensuring performance data is used. Managers and staff need resources and skills to plan, develop, collect and analyze the data to ensure the information is credible and useful. Consequently, a results-based organization must provide its members with training and professional development on performance measurement techniques to improve their capacities, as well as to ensure that employees are willing to improve performance and are committed to doing so. Using expertise to support the implementation, development and use of a performance measurement system, such as performance measurement experts, is also well documented.Footnote 14
According to the data gathered, AANDC staff are collecting a large amount of data that could be used to measure performance. The problem lies with the time and resources needed to analyze the information. "We have a lot of data, not enough analysis." As a result, the data collection systems put more emphasis on outputs rather than results. Developing performance measurement strategies can assist programs in defining their objectives and expected results. It has been consistently reported that implementing performance measurement strategies requires more time and effort than was initially planned. If the program has not assigned the necessary staff, performance measurement is put on the backburner in favour of other program priorities. The survey results also support this sentiment. According to the respondents of both surveys, a lack of human resources (47 percent and 51 percent) is the main hurdle to gathering information on performance. To correct this, survey respondents suggest increasing the number of human resources (43 percent and 49 percent), increasing the time devoted to measuring performance (28 percent and 30 percent) and putting tools in place, such as improved computer systems.
With regards to employee competencies, roughly 20 percent of employees feel they do not have the knowledge and skills they need in relation to performance measurement. In terms of what could be done to mitigate this, developing competencies to use performance management tools (e.g. dashboard), develop indicators and analyse data were commonly cited.
Generally speaking, respondents were satisfied with the level of expertise that the EPMRB officers. In fact, program leads rely heavily on the evaluations to provide information such as the results of their program. However, some people noted that, within the Evaluation Branch, there is a lack of expertise in developing performance measurement strategies, depending on who is responsible for the file. There is also a lack of consistency in the information provided about the procedure to follow with program leads and partners.
Finally, only a small number of people interviewed reported working collaboratively with PSD on developing their performance measurement strategy. Those who have experience with this group noted that the Senior Strategic Outcome Analysts (SSOA) provided excellent advice and helped them network with the right people.

This figure is a scale which represents four categories in the following order, from left to right: attention required, opportunity for improvement, acceptable, and strong. On this scale, "capacity" is being measured. "Capacity" ranks as "opportunity for improvement" on the scale, but sits closer to "attention required" than to the "acceptable" category.
Based on the findings above, AANDC was ranked with "opportunity for improvement" in capacity. Several managers mentioned that the departmental spending cuts had affected the staff's capacity to meet performance measurement expectations. Some were of the opinion that the Department had lost ground compared to previous years. The EPMRB has not escaped the consequences of the cuts either, and a number of initiatives have been put on hold. However, the development of a training program for results-based management did go ahead and it was taken by all the evaluators in June 2012. This training was designed to strengthen their results-based management skills, with a view to eventually extending it to the programs.
2.8 Use of Performance Information
Performance measurement information and data are used to inform program management, program improvement, planning, decision making, policy development, and reporting.
The objective of collecting performance information is to assist the Department in taking sound action based on information that can assist in identifying program priorities, allocating resources, improving programming, establishing future performance expectations and reporting on progress towards achieving stated objectives.Footnote 15 Relevant performance information should also be reported and communicated to all stakeholders, policy-makers and evaluators.Footnote 16 Based on the results of this study, it must be noted that considerable effort is still required to encourage the use of performance measurement data within the Department.
While a few managers mentioned using quarterly reports, some questioned the usefulness of the tool its value in terms of decision making. Furthermore, the DPR and Report on Plans and Priorities (RPP) are often considered useful for Members of Parliament but not at the operational level.
The use of performance information varies widely from program to program. Some claim to use the results of their performance information significantly in decision making. According to the surveys, 63 percent of respondents from regional offices and 61 percent of HQ respondents use the information collected for program management and program improvement. Others continue to struggle with whether they can be held responsible for outcomes when they are not the service provider. In a number of cases, reporting is considered a mechanism to support compliance and managers and staff do not see a practical use in measuring and analysing their performance information.
Also compared to some departments, AANDC did not integrate internal services indicators in its PMF. However, this may change in the future as TBS is developing a set of performance measures (i.e. KPIs) that corresponds with MAF. This will help departments in reporting on the same indicators (i.e. finance).

This figure is a scale which represents four categories in the following order, from left to right: attention required, opportunity for improvement, acceptable, and strong. On this scale, "use of performance information" is being measured. "Use of performance information" ranks in the "opportunity for improvement" category and is quite close to the "attention required" category on the scale.
Based on the findings above, AANDC was ranked with "opportunity for improvement" for use of performance information. The Department currently collects a large amount of data, which can make it difficult to identify, select and validate information. Because of the lack of integration among data, users are demonstrably frustrated because of the time it takes to produce or find the useful and relevant information in the context of accountability and decision-making activities.
However, it is reported that this information is being used for decision making and program improvement. To provide better context on the data's use, EPMRB, through its internship project, recently developed a tool to measure the use of evaluations in the Department.
2.9 Communication
Key performance information is cascaded through the organization and all stakeholders, partners and staff understand its significance and their role in achieving expected results.
According to the literature, communication is as important as formal processes for strategic planning and reporting.Footnote 17 Employees should continuously be informed on the progress towards achieving intended results in order to remind them of the link between program and departmental goals and their day-to-day activities. This further serves to keep up the momentum and employee engagement. Also, communication should be bi-lateral so that when managers communicate with stakeholders and employees to inform them of the strategic vision and their roles, they have the opportunity to understand what the challenges are and to take immediate action to correct the situation.Footnote 18
According to the individuals interviewed, the Department's internal communications efforts focus on accountability, reporting and program guidelines. Departmental committees, and meetings with managers and regional directors, are often organized to provide and receive information on activities. While the main topics of discussion are the activities, budget and priorities, little attention seems to be given to performance measurement indicators.
At the operational level, apart from a few exceptions that are closely linked to the leadership of some managers, the information is not systematically conveyed to employees, either at HQ or in the regions. Many people indicated that the information could be accessed through AANDC reports and the AANDC website, but it was not necessarily disseminated. Although attempts have been made to make employees aware of initiatives to reduce the administrative burden, efforts tend to revolve around carrying out day-to-day activities. Discussions around performance measurement and objectives only take place sporadically. The survey findings also show that many employees wonder how results-based management aligns with their duties or their branch.
The literature states that external stakeholders should be part of a communication channel. The purpose is to increase the consensus, facilitate the coordination of activities, enhance collaboration and allow them to inform how the organization is achieving its objectives. However, respondents observed that there is a difference between knowing and understanding. In their view, the communications tools—especially accountability tools—make it possible for recipients to become aware and learn something about the program and reporting expectations without necessarily gaining an in-depth understanding of them. For example, very few respondents felt that Aboriginal organizations and communities are familiar with performance measurement strategies.
All of the people interviewed agreed that communications with employees and stakeholders should be strengthened, and that more effort and better coordination are required in order to improve understanding of the objectives and performance measurement.

This figure is a scale which represents four categories in the following order, from left to right: attention required, opportunity for improvement, acceptable, and strong. On this scale, "communication" is being measured. "Communication" ranks in the "opportunity for improvement" category on the scale and lies quite close to the "attention required" category.
Based on the findings above, AANDC was ranked with "opportunity for improvement" in communication. In the Department, communication is used primarily to support accountability rather than promote engagement and collaboration. However, communication must become a means for managers and senior management to stimulate interest and encourage the involvement of those concerned at all levels, working horizontally to break down program silos and promote dialogue in order to achieve strategic objectives.
2.10 Culture
AANDC collectively values result-based management through proper mechanisms and leadership.
To create a results-based culture, an organization must involve all levels of employees and ensure their commitment to improving operational and program performance. Mechanisms like accountability, communication and formal and informal incentives that reward success helps change the behavior and create a results-based management environment.Footnote 19
The majority of respondents from HQ and the regions understand the theoretical significance of results-based management (88 percent according to the survey). However, some remain sceptical regarding the implementation of a results-based culture in the Department. While the tools may be in place, the culture is not following. The Department's culture currently focuses on transactions, funding and outputs. The three main reasons mentioned by survey respondents for measuring performance in their branch/sector are long-term planning, evaluating the performance of specific initiatives and the producing performance and compliance reporting. Only approximately 20 percent of respondents indicated that performance measurement management was used as a monitoring and control tool for daily activities, despite the fact that senior management is making a strenuous effort to ensure that the results of quarterly reports are used as management tools.
There is also a lack of integration among various indicators, and many observed a duplication of information and/or multiple requests for the same information by various stakeholders in the Department. Silo-style management is still present, and some respondents mentioned a lack of performance-related communication between the various sectors. Some respondents even mentioned that the TBS encourages a culture of conformity through its requirements.
A results-based management culture is flexible and is able to learn and adapt from past performance and make the necessary changes to programs. Organizations should see mistakes as an opportunity to learn. The organization should provide time and resources to their managers to make adjustment to their operations and create learning events by having an information sharing and communication structure.Footnote 20 At AANDC, only 67 percent of HQ survey respondents and 61 percent of regional respondents believe that their branches and sectors adapt and learn from past experience.
Finally, some managers assess that it will be difficult to implement a results-based management culture as long as there is no departmental strategy to manage poor performance; as long as there is a lack of coordination and integration to avoid duplication of information (in particular though the implementation of integrated performance tools); and as long as there is a lack of understanding around roles and responsibilities in meeting strategic objectives.

This figure is a scale which represents four categories in the following order, from left to right: attention required, opportunity for improvement, acceptable, and strong. On this scale, "culture" is being measured. "Culture" ranks in the category of "opportunity for improvement" on the scale, at the midway point between "attention required" and "acceptable."
Based on the findings above, and taking into consideration other intrinsic factors included in this report, AANDC was ranked with "opportunity for improvement" for culture. Further to various interviews, many stated that, despite the work still to be done for transitioning from transaction-based management to results-based management, the tools implemented to ensure accountability by focusing on results have improved the Department's culture. However, much remains to be done to make results-based management more than a theoretical principle in people's minds.
3 Conclusion
3.1 Summary of Key Findings
In 2011-12 and 2012-13, the Department was able to make considerable gains in certain areas pertaining to performance measurement. In particular, the Department undertook work to strengthen the alignment between corporate performance documents and program performance documents, as well as to reduce the recipient reporting burden through its modernization initiative towards Grant and Contribution Agreements and reduction of the Recipient Reporting Guide. However, the Department continues to struggle with the quality and credibility of its information, as well as the implementation of its performance measurement strategies.
Based on information collected through the document and literature review, interviews and surveys, the ranking of AANDC's performance in each of the 10 key attributes is as follows:
Text description of The ranking of AANDC' performance
This figure is a scale which represents four categories in the following order: attention required, opportunity for improvement, acceptable, and strong. This scale includes a summary of the ranking of AANDC's performance in each of the 10 key attributes, which include: quality and credible performance information, implementation, clear accountability, community needs, capacity, use of performance information, communication, culture, leadership, and alignment with strategic direction. On the scale, "quality and credible performance information" as well as "implementation" both rank within the "attention required" category o the scale. "Clear accountability," "community needs," "capacity," "use of performance information," "communication," and "culture" all rank in the category of "opportunity for improvement." "Leadership" and "alignment with strategic direction" both rank in the category of "acceptable." None of the 10 key attributes rank within the category of "strong" on the scale.
Overall, it was found that some progress has been made towards advancing a results-based culture at AANDC, although it is clear that a cultural shift remains in its infancy. Specific findings for the 10 key attribute areas include:
- Leadership
The foundations for results-based management are currently being built at senior levels as awareness and understanding are strengthened. More and more senior managers wish to see results-based management integrated into day-to-day activities, but said that current tools and meetings could be improved to bring results-based management to the forefront of discussions. This attribute has improved from "opportunity for improvement" to "acceptable" over last year's annual report. - Clear Accountability
In last year's report, this section was known as Roles and Responsibilities. With the refinement of this attribute and its corresponding indicators, the ranking went from "acceptable" to "opportunity for improvement." There is currently a lack of coordination and collaboration between the two performance measurement groups in the Department, and employee and departmental roles were not always clear. Training was considered to be a positive action that could assist in clarifying accountability and provide guidance for people who are less familiar with performance measurement. - Community Needs
The Department is taking strong steps to reduce the reporting burden for recipients by simplifying the reporting structure and reducing the number of ad-hoc reporting required. It was found that AANDC could improve in this area by working more collaboratively with stakeholders when developing performance frameworks and indicators. This attribute has gone from "attention required" in 2010-2011 to "opportunity for improvement" in 2012.
- Alignment with Strategic Direction
The Department has made major headway in aligning its performance measurement and corporate reporting tools. In particular, there has been a strong effort to bring alignment to PM strategies and the Performance Measurement Framework. The report found that aligning the quarterly reports with the Corporate Business Plan could help solidify the link between the Department's strategic goals and day-to-day operations. Ranking for this attribute remains at "acceptable."
- Quality and Credible Performance Information
Quality and credible performance information remains an area that requires attention at AANDC. Multiple lines of evidence confirm that there is a lack of quality performance data and that many indicators lack targets, baselines, and quality sources of data. Cost-effectiveness remains an area with few indicators dedicated to it, making it difficult for the department to report on questions of efficiency and economy. - Implementation
Implementation also remains a key area requiring attention at AANDC. As in previous years, the Department continues to encounter issues with gathering and analysing existing information, accessing information by relevant users, and poor tracking tools. The Department continues to use MS Office as a primary method for collecting information, though it is currently undertaking steps to create and implement IT systems to improve the integrity of their data and make it easier to analyse. - Capacity
The Department currently collects a large amount of information that can be used to assess performance, but lacks the proper human resources to conduct the analysis. As reporting becomes more streamlined, this issue could be easily mitigated. Developing competencies to use performance management tools (e.g. dashboards), develop appropriate indicators and analyze the data collected were among the key training suggestions to improve capacity around performance measurement. This attribute retains its ranking from last year as "opportunity for improvement. - Use of Performance Information
The use of performance information varies widely from program to program, from fully integrating performance information into decision making to programs not wanting to be held responsible for outcome information that they do not control. In many instances, program staff still largely sees reporting as a mechanism for compliance. The ranking for this attribute has improved from "attention required" to "opportunity for improvement," largely due to the strides made by some programs to better integrate performance data into their decision-making process. - Communication
In the Department, communication is used primarily to support accountability rather than promote engagement and collaboration. However, communication must become a means for managers and senior management to stimulate interest and encourage the involvement of those concerned at all levels, working horizontally to break down program silos and promote dialogue in order to achieve strategic objectives. This attribute remains an "opportunity for improvement" for the Department. - Culture
Culture is an overarching theme that encompasses all of the other attributes. Overall, the Department has taken steps to improve its results-based management culture, but much work remains in terms of integrating and using quality performance information. In large part, the Department's culture remains focused on transactions, funding and outputs. A lack of communication remains one of the primary reasons why the Department continues to struggle with program silos, duplication of information and missed opportunities to learn from past mistakes. It further lacks a comprehensive strategy to manage poor performance, and a strong understanding of roles and responsibilities around meeting strategic objectives. As an attribute, culture has improved from "attention required" to "opportunity for improvement."
3.2 Next Steps
In order to address the conclusions identified above, AANDC should consider:
- Improving the coordination between centres responsible for performance measurement and corporate reporting tools to increase the alignment and dissemination of information;
- Working more collaboratively with regional staff and stakeholders when developing performance frameworks and indicators;
- Developing stronger indicators around cost effectiveness and efficiency to respond to the demand for more information in these areas; and
- Establishing standards and targets to measure the 10 attributes for the annual report on the state of performance measurement in collaboration with key internal partners
Appendix A: Evaluation Matrix
| Attributes | Indicators | Data Collection Method | Key Informants | ||||||
|---|---|---|---|---|---|---|---|---|---|
| Document review | Survey | Interview | Senior management (ADM/(R)DG) | Program representatives (Director/Analyst) | TBS | Risk Group | SPPD/EPMRB | ||
|
Leadership Senior levels of an organization are involved and actively support a performance measurement culture |
Extent to which senior management provide clear and consistent direction with regards to managing for results | X | X | X | X | ||||
| % of senior management that can identify actions taken to establish a culture of managing for results | X | X | X | ||||||
| Perception of program managers and staff with regards to the executive level being supportive of managing for results | X | X | X | ||||||
|
Clear accountability Performance measurement roles and responsibilities related to development, implementation and reporting are well articulated and understood at all levels in the Department, including external partners |
% of managers and staff that are satisfied with availability and usefulness of guidance documents, performance measurement presentations and workshops | X | X | X | |||||
| Extent to which managers and staff understand their roles and the roles of their partners (EPMRB, internal & external partners) related to performance measurement and reporting on outcomes | X | X | X | X | |||||
| % of PM strategies that clearly articulate roles and responsibilities of managers and staff | X | ||||||||
|
Community Needs Needs and capacity of the community being served byPM activities are integrated into the process |
% of performance measurement strategies that were developed in engaging with and integrating perspective from regions, partners and service delivery agents | X | X | X | X | ||||
| % of service delivery agents that believe they have the capacity to collect expected data. | X | ||||||||
| Extent to which AANDC performance measurement strategies support community’s information needs | X | X | X | ||||||
| Perception of managers and staff on the collaboration with regions, partners and service delivery agents in the development and implementation of PM strategies | X | X | X | X | |||||
|
Capacity Managers and staff have knowledge, skills and proper training to fulfill PM requirements |
Level of satisfaction of managers and staff (HQ, regions) regarding level of resources dedicated to performance measurement in their sector | X | X | X | X | X | |||
| % of managers and staff that found consistent advice from EPMRB and internal partners (i.e. Strategic Planning and Priorities Directorate, Sustainable Development Directorate) (prompt: perception of managers and staff on the support provided by EPMRB and internal partners) | X | X | X | ||||||
| % of managers and staff (HQ, regions) that think they have appropriate knowledge and skills to fulfill PM requirements | X | X | X | X | |||||
|
Implementation Systems and processes for data collection, storage, monitoring and verification (e.g. databases, software) |
% of programs with PM strategies that have data collection systems by status (in development, fully implemented) | X | |||||||
| % of performance measurement strategies indicators that are in Stage I / Stage II implementation | X | ||||||||
| Extent to which programs are on target with their implementation strategies | X | X | |||||||
|
Quality and credible Performance Information Performance measures have established baselines, clear performance targets, and are easily accessible. There is confidence in the information and data captured through performance measurement activities |
% of indicators that have clearly established baselines and targets | X | X | X | |||||
| Extent to which performance information is supported by reliable sources and information on data quality | X | X | |||||||
| % of indicators that do not have a source of data | X | X | X | ||||||
| % performance measurement strategies include more than one data collection techniques | X | ||||||||
| Extent to which cost-effectiveness (economy/Efficiency) data/indicators are collected | X | X | X | ||||||
| Extent to which performance measurement strategies allow for the identification of the Department’s risks and opportunities for improvement | X | X | X | X | |||||
|
Communication Key performance information is cascaded through the organization and all stakeholders, partners and staff understand its significance and their role in achieving expected results. |
Nature of and effectiveness of communications tools and processes developed and implemented | X | X | X | X | ||||
| Level of internal/external awareness of performance measurement activities, initiatives, successes | X | X | X | X | |||||
|
Alignment with strategic direction Performance measurement is aligned with strategic direction of the Department (alignment with PAA and demonstration of achievement of strategic outcomes) |
% of performance measurement strategies that are clearly linked to the Program Activity Architecture | X | X | X | |||||
| Extent to which indicators that are used for PMF, RPP, DPR, quarterly reports, program business planning and other reporting. | X | X | X | X | X | ||||
|
Use of PM information Performance measurement information and data are used to inform program management, program improvement, planning, decision making, policy development, and reporting |
Extent to which programs surveyed used performance measurement data for program management, program improvement, decision-making, policy development and reporting. | X | X | X | X | ||||
| Extent to which performance information is inclusive of Gender-Based Analysis and Sustainable Development | X | ||||||||
| Extent to which outcomes are reported in DPR/RPP and Quarterly reports | X | ||||||||
|
Culture AANDC collectively values result-based management through proper mechanisms and leadership |
Extent to which senior management is committed to results-based management (see attribute Leadership) | X | X | X | X | X | X | X | |
| Extent to which mechanisms, practices and procedures in place support results-based management | X | X | X | X | X | X | X | ||
| Extent to which the department is able to learn and adapt based on past performance | X | X | X | X | X | X | X | ||
Appendix B: Survey Results
Summary Report - NCR
(Response Rate: 33.8%)
| Response | Percentage |
|---|---|
| Chief Financial Office | 1% |
| Communication Branch | 1% |
| Corporate Secretariat | 2% |
| Education and Social Development Programs and Partnerships | 10% |
| Lands and Economic Development | 16% |
| Northern Affairs Organization | 12% |
| Policy and Strategic Direction | 14% |
| Regional Operations | 7% |
| Resolution and Individual Affairs | 12% |
| Treaties and Aboriginal Government | 25% |
| Other | 2% |
| Response | Percentage |
|---|---|
| Less than 6 months | 2% |
| 6 months to less than 3 years | 23% |
| 3 years to less than 6 years | 29% |
| 6 years to less than 11 years | 17% |
| 11 years and more | 29% |
| Response | Percentage |
|---|---|
| Director/Manager | 29% |
| Analyst/Advisor/Program Officer | 63% |
| Administrative Officer / Support | 1% |
| Other, please specify... | 6% |
| Response | Percentage |
|---|---|
| Yes | 37% |
| No | 63% |
| Response | Percentage |
|---|---|
| Yes | 61% |
| No | 39% |
| Response | Percentage |
|---|---|
| Yes | 45% |
| No | 16% |
| Do not work in a program | 39% |
Culture
| Response | Percentage |
|---|---|
| Strongly Agree | 27% |
| Agree | 62% |
| Disagree | 10% |
| Strongly Disagree | 1% |
| Response | Percentage |
|---|---|
| Longer term planning (strategic, business plan, etc.) | 54% |
| Evaluating the performance of specific initiatives | 42% |
| Performance compliance reporting (i.e.PAA, PMF) | 48% |
Leadership
| Response | Percentage |
|---|---|
| Strongly Agree | 28% |
| Agree | 60% |
| Disagree | 5% |
| Strongly Disagree | 6% |
Capacity
| Response | Percentage |
|---|---|
| Time | 28% |
| Financial Resources | 7% |
| Human Resources | 43% |
| Other, please specify...* | 22% |
| *Note: IM/IT is the most commonly cited. | |
| Response | Percentage |
|---|---|
| Strongly Agree | 23% |
| Agree | 56% |
| Disagree | 19% |
| Strongly Disagree | 2% |
| Response | Percentage |
|---|---|
| Workshops/Training | 55% |
| Guides/Materials | 52% |
| Mentorship | 33% |
| Discussion tables | 27% |
| Other, please specify... | 20% |
| Response | Percentage |
|---|---|
| Indicators | 55% |
| Logic model development | 37% |
| Data collection (e.g. software, Excel, databases) | 42% |
| Analysis | 44% |
| Statistical methods | 28% |
| Performance management tools (e.g. dashboards, scorecards) | 63% |
| Change management | 38% |
| Other, please specify… | 6% |
Accountability
| Response | Percentage |
|---|---|
| Performance appraisals 2 | 68% |
| Performance management program (e.g. performance pay) 4 | 62% |
| Management Accountability Framework (MAF) 3 | 67% |
| Audit and Evaluation reports 1 | 72% |
| Other, please specify... | 15% |
Culture
| Response | Percentage |
|---|---|
| Strongly Agree | 9% |
| Agree | 58% |
| Disagree | 21% |
| Strongly Disagree | 12% |
Implementation
| Response | Percentage |
|---|---|
| Hard copy reporting system | 34% |
| MS Office (i.e. Excel, Word, Access) | 57% |
| Commercial performance management software (e.g. commercial dashboards, scorecards) | 6% |
| Customized/automated dashboards, scorecards (i.e. developed in-house with IM/IT) | 22% |
| Enterprise resource planning (SAP, Oracle, PeopleSoft) | 22% |
| Do not know | 26% |
| Other, please specify... | 11% |
Quality and Credible Performance Information
| Response | Percentage |
|---|---|
| Strongly Agree | 2% |
| Agree | 55% |
| Disagree | 36% |
| Strongly Disagree | 8% |
| Response | Percentage |
|---|---|
| Cost | 30% |
| Complexity | 40% |
| Cultural resistance, fear of change | 27% |
| Lack of concensus, buy-in | 31% |
| Inexperience / lack of understanding | 36% |
| Lack of senior management support | 13% |
| Takes too long to implement / lack of time | 28% |
| Information systems do not support needs | 35% |
| Lack of resources (HR and/or budget) to undertake the work | 47% |
| Lack of alignment with departmental strategic outcomes | 11% |
| Lack of consistency over the years (people responsible) | 43% |
| My branch is not responsible for performance data | 5% |
| Too difficult to obtain the data needed. Why? | 13% |
| Other, please specify... | 14% |
| Response | Percentage |
|---|---|
| Strongly Agree | 6% |
| Agree | 61% |
| Disagree | 27% |
| Strongly Disagree | 6% |
| Response | Percentage |
|---|---|
| Strongly Agree | 11% |
| Agree | 50% |
| Disagree | 32% |
| Strongly Disagree | 7% |
| Response | Percentage |
|---|---|
| Performance information collected and/or reported on does not meet my Branch/Directorates performance information needs | 41% |
| The performance information collected and/or reported on is not linked to a specific goal, desired outcome or objective that is being measured | 32% |
| There is doubt around the reliability of the performance information collected/reported on | 62% |
| Performance information collected and/or reported on is for compliance purposes only | 41% |
| There is a lack of buy-in regarding performance measurement from management | 33% |
| The performance information collected and/or reported on could have a negative impact on my program/Branch/Directorate. | 26% |
Community Needs
| Response | Percentage |
|---|---|
| Strongly Agree | 15% |
| Agree | 41% |
| Disagree | 33% |
| Strongly Disagree | 11% |
Summary Report - Regions
(Response Rate: 36.6%)
| Response | Percentage |
|---|---|
| Alberta | 10% |
| Atlantic | 7% |
| British Columbia | 30% |
| Manitoba | 8% |
| National Capital Region | 0% |
| Nunavut | 3% |
| Northwest Territories | 5% |
| Ontario | 13% |
| Quebec | 8% |
| Saskatchewan | 12% |
| Yukon | 4% |
| Response | Percentage |
|---|---|
| Less than 6 months | 0% |
| 6 months to less than 3 years | 8% |
| 3 years to less than 6 years | 23% |
| 6 years to less than 11 years | 27% |
| 11 years and more | 42% |
| Response | Percentage |
|---|---|
| Director/Manager | 28% |
| Analyst/Advisor/Program Officer | 61% |
| Administrative Officer / Support | 1% |
| Other, please specify... | 10% |
| Response | Percentage |
|---|---|
| Yes | 35% |
| No | 65% |
| Response | Percentage |
|---|---|
| Yes | 69% |
| No | 31% |
| Response | Percentage |
|---|---|
| Yes | 47% |
| No | 31% |
| Do not work in a program | 22% |
Culture
| Response | Percentage |
|---|---|
| Strongly Agree | 22% |
| Agree | 65% |
| Disagree | 11% |
| Strongly Disagree | 2% |
| Response | Percentage |
|---|---|
| Longer term planning (strategic, business plan, etc.) | 54% |
| Evaluating the performance of specific initiatives | 34% |
| Performance compliance reporting (i.e.PAA, PMF) | 29% |
Leadership
| Response | Percentage |
|---|---|
| Strongly Agree | 18% |
| Agree | 66% |
| Disagree | 13% |
| Strongly Disagree | 2% |
Capacity
| Response | Percentage |
|---|---|
| Time | 30% |
| Financial Resources | 5% |
| Human Resources | 49% |
| Other, please specify... | 16% |
| Response | Percentage |
|---|---|
| Strongly Agree | 18% |
| Agree | 61% |
| Disagree | 18% |
| Strongly Disagree | 4% |
| Response | Percentage |
|---|---|
| Workshops/Training | 58% |
| Guides/Materials | 52% |
| Mentorship | 28% |
| Discussion tables | 30% |
| Other, please specify... | 21% |
| Response | Percentage |
|---|---|
| Indicators | 52% |
| Logic model development | 32% |
| Data collection (e.g. software, Excel, databases) | 37% |
| Analysis | 45% |
| Statistical methods | 21% |
| Performance management tools (e.g. dashboards, scorecards) | 66% |
| Change management | 35% |
| Other, please specify... | 7% |
Accountability
| Response | Percentage |
|---|---|
| Performance appraisals | 71% |
| Performance management program (e.g. performance pay) | 59% |
| Management Accountability Framework (MAF) | 60% |
| Audit and Evaluation reports | 63% |
| Other, please specify... | 11% |
Culture
| Response | Percentage |
|---|---|
| Strongly Agree | 7% |
| Agree | 54% |
| Disagree | 33% |
| Strongly Disagree | 6% |
Implementation
| Response | Percentage |
|---|---|
| Hard copy reporting system | 44% |
| MS Office (i.e. Excel, Word, Access) | 59% |
| Commercial performance management software (e.g. commercial dashboards, scorecards) | 6% |
| Customized/automated dashboards, scorecards (i.e. developed in-house withIM/IT) | 22% |
| Enterprise resource planning (SAP, Oracle, PeopleSoft) | 24% |
| Do not know | 25% |
| Other, please specify... | 12% |
Quality and Credible Performance Information
| Response | Percentage |
|---|---|
| Strongly Agree | 3% |
| Agree | 49% |
| Disagree | 42% |
| Strongly Disagree | 6% |
| Response | Percentage |
|---|---|
| Cost | 23% |
| Complexity | 32% |
| Cultural resistance, fear of change | 25% |
| Lack of concensus, buy-in | 27% |
| Inexperience / lack of understanding | 44% |
| Lack of senior management support | 22% |
| Takes too long to implement / lack of time | 29% |
| Information systems do not support needs | 33% |
| Lack of resources (HR and/or budget) to undertake the work | 51% |
| Lack of alignment with departmental strategic outcomes | 18% |
| Lack of consistency over the years (people responsible) | 46% |
| My branch is not responsible for performance data | 3% |
| Too difficult to obtain the data needed. Why? | 14% |
| Other, please specify... | 13% |
| Response | Percentage |
|---|---|
| Strongly Agree | 7% |
| Agree | 50% |
| Disagree | 38% |
| Strongly Disagree | 5% |
| Response | Percentage |
|---|---|
| Strongly Agree | 9% |
| Agree | 54% |
| Disagree | 33% |
| Strongly Disagree | 4% |
| Response | Percentage |
|---|---|
| Performance information collected and/or reported on does not meet my Branch/Directorates performance information needs | 31% |
| The performance information collected and/or reported on is not linked to a specific goal, desired outcome or objective that is being measured | 38% |
| There is doubt around the reliability of the performance information collected/reported on | 53% |
| Performance information collected and/or reported on is for compliance purposes only | 50% |
| There is a lack of buy-in regarding performance measurement from management | 27% |
| The performance information collected and/or reported on could have a negative impact on my program/Branch/Directorate. | 27% |
Community Needs
| Response | Percentage |
|---|---|
| Strongly Agree | 12% |
| Agree | 57% |
| Disagree | 24% |
| Strongly Disagree | 7% |
| Strongly Agree | Agree | Disagree | Strongly Disagree | |
|---|---|---|---|---|
| AANDC regional service delivery agents | 8 (4%) | 95 (52%) | 67 (36%) | 14 (8%) |
| Aboriginal community service delivery agents | 3 (2%) | 51 (29%) | 100 (55%) | 28 (15%) |
| Aboriginal Organizations | 1 (1%) | 53 (30%) | 94 (52%) | 30 (17%) |