Five-Year Plan for Evaluation and Performance Measurement Strategies 2013-14 to 2017-18
PDF Version (395 Kb, 33 Pages)
Table of contents
Executive Summary
This document represents Aboriginal Affairs and Northern Development Canada's Five-year Plan for 2013-14 to 2017-18 for evaluations and performance measurement strategies. The plan adheres to guidance provided by the Treasury Board of Canada Secretariat. It aligns with and supports the departmental Management, Resources and Results Structure and no longer references authorities; ensures the evaluation of direct program spending on a five-year cycle; and implements a risk-based approach for determining the calibration of effort for evaluations.
The number of evaluations has increased from 48 to 58 for three reasons: First, new this year, the forecast spending for salary and operation and maintenance was included in addition to grants and contributions to capture all direct program spending. The inclusion of direct spending has increased the number of activities and amount of spending to be covered by the Plan. Second, the Chart of Accounts was used to examine sub-sub-sub activities and resulted in the division of some cluster evaluations into more manageable groupings of related activities. Third, two evaluations of internal services were added to explore areas deemed high risk in the Corporate Risk Profile.
The Plan was presented to the Directors General Internal Operations Committee and reflects input received from senior management and internal services representatives. There are a total of 58 evaluations scheduled between 2013-14 and 2017-18. Fifty percent of evaluations have a performance measurement strategy in place, which is expected to reduce the level of effort required for these evaluations.
There are 12 new evaluations scheduled for 2013-14 and nine carry-overs from 2012-13. A calibration of the level of effort was conducted for new evaluations scheduled for 2013-14. The analysis of materiality, risk and complexity revealed a high risk portfolio of evaluations for year 1 of the Plan.
1. Introduction
This document outlines a plan for evaluating 100 percent of direct program spending over the next five years at Aboriginal Affairs and Northern Development Canada (AANDC) and the development of performance measurement strategies.
1.1 Purpose of the Evaluation Plan
The primary purpose of the plan is to help the Deputy Head ensure that credible, timely and neutral information on the ongoing relevance and performance of direct program spending is available to support evidence-based decision making on policy, expenditure management and program improvement. The Plan also:
- Provides an opportunity to align evaluations with information needs of the Department and the information needs of others (e.g. central agencies) as articulated in the Policy on Evaluation;
- Helps ensure that evaluations supporting program redesign are planned and completed in advance of program renewal;
- Provides an annual platform for program managers and heads of evaluation to discuss the development and implementation of performance measurement strategies that effectively support evaluations;
- Allows departmental units responsible for the development of the Report on Plans and Priorities and the Departmental Performance Reports, as well as other groups engaged in strategic planning and reporting activities, to identify when evaluations will be available to inform their work;
- Initiates regular communication and consensus building on evaluation needs and priorities across the Department; and
- Provides central agencies with advanced notice of when evaluations will be available to inform their work (e.g. in support of Memoranda to Cabinet, Treasury Board submissions, strategic reviews).
Moreover, the Plan serves as a management tool for the Head of Evaluation by enabling workflow and human resources planning for the coming years.
1.2 Drivers for Evaluation Planning
In the Government of Canada, evaluation is defined as the systematic collection and analysis of evidence on the outcomes of programs to make judgments about their relevance and performance, and to examine alternative ways to deliver them or to achieve the same results. Evaluation serves to help establish whether or not a program contributed to observed results and to what extent. It also provides an in-depth understanding of why program outcomes were, or were not, achieved.
The Government of Canada adopted the first Evaluation Policy in 1977 to inform expenditure management and/or program decision making. A renewed policy, standard and directive introduced in 2009, requires the evaluation of all ongoing grants and contributions (G&C) programs every five years and clarifies the management responsibilities and accountabilities of ministers and deputy heads.
Updates to the 2009 Treasury Board Secretariat Policy on Evaluation came into effect April 1, 2012. The Policy states:
3.2 Evaluation provides Canadians, parliamentarians, ministers, central agencies and deputy heads an evidence-based, neutral assessment of the value for money, i.e. relevance and performance, of federal government programs. Evaluation:
- Supports accountability to Parliament and Canadians by helping the Government to credibly report on the results achieved with resources invested in programs;
- Informs government decisions on resource allocation and reallocation by:
- Supporting strategic reviews of existing program spending, to help ministers understand the ongoing relevance and performance of existing programs, and
- Providing objective information to help ministers understand how new spending proposals fit with existing programs, identify synergies and avoid wasteful duplication;
- Supports deputy heads in managing for results by informing them about whether their programs are producing the outcomes that they were designed to produce, at an affordable cost; and
- Supports policy and program improvements by helping to identify lessons learned and best practices.
In accordance with Section 6.1.7 of the Policy on Evaluation, this Plan aligns with and supports the departmental Management, Resources and Results Structures (MRRS), which is the framework for the systematic collection and analysis of performance information. It also ensures the evaluation of all ongoing G&C programs every five years, as required by Section 42.1 of the Financial Administration Act. In compliance with Section 6.1.3 of the Directive on the Evaluation Function, this Plan identifies a risked-based approach for determining methodologies, the level of effort and the appropriate level of resources required to conduct each evaluation.
1.3 Departmental Context
AANDC Mandate
The vision of AANDC is a future in which First Nations, Inuit, Métis and northern communities are healthy, safe, self-sufficient and prosperous - a Canada where people make their own decisions, manage their own affairs and make strong contributions to the country as a whole.
To this end, the Department supports Aboriginal peoples (First Nations, Inuit and Métis) and Northerners in their efforts to:
- improve social well–being and economic prosperity;
- develop healthier, more sustainable communities; and
- participate more fully in Canada's political, social and economic development — to the benefit of all Canadians.
AANDC is the federal department primarily responsible for meeting the Government of Canada's obligations and commitments to First Nations, Inuit and Métis, and for fulfilling the federal government's constitutional responsibilities in the North. The Department's overall mandate and wide–ranging responsibilities are shaped by centuries of history, and unique demographic and geographic challenges. It derives from the Canadian Constitution, the Indian Act, the Department of Indian Affairs and Northern Development Act, territorial acts, treaties, comprehensive claims and self–government agreements as well as various other statutes affecting Aboriginal people and the North.
The Indian and Inuit Affairs mandate derives from the Indian Act and its amendments over the years, from specific statutes enabling modern treaties, such as the Nisga'a Final Agreement Act or the Labrador Inuit Land Claims Agreement Act, and from more recently enacted statutes such as the First Nations Fiscal and Statistical Management Act and the First Nations Jurisdiction Over Education in British Columbia Act, designed to provide First Nations with jurisdictional powers beyond the Indian Act. A significant amount of the Department's mandate is derived from policy decisions and program practices that have developed over the years; it is framed by judicial decisions with direct policy implications for the Department; and it is structured by funding arrangements or formal agreements with First Nations and/or provincial or territorial governments.
The Northern Development mandate derives from the Department of Indian Affairs and Northern Development Act; from statutes enacting modern treaties north of 60°, such as the Nunavut Land Claims Agreement Act, or; self‑government agreements, such as the Yukon First Nations Self-Government Act, and; from statutes dealing with environmental or resource management, and; is framed by statutes that enact the devolution of services and responsibilities from AANDC to territorial governments, such as the Canada‑Yukon Oil and Gas Accord Implementation Act.
Most of the Department's programs, representing a majority of its spending, are delivered through partnerships with Aboriginal communities and federal–provincial or federal–territorial agreements. AANDC also works with urban Aboriginal people, Métis and non–status Indians (many of whom live in rural areas) through the Office of the Federal Interlocutor. AANDC is one of 34 federal departments and agencies delivering Aboriginal and northern programs and services.
Program Alignment Architecture
AANDC's broad mandate is demonstrated by the Program Alignment Architecture (PAA), which supports four strategic outcomes (SO):
- The Government - Good governance and co–operative relationships for First Nations, Inuit and Northerners.
- The People - Individual, family and community well–being for First Nations and Inuit.
- The Land and Economy - Full participation of First Nations, Inuit and Métis individuals and communities in the economy.
- The North - Self–reliance, prosperity and well–being for the people and communities of the North.
Appendix A provides a more detailed breakdown of the PAA.
Transfer Payment Programs
According to the 2011-12 Public Accounts of Canada, AANDC is the fifth largest in terms of total ministerial net expenditures (behind Finance, Human Resources and Skills Development Canada (HRSDC), National Defence and Public Safety), and third largest in terms of total transfer payments/G&C (behind Finance and HRSDC). In 2011-12, AANDC's total net expenditures were $7,907,783 and total transfer payments were $6,453,906 [Note 1]. The requirement for direct program spending to be evaluated every five years represents a significant volume of work for the Department.
Planned Expenditures for Fiscal Year 2013-14
| Strategic Outcomes | 2013-14 Forecast Spending |
|---|---|
| The Government | 1,566,776,807 |
| The People | 4,100,976,084 |
| The Land and Economy | 1,569,033,352 |
| The North | 409,803,308 |
| Internal Services | 258,381,011 |
| AANDC Total | $7,904,970,562 |
Source: Based on Main Estimates. Includes salary, operation and maintenance, capital, statutory and grants and contributions. |
|
2. Planning Methodology
Section 6.2.3 of the Directive on the Evaluation Function states that the Head of Evaluation is responsible for developing and annually updating a rolling five-year evaluation plan. Accordingly, at AANDC, the Evaluation Plan was developed by the Evaluation, Performance Measurement and Review Branch (EPMRB), which is part of the Audit and Evaluation Sector. The approach for the creation of the 2013-14 Plan was as follows:
Define the evaluation universe and scoping
The evaluation universe shows the how each component of the MRRS is to be evaluated and ultimately, how the Plan will achieve full coverage of the MRRS. The evaluation universe also shows the breakdown of forecast spending covered in each evaluation.
The evaluation universe for the 2013-14 Plan no longer uses transfer payment authorities to define the scope of evaluations. Instead, the Chart of Accounts was referenced to identify program activities under sub-sub-activities that could be examined as part of a single evaluation. As a result, a few large evaluations have been split into smaller projects. For example, the evaluation of "Activation of Community Assets" from last year's Plan has been split into five smaller evaluations to better accommodate the variety of unrelated activities contained under this sub-activity.
With the restructuring of the Plan using the MRRS instead of the authorities, some gaps in coverage have emerged. It would appear that evaluations have never been conducted for Northern Governance, Northern Land and Environmental Management and Indian Oil and Gas Canada. Another program that has never been evaluated is the Strategic Partnership Initiative, but this is because it is a new program introduced in 2009. Together these programs represent two percent of total forecast spending for 2013-14. This means that over 98 percent of total forecast spending for 2013-14 has been previously evaluated.
Conduct a risk assessment of units of evaluation
EPMRB has adopted the Audit and Assurance Services Branch (AASB) risk ranking to inform the level of effort and allocation of resources for evaluations. Each year, AASB develops risk rankings for auditable units in the Department. The process followed involves extensive review of corporate documents, workshops and consultations with program representatives and external stakeholders and is an essential component for the preparation of the Risk‑Based Audit Plan.
The AASB risk approach is consistent with guidance from the Office of the Comptroller General, is thorough, and in many cases, the audit and evaluation units are the same. Risk considerations include impact of identified risks on the achievement of departmental outcomes, materiality, scope, potential for public scrutiny, legal risk, prevalence of risk, and the severity of consequences.
The risk rankings can be seen in the Plan and are colour coded to reflect the five levels of risk identified in the Risk-Based Audit Plan. The five levels are defined as follows:
- Very High Risk – The auditable entity is inherently exposed to multiple risks that are expected to remain or get worse over time. Business conditions contain considerable risk factors. If one or more risks were to materialize, consequences would be severe and could include permanent or long-term damage to AANDC's ability to achieve its objectives. Consequences would be felt by the majority of stakeholders, both internally and externally to AANDC.
- High Risk - The auditable entity is inherently exposed to many risks that are expected to remain over time. Business conditions contain many risk factors. If one or more risks were to materialize, consequences would be significant and could be endured by AANDC with significant management attention. Some AANDC activities could be subject to significant review or changed ways of operation. Consequences would be felt by many stakeholders.
- Moderate Risk - The auditable entity is inherently exposed to several risks that are expected to remain over time. Business conditions contain some risk factors. If one or more risks were to materialize, consequences would be moderate and could be managed with a minor level of management attention. Consequences would be felt by a sub-set of stakeholders.
- Low Risk - The auditable entity is exposed to a few risks that may diminish over time. Business conditions contain a few risk factors. If one or more risks were to materialize, consequences would be minor and could be absorbed through normal activity. Consequences would be isolated.
- Very Low Risk - The auditable entity is inherently exposed to few or no risks. Business conditions contain few or no risk factors. If one or more risks were to occur, the consequences would be negligible and could be absorbed through normal activity.
Create the Plan
The 2013-14 Plan builds upon the previous year's plan. As discussed above, the units of evaluation were aligned with the MRRS and forecast direct program spending was added. Deadlines for evaluations were calculated to ensure that an evaluation was scheduled to take place within five years from the date of the previous one.
Planned audits have been added to the Plan to inform the calibration of effort for an evaluation, allow for integration of audit findings, and promote better coordination with programs. Audits generally reveal a considerable amount about the design and management of programs and give early indications on the achievement of program outcomes. Audits scheduled in advance of an evaluation can impact the scope and level of effort needed for an evaluation.
Recent audits are also valuable sources of information for evaluation as they inform the analysis of program design and provide analysis of efficiency and economy. Ideally, audits and evaluations will be scheduled in different years, however, where audits and evaluations are scheduled to occur in the same year, it was agreed with AASB that audit work will be conducted early in the fiscal year, so that programs are not overburdened with requests for information.
In this Plan, 58 evaluations are scheduled between 2013-14 and 2017-18. The table below shows the distribution of evaluations for the five years covered by the plan.
Distribution of Evaluations by Strategic Outcome and by Year
| Year | Government | People | Land and Economy | North | Internal Services | TOTAL |
|---|---|---|---|---|---|---|
| Carry over from 2012/13 |
5 | 1 | 2 | 1 | 0 | 9 |
| 2013/14 | 3 | 1 | 6 | 1 | 1 | 12 |
| 2014/15 | 4 | 1 | 3 | 3 | 1 | 12 |
| 2015/16 | 2 | 1 | 4 | 2 | 0 | 9 |
| 2016/17 | 0 | 3 | 2 | 2 | 0 | 7 |
| 2017/18 | 1 | 6 | 0 | 2 | 0 | 9 |
| TOTAL | 15 | 13 | 17 | 11 | 2 | 58 |
Currently, 29 of the 58 planned evaluations (50 percent) have a performance measurement strategy in place.
Consultation with Senior Management
A draft Plan was presented to the Directors General Internal Operations Committee to collect feedback on the scope and timing of evaluations. Options for integrating Internal Services into the Plan were also presented. A series of subsequent meetings were scheduled with Directors and Directors General of Internal Services and Land and Economic Development (LED) Sector to further define scope and timing of evaluations. As a result of these discussions, two evaluations of Internal Services were added to the Plan and the evaluation of Activation of Community Assets from last year's plan was split into five separate evaluations.
Coverage
Total forecast direct program spending for 2013-14 is $7,904,970,562. Total forecast direct program spending covered by this Plan is $6,983,598,799. In summary, this Plan covers 88 percent of total forecast direct program spending. Not covered by this Plan is the Residential Schools Resolution, which accounts for almost nine percent of total forecast direct program spending. This will not be evaluated because an assessment revealed that it is closely monitored through regular reporting to the court and Treasury Board. The Management of Other Negotiated Settlements and Aboriginal Women's Issues, not covered in this Plan, will be integrated into evaluations in the next Plan. Finally, most internal services, which account for another three percent, are also not identified for evaluation. This Plan only incorporates those internal services deemed high risk in the Corporate Risk Profile. Annual coverage of total forecast direct spending for 2013-14 is detailed below:
Annual Coverage of Total Forecast Direct Program Spending for 2013-14
| Coverage of Direct Spending | ||
|---|---|---|
| Amount in dollars | Amount by percentage |
|
| Total forecast direct spending | $7,904,970,562 | 100% |
| Coverage by year: | ||
| Year 1 | 1,483,683,557 | 19% |
| Year 2 | 1,530,510,108 | 19% |
| Year 3 | 219,477,208 | 3% |
| Year 4 | 1,132,906,241 | 14% |
| Year 5 | 2,617,021,685 | 33% |
| Total forecast spending covered by the 2013-14 Plan |
$6,983,598,799 | 88% |
| Not covered by this Plan: | ||
| Residential Schools Resolution | 696,037,893 | 9% |
| Management of Other Negotiated Settlements | 890,000 | |
| Aboriginal Women's Issues | 461,822 | |
| Internal Services | 213,542,075 | 3% |
Calibration of Level of Effort
Section 6.2.1, sub-section c, of the Standard on Evaluation for the Government of Canada gives departments the flexibility to calibrate the nature and depth of each evaluation undertaken in relation to the risks associated with the program and the information needs of the Deputy Head.
An analysis of the 12 evaluations to be started in 2013-14 was undertaken to determine the level of effort required for each evaluation and better align available resources. Four considerations went into the calibration exercise:
- Materiality – A score of 3 was assigned to evaluations of programs with annual G&C spending over $500 million; 2 was for spending between $100 and $500 million; and 1 was assigned to evaluations covering less than $100 million.
- Risk – A score of 4 was assigned to evaluation units with a risk ranking of "very high"; 3 for "high", 2 for "moderate" and 1 for "low"
- Complexity – The scores for complexity were guided by the number of delivery partners, coverage, governance structure, number of delivery mechanisms and number of objectives:
High (score=3) Medium (score=2) Low (score=1) Large number of external delivery partners or delivery through the regions, broad coverage, complex governance structure, multiple delivery structures for multiple objectives Small number of delivery partners (ie. regions), targeted to a few groups with slightly different characteristics, multiple layers of governance, one delivery structure Delivery out of Headquarters or one single entity, targeted to one group, simple governance structure, one objective - Performance Measurement – The availability of performance measurement data will reduce the level of effort required to complete an evaluation, so evaluations with a performance measurement strategy place for three or more years was given a score of 0. A score of 1 signifies a new performance measurement strategy has been in place for one to two years. A score of 2 means no performance measurement strategy exists and thus, greater effort will be required to complete the evaluation. It is important to note that the above scoring assumes that performance measurement strategies in place have robust indicators of success and have been fully implemented.
Overall, the scoring for the four areas defined above will permit a maximum score of 12. Evaluations with a score of 9 or more will likely require more resources to complete. Results of the calibration exercise are as follows:
| Planned Evaluations for 2013-14 | Materiality | Risk | Complexity | Performance Measurement |
Total |
|---|---|---|---|---|---|
| Resource/Capacity Development for First Nations Governments, Associations and Organizations |
1 | 3 | 3 | 1 | 8 |
| Negotiation of Special Claims | N/A | N/A | 3 | 3 | N/A |
| Process for Implementing Comprehensive Land Claims and Self-Government Agreements | 2 | 4 | 3 | 3 | 12 |
| Enhanced Prevention Focused Approach for the First Nations Child and Family Services Program in Manitoba | 3 | 4 | 1 | 0 | 8 |
| Access to Capital and Business Services | 1 | 4 | 3 | 2 | 10 |
| Investment in Economic opportunities | 2 | 4 | 3 | 2 | 11 |
| Aboriginal Economic Development Framework and Strategic Partnerships Initiative | 1 | N/A | 3 | 0 | N/A |
| Environmental Sustainability and Contaminated Sites on Reserve | 1 | N/A | 1 | 2 | N/A |
| First Nations Infrastructure Fund | 0 | 2 | 1 | 0 | 3 |
| Urban Aboriginal Strategy | 1 | 2 | 3 | 2 | 8 |
| Northern Contaminated Sites | 1 | 3 | 1 | 0 | 4 |
| Information for Decision Making | 1 | 3 | 1 | 2 | 7 |
A risk ranking was not available for three of the twelve evaluations scheduled for 2013-14 because AASB only develops risk rankings for auditable units. In addition, forecast spending was not available for one evaluation scheduled for 2013-14. As a result, a ranking could not be calculated for three of the twelve evaluations scheduled for 2013-14. Of the remaining nine evaluations, three have a score over 9 and another four received a score of 8, which is still significant. In the end, it would appear that seven of the twelve evaluations would require a high level effort. A closer look at the design, delivery and availability of performance information is needed to better define the resources required.
3. 2013-14 to 2017-18 AANDC Plan for Evaluation and Performance Measurement Strategies
| Planned Evaluation | MRRS Level |
MRRS ID |
Last Evaluation | Total Forecast Spending for 2013-14 Covered by the Evaluation |
*Deadline for Evaluation | Calibration Considerations | |||
|---|---|---|---|---|---|---|---|---|---|
| Planned Audit | *Risk Ranking |
PM Strategy In Place (Y/N) |
|||||||
| YEAR 1: 2013-14 | |||||||||
| THE GOVERNMENT | SO | 1 | |||||||
| 1 | Resource/Capacity Development for First Nations Governments, Associations and Organizations | SA | 1.1.1 | Basic Organizational Capacity evaluated 09/10, Summative Evaluation of Consultation and Policy Development and Basic Organizational Capacity Funding 08/09, Implementation of the First Nations Fiscal and Statistical Management Act 11/12, Evaluation of the Inuit Art Foundation 11/12 | $61,938,507 | 2013/14 | Follow-up Audit of Capacity Development (2013/14) | H | Y |
| SSA | 1.1.2.3 | ||||||||
| 2 | CARRY OVER Process for Negotiating Comprehensive Land Claims and Self Government Agreements |
SA | 1.2.1 | Impact Evaluation of Comprehensive Land Claim Agreements 08/09 | $87,367,576 | 2013/14 | Audit of Negotiation of Comprehensive Land Claims and Self-Government Agreements 2013/14 | VH | Y |
| 3 | Negotiation of Special Claims | SA | 1.2.2 | N | |||||
| 4 | CARRY OVER Consultation and Accommodation Program | SA | 1.2.4 | Summative Evaluation of Consultation and Policy Development and Basic Organizational Capacity Funding 08/09 | $5,559,445 | 2013/14 | Y | ||
| 5 | CARRY OVER Consultation and Policy Development Authority | $11,426,128 | |||||||
| 6 | CARRY OVER Evaluation of the Federal Interlocutor's Bilateral and Tripartite Processes and the Powley Initiative | SA | 1.2.5 | Federal Interlocutor's Contribution Program and Powley: Management of Métis Aboriginal Rights evaluated in 07/08 | $19,063,415 | 2012/13 | N | ||
| 7 | CARRY OVER Impacts of Comprehensive Land Claims Agreements and Self-Government Agreements | SA | 1.3.1 | Comprehensive Land Claims evaluated in 08/09 | $401,346,850 | 2013/14 | Audit of Negotiation of Comprehensive Land Claims and Self-Government Agreements 2013/14 | VH | Y |
| 8 | Process for Implementing Comprehensive Land Claims and Self-Government Agreements. | SA | 1.3.1 | Comprehensive Land Claims evaluated in 08/09 | 2013/14 | Audit of Negotiation of Comprehensive Land Claims and Self-Government Agreements 2013/14 | VH | Y | |
| THE PEOPLE | SO | 2 | |||||||
| 9 | CARRY OVER Enhanced Prevention Focused Approach for the First Nations Child and Family Services Program in Quebec and Prince Edward Island | SA | 2.2.4 | Enhanced Prevention Focused Approach for the First Nations Child and Family Services Program in Nova Scotia and Saskatchewan to be completed in 12/13. Child and Family Services evaluated in 07/08 | $89,001,200 | 2013/14 | 2012/13 - Implementation of CFS Prevention Focused Approach | VH | N |
| 10 | Enhanced Prevention Focused Approach for the First Nations Child and Family Services Program in Manitoba | SA | 2.2.4 | $131,967,688 | N | ||||
| LAND AND THE ECONOMY | SO | 3 | |||||||
| 11 | Access to Capital and Business Services | SSA | 3.1.1.1 | INAC's Aboriginal Economic Development Programs evaluated in 08/09 | $48,155,517 | 2013/14 | 2013/14 - Audit of Economic Development Programs (LED) | VH | N |
| 12 | CARRY OVER Procurement Strategy for Aboriginal Business | SSA | 3.1.1.2 | Procurement Strategy for Aboriginal Business evaluated in 08/09 | $2,043,291 | 2013/14 | N | ||
| 13 | Investment in Economic Opportunities | SA SSA |
3.1.2 3.1.2.1 |
INAC's Aboriginal Economic Development Programs evaluated in 08/09 | $109,465,563 | 2013/14 | 2013/14 - Audit of Economic Development Programs (LED) | VH | N |
| 14 | The Aboriginal Economic Development Framework and Strategic Partnerships Initiative | SA | 3.1.3 | No previous evaluation - New program | $25,207,471 | 2013-14 | Y | ||
| 15 | Environmental Sustainability and Contaminated Sites on Reserve | SA SSA SSA |
3.2.4 3.2.4.1 3.2.4.2 |
Contaminated Sites evaluated 08/09 Implementation Evaluation of the Reserve Land and Environment Management Program 09/10 |
$26,558,157 | 2013/14 | VH | Y | |
| 16 | CARRY OVER First Nations Water and Wastewater Infrastructure | SA | 3.3.1 | First Nations Water Management Strategy evaluated in 2007-08 | $328,586,032 | 2012/13 | 2012/13 Audit of Water and Wastewater Infrastructure, 2014/15 | VH | Y |
| 17 | First Nations Infrastructure Fund | SA | 3.3.4 | Implementation Evaluation of the First Nations Infrastructure Fund completed in 09/10 | $103,093 | 2014/15 | 2014/15 On-Reserve Infrastructure | M | Y |
| 18 | Urban Aboriginal Strategy | PA | 3.4 | Impact Evaluation of the Urban Aboriginal Strategy 11/12 | $41,033,701 | 2016/17 | M | N | |
| THE NORTH | SO | 4 | |||||||
| 19 | CARRY OVER Northern Nutrition Contribution (Implementation Evaluation) | SA | 4.1.2 | Food Mail evaluated in 08/09 | $57,152,873 | 2013/14 | 2013/14 Audit of Nutrition North | H | Y |
| 20 | Northern Contaminated Sites | SA | 4.3.3 | Contaminated Sites last evaluated 08/09 | $11,257,145 | 2013/14 | 2014/15 Audit of Northern Contaminated Sites | VH | Y |
| INTERNAL SERVICES | |||||||||
| 21 | Information for Decision Making | No previous evaluation | $26,449,905 | H | N | ||||
| Year 2: 2014-15 | |||||||||
| THE GOVERNMENT | SO | 1 | |||||||
| 22 | Support for First Nations Governments | SA | 1.1.1 | lndian Government Support evaluated 09/10. | $383,720,754 | 2014/15 | N | ||
| 23 | Impact of Self-Government Agreements | SA | 1.3.1 | Federal Government's Implementation of Self-Government and Self Government Agreements evaluated in 10/11 | $302,392,014 | 2015/16 | 2013/14 Audit of Negotiation of Comprehensive Land Claims and Self-Government Agreements | VH | Y |
| 24 | Treaty Related Measures | SA | 1.2.1 | BC Treaty Related Measures evaluated in 09/10 | $12,500,000 | 2014/15 | Y | ||
| 25 | Treaty Commissions | SA | 1.3.2 | Treaty Commissions evaluated in 09/10 | $3,138,528 | 2014/15 | Y | ||
| THE PEOPLE | |||||||||
| 26 | National Aboriginal Achievement Foundation | N/A | N/A | National Aboriginal Achievement Foundation last evaluated 09/10 | $817,000 | 2014/15 | Y | ||
| LAND AND THE ECONOMY | SO | 3 | |||||||
| 27 | First Nations Land Management | SSA | 3.1.2.5 | No previous evaluation | $34,201,543 | Y | |||
| 28 | Emergency Management Assistance for Activities On Reserve | SSA | 3.2.4.3 | Emergency Management Assistance for Activities On Reserve last evaluated 09/10 | $11,869,707 | 2014/15 | 2012/13 Audit of Emergency Management Assistance | N | |
| 29 | Education and Community Infrastructure | SA SA SA |
3.3.2 3.3.4 |
Capital Facilities and Maintenance evaluated in 09/10 | $743,260,057 | 2014/15 | 2014/15 Audit of On-Reserve Infrastructure (Excluding Water, wastewater and Housing) | H | Y |
| THE NORTH | SO | 4 | |||||||
| 30 | NWT Devolution | SA | 4.1.1 | No previous evaluation | $7,820,090 | N | |||
| 31 | Northern Governance – Support for Territorial Relations and Northern Organizations | SA | 4.1.1 | $12,401,384 | N | ||||
| 32 | Northern Nutrition Contribution (Impact Evaluation) | SA | 4.1.2 | Implementation Evaluation of Northern Nutrition Contribution to be completed in 13/14. Food Mail evaluated in 08/09 | 2013/14 | 2013/14 Audit of Nutrition North | H | Y | |
| INTERNAL SERVICES | |||||||||
| 33 | Recruitment, Development and Retention | No previous evaluation | $18,389,031 | H | N | ||||
| Year 3: 2015-16 | |||||||||
| THE GOVERNMENT | SO | 1 | |||||||
| 34 | Miawpukek Grant Agreement | SA | 1.1.1 | Miawpukek Grant Agreement last evaluated 10/11 | $10,220,400 | N | |||
| 35 | Inuit Relations Secretariat and Inuit Counseling in the South | SA | 1.2.3 | Inuit Counselling in the South evaluated in 10/11 | $1,744,054 | 2015/16 | L | N | |
| THE PEOPLE | SO | 2 | |||||||
| 36 | Registration Administration | SA | 2.3.1 | Last evaluated in September 2010 | $22,264,269 | 2015/16 | 2014/15 Audit of the Indian Registry System | VH | N |
| LAND AND THE ECONOMY | SO | 3 | |||||||
| 37 | Land Management | SSA | 3.1.2.2 | Impact Evaluation of Contributions to Indian Bands for Land Management on Reserve completed in 2010-11. | $31,133,724 | 2015/16 | N | ||
| SA | 3.2.1 | 2013-14 Audit of Additions to Reserve | H | ||||||
| SA | 3.2.2 | 2012/13 Audit of Lands Management (including Lands Registry System) | H | ||||||
| SA | 3.2.3 | M | |||||||
| 38 | Housing | SA | 3.3.3 | Evaluation of INAC's On-Reserve Housing Support 10/11 | $145,501,374 | 2015/16 | 2012/13 Audit of Housing Certification and Ministerial Loan Guarantee process, 2014/15 | VH | Y |
| 39 | EcoENERGY for Aboriginal and Northern Communities | 3.3.5 | EcoEnergy for Aboriginal and Northern Communities evaluated in 10/11 | $3,814,246 | 2015/16 | L | Y | ||
| 40 | EcoENERGY for Aboriginal and Northern Communities – AANDC Component | L | Y | ||||||
| THE NORTH | SO | 4 | |||||||
| 41 | AANDC's Climate Change Adaptation Program - Assist Northerners in Assessing Key Vulnerabilities and Opportunities | SA | 4.1.3 | INAC's Climate Change Adaptation Program evaluated in 2011-12 | $4,799,141 | 2016/17 | L | Y | |
| 42 | AANDC's Climate Change Adaptation Program - Assist Northerners in Assessing Key Vulnerabilities and Opportunities -AANDC Component | L | Y | ||||||
| Year 4: 2016-17 | |||||||||
| LAND AND THE ECONOMY | SO | 3 | |||||||
| 43 | Indian Oil and Gas Canada | SSA | 3.1.2.3 | No previous evaluation | $13,322,680 | 2014/15 Audit of Southern and Northern Oil and Gas | H | N | |
| 44 | Legislation to Facilitate Economic Development | SSA | 3.1.2.4 | No previous evaluation | $4,500,874 | 2015/16 | N | ||
| SSA | 3.1.2.6 | First Nations Oil and Gas and Moneys Management Act last evaluated 10/11 | N | ||||||
| THE PEOPLE | SO | 2 | |||||||
| 45 | Income Assistance, National Child Benefit Reinvestment and Assisted Living | SA | 2.2.1 | Income Assistance, National Child Benefit Reinvestment and Assisted Living evaluated in 08/09 | $952,300,825 | 2013/14 | 2012/13 Audit of Income Assistance | VH | Y |
| SA | 2.2.2 | M | |||||||
| SA | 2.2.3 | M | |||||||
| 46 | Other Social Services | SA | 2.2.4 | $32,075,716 | 2017/18 | Y | |||
| 47 | Family Violence Prevention | SA | 2.2.5 | Evaluation of the Family Violence Prevention program 11/12. | $18,600,508 | 2016/17 | M | Y | |
| THE NORTH | SO | 4 | |||||||
| 48 | Northern Hospital and Physician Services | SA | 4.1.1 | $51,231,000 | 2017/18 | N | |||
| 49 | Northern Land, Resources and Environmental Management | SA SA SA |
4.3.1 4.3.2 4.3.4 |
$60,874,638 | 2014/15 | N | |||
| Year 5: 2017-18 | |||||||||
| THE GOVERNMENT | SO | 1 | |||||||
| 50 | Specific Claims Action Plan (Summative Evaluation) | SA | 1.2.2 | Formative Evaluation of the Specific Claims Action Plan 11/12 | $266,287,136 | 2017-18 | 2012/13 Audit of AANDC Support to Specific Claims | H | N |
| THE PEOPLE | SO | 2 | |||||||
| 51 | Elementary and Secondary Education | SA | 2.1.1 | Elementary and Secondary Education evaluated in 2012-13. First Nations and Inuit Youth Employment Strategy last evaluated by HRSDC 09/10 | $1,425,165,949 | 2017-18 | 2013/14 Audit of Elementary and Secondary Schools | VH | Y |
| 52 | Post-Secondary Education | SA | 2.1.2 | Post-secondary Education evaluated in 2012-13. | $335,166,596 | 2017-18 | 2012/13 Follow-up audit of Post Secondary Education | H | Y |
| 53 | Enhanced Prevention Focused Approach for the First Nations Child and Family Services Program | SA | 2.2.4 | Enhanced Prevention Focused Approach for the First Nations Child and Family Services Program in Nova Scotia and Saskatchewan completed in 2012-13. Child and Family Services evaluated in 07/08 | $390,572,143 | 2017-18 | 2012/13 - Implementation of CFS Prevention Focused Approach | VH | Y |
| 54 | Band Moneys (including suspense accounts) | SA | 2.3.2 | Indian Moneys, Estates and Treaty Annuities evaluated in 2012-13. Evaluation of First Nations Oil and Gas Moneys Management Act Implementation completed in 10/11. | $132,110 | 2017-18 | 2013/14 Audit of the Management of Moneys | N | |
| 55 | Estates | SA | 2.3.3 | $3,674,170 | N | ||||
| 56 | Treaty Annuities | SA | 2.3.4 | $2,276,195 | L | N | |||
| THE NORTH | SO | 4 | |||||||
| 57 | Northern Science and Technology | SA | 4.2.1 | Northern Contaminants Program/Northern Scientific Training Program evaluated in 2012-13. | $5,901,936 | 2017-18 | L | N | |
| 58 | Federal Contaminated Sites Action Plan | SSA | 4.3.3 | Contaminated Sites last evaluated 08/09 | $187,845,450 | 2017-18 | 2014/15 Audit of Northern Contaminated Sites | VH | N |
| $6,983,598,799 | |||||||||
* Evaluations that do not have a coloured risk ranking were not identified as an auditable unit and were thus not ranked by the Audit and Assurance Services Branch.
Appendix A: AANDC Program Alignment Architecture
Description of Appendix A: AANDC Program Alignment Architecture
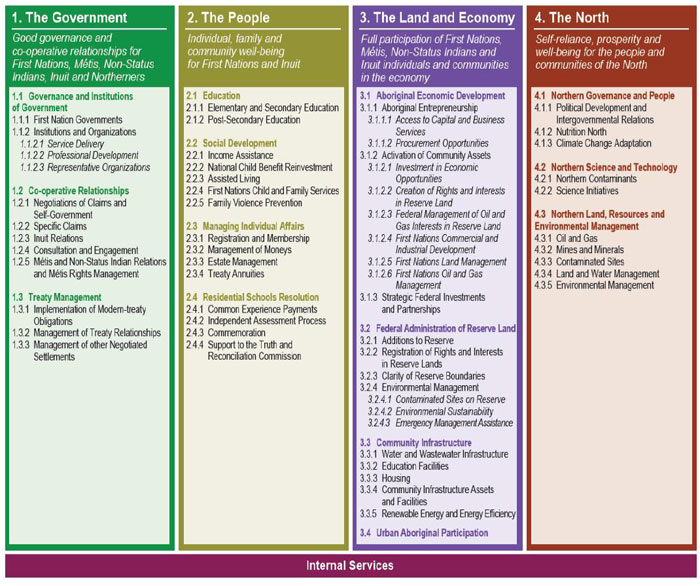
Aboriginal Affairs and Northern Development Canada - 2013-2014 Program Alignment Architecture (PPA)
This image is the Program Alignment Architecture of Aboriginal Affairs and Northern Development Canada (AANDC) for 2013-2014.
Horizontally across the top of the chart is a list of the Department's strategic outcomes:
- The Government: Good governance and co-operative relationships for First Nations, Métis, Non-Status Indians, Inuit and Northerners.
- The People: Individual, family and community well-being for First Nations and Inuit.
- The Land and Economy: Full participation of First Nations, Métis, Non-Status Indians and Inuit individuals and communities in the economy.
- The North: Self-reliance, prosperity, and well-being for the people and communities of the North.
Under the strategic outcomes is a list of the programs that support each strategic outcome, and sub-programs that support these programs.
The Government
The program Governance and Institutions of Government is supported by sub-programs First Nation Governments; and Institutions and Organizations.
The program Co-operative Relationships is supported by sub-programs Negotiations of Claims and Self-Government; Specific Claims; Inuit Relations; Consultation and Engagement; and Métis and Non-Status Indian Relations and Métis Rights Management.
The program Treaty Management is supported by sub-programs Implementation of Modern-treaty Obligations; Management of Treaty Relationships; and Management of other Negotiated Settlements.
The People
The program Education is supported by sub-programs Elementary and Secondary Education; and Post-Secondary Education.
The program Social Development is supported by sub-programs Income Assistance; National Child Benefit Reinvestment; Assisted Living; First Nations Child and Family Services; and Family Violence Prevention.
The program Managing Individual Affairs is supported by sub-programs Registration and Membership; Management of Moneys; Estate Management; and Treaty Annuities.
The program Residential Schools Resolution is supported by sub-programs Common Experience Payments; Independent Assessment Process; Commemoration; and Support to the Truth and Reconciliation Commission.
The Land and Economy
The program Aboriginal Economic Development is supported by sub-programs Aboriginal Entrepreneurship; Activation of Community Assets; and Strategic Federal Investments and Partnerships.
The program Federal Administration of Reserve Land is supported by sub-programs Additions to Reserve; Registration of Rights and Interests in Reserve Lands; Clarity of Reserve Boundaries; and Environmental Management.
The program Community Infrastructure is supported by sub-programs Water and Wastewater Infrastructure; Education Facilities; Housing; Community Infrastructure Assets and Facilities; and Renewable Energy and Energy Efficiency.
The program Urban Aboriginal Participation is not supported by any sub-programs.
The North
The program Northern Governance and People is supported by sub-programs Political Development and Intergovernmental Relations; Nutrition North; and Climate Change Adaptation.
The program Northern Science and Technology is supported by sub-programs Northern Contaminants; and Science Initiatives.
The program Northern Land, Resources and Environmental Management is supported by sub-programs Oil and Gas; Mines and Minerals; Contaminated Sites; Land and Water Management; and Environmental Management.
Horizontally along the bottom of the chart is the program Internal Services that supports all of the Department's strategic outcomes.
Appendix B: AANDC Evaluation Universe
| MRRS Level |
MRRS ID |
Program Name | Forecast Spending for 2013-14 | Planned Evaluation | PM Strategy and date approved by EPMRC |
*Evaluation Coverage | ||||
|---|---|---|---|---|---|---|---|---|---|---|
| Vote 1: Salary and O&M |
Vote 5: Capital | Statutory | Grants and Contributions | Total Forecast Spending for 2013-14 |
||||||
| SO | 1 | THE GOVERNMENT | ||||||||
| PA | 1.1 | Governance and Institutions of Government | ||||||||
| SA | 1.1.1 | First Nation Governments | 818,207 | 128,448 | $946,655 | Support for First Nation Governments 2014/15 | $383,720,754 | |||
| AFA Block/Core Funding (Indian Government Support - Band and Tribal Council) | 339,846,190 | $339,846,190 | ||||||||
| Band Governance (Administration and Support Services, Elections, By-laws, Training and Capacity for Elections and Lawmaking) | 2,579,164 | 386,449 | 300,000 | $3,265,613 | ||||||
| Band Support Funding | 48,171 | 8,382 | 399,532 | $456,085 | ||||||
| Indian Government Support - Administration | 780,796 | 134,326 | $915,122 | |||||||
| Management Operations | 32,981,153 | 5,309,936 | $38,291,089 | |||||||
| Consultation and Policy Development - Governance | 1,500,641 | 248,421 | 6,421,126 | $8,170,188 | Resource/Capacity Development for First Nation Governments, Associations and Organizations (see also 1.1.2.3) 2013/14 | Capacity Development Partnerships Program - Nov. 2011 |
$61,938,507 | |||
| Gathering Strength - Governance | 598,602 | 99,011 | 1,985,472 | $2,683,085 | ||||||
| Gathering Strength - Institutions | 1,200,000 | $1,200,000 | ||||||||
| Professional and Institutional Development Program | 2,008,710 | 289,911 | 16,240,900 | $18,539,521 | ||||||
| Miawpukek Band Conne River | 10,220,400 | $10,220,400 | Miawpukek Grant Agreement 2015/16 | $10,220,400 | ||||||
| SA | 1.1.2 | Institutions and Organizations | 372,542 | 64,822 | $437,364 | Resource/Capacity Development ... (see above) | ||||
| SSA (SSSA) |
1.1.2.1 | Service Delivery (Tribal Council Funding, Band Advisory Services) |
||||||||
| SSA (SSSA) |
1.1.2.2 | Professional Development (Inuit Art, First Nations Fiscal and Statistical Management Act) | 245,238 | 22,637 | 13,392,000 | $13,659,875 | ||||
| SSA (SSSA) |
1.1.2.3 | Representative Organizations (Policy Engagement - Basic Organizational Capacity for First Nation and Inuit Organizations) | 58,638 | 10,203 | 17,963,331 | $18,032,172 | ||||
| PA | 1.2 | Co-operative Relationships | ||||||||
| SA | 1.2.1 | Negotiations of Claims and Self-Government | 34,929,560 | 6,000,000 | 4,398,846 | 54,539,170 | $99,867,576 | Process for Negotiating Comprehensive Land Claims and Self-Government Agreements 2013/14 Note: This evaluation to include related funding from authorities under SA 1.3.1 |
Measuring the Impacts of Comprehensive Land Claim and Self Government Agreements - June 2012 | $87,367,576 |
| Treaty Related Measures 2014/15 | Treaty Related Measures - June 2010 | $12,500,000 | ||||||||
| Negotiation of Special Claims 2013/14 | ||||||||||
| SA | 1.2.2 | Specific Claims | 6,100,993 | 907,283 | 260,098,860 | $267,107,136 | Specific Claims Action Plan (Summative Evaluation) 2017/18 | $266,287,136 | ||
| SA | 1.2.3 | Inuit Relations | 1,478,437 | 185,617 | 900,000 | $2,564,054 | Inuit Relations Secretariat and Inuit Counseling in the South 2015/16 | $1,744,054 | ||
| SA | 1.2.4 | Consultation and Engagement | 5,094,796 | 464,649 | 2,359,928 | $7,919,373 | Consultation and Accommodation Program 2013/14 | Consultation and Policy Development - Nov. 2010 | $5,559,445 | |
| 1.2.4 | Consultation and Policy Development Authority 2013-14 | $11,426,128 | ||||||||
| 1.2.5 | Métis and Non-Status Indian Relations and Métis Rights Management | 5,088,137 | 471,278 | 13,504,000 | $19,063,415 | Federal Interlocutor's Bilateral and Tripartite Process and the Powley Initiative 2013/14 | $19,063,415 | |||
| PA | 1.3 | Treaty Management | ||||||||
| SA | 1.3.1 | Implementation of modern treaty obligations | 6,350,982 | 84,806,596 | 310,189,272 | $401,346,850 | Process for Implementing Comprehensive Land Claims and Self-Government Agreements 2013/14 | Measuring the Impacts of Comprehensive Land Claim and Self Government Agreements - June 2012 | $401,346,850 | |
| Impacts of Comprehensive Land Claims Agreements and Self-Government Agreements 2013/14 | ||||||||||
| SA | 1.3.2 | Management of Treaty Relationships | 363,431 | 63,237 | 301,965,346 | $302,392,014 | Impact of Self-Government Agreements 2014/15 | $302,392,014 | ||
| Treaty Commissions | 2,202,000 | 186,528 | 6,574,502 | $8,963,030 | Treaty Commissions 2014/15 Note: components of 1.3.2 not related to Treaty Commissions is covered above in 1.3.1 |
Treaty Commissions - Feb. 2011 | $3,138,528 | |||
| SA | 1.3.3 | Management of Other Negotiated Settlements | 890,000 | $890,000 | ||||||
| SO | 2 | THE PEOPLE | ||||||||
| PA | 2.1 | Education | ||||||||
| SA | 2.1.1 | Elementary and Secondary Education | 868,844 | 151,179 | 150,000 | $1,170,023 | Elementary and Secondary Education 2017/18 | Education - Nov. 2010 | $1,425,165,949 | |
| AFA Block/Core Funding (Elementary/Secondary) |
184,179 | 32,047 | 1,037,600,212 | $1,037,816,438 | ||||||
| Elementary/Secondary Instructional Services - Band Operated Schools | 1,563,041 | 216,433 | 22,564,036 | $24,343,510 | ||||||
| Elementary/Secondary Instructional Services - Federal Schools | 11,917,306 | 1,952,543 | 456,467 | $14,326,316 | ||||||
| Elementary/Secondary Instructional Services - Provincial Schools | 896,835 | 59,191 | $956,026 | |||||||
| Elementary/Secondary Student Support Services | 502,000 | 87,000 | $589,000 | |||||||
| New Paths for Education | 425,519 | 64,958 | 48,696,101 | $49,186,578 | ||||||
| Reforming First Nation Education Initiative | 3,408,514 | 398,122 | 89,587,253 | $93,393,889 | ||||||
| Special Education Program/High Cost | 2,490,194 | 325,414 | 128,993,802 | $131,809,410 | ||||||
| Partnerships Initiatives - Education | 35,000,000 | $35,000,000 | ||||||||
| Performance Measurement System Education | 449,940 | $449,940 | ||||||||
| Youth Employment Strategy Program | 435,795 | 48,024 | 26,175,000 | $26,658,819 | ||||||
| Cultural Centres | 37,000 | 9,429,000 | $9,466,000 | |||||||
| National Aboriginal Achievement Foundation - Capacity Development - Program Design and Delivery | 817,000 | $817,000 | National Aboriginal Achievement Foundation 2014/15 Note: Evaluation to be led by Heritage Canada |
$817,000 | ||||||
| SA | 2.1.2 | Post-secondary Education | 57,758 | 335,108,838 | $335,166,596 | Post-Secondary Education 2017/18 | $335,166,596 | |||
| PA | 2.2 | Social Development | ||||||||
| SA | 2.2.1 | Income Assistance | 3,013,610 | 429,568 | 862,943,482 | $866,386,660 | Income Assistance, National Child Benefit Reinvestment and Assisted Living 2016/17 | Social Development - Feb 2011 | $952,300,825 | |
| Basic Needs | ||||||||||
| Special Needs | ||||||||||
| Service Delivery | ||||||||||
| Reform Enhanced Service Delivery System | ||||||||||
| SA | 2.2.2 | National Child Benefit Re-investment | 16,174 | 2,814 | 1,880,000 | $1,898,988 | ||||
| SA | 2.2.3 | Assisted Living | 207,987 | 36,190 | 83,771,000 | $84,015,177 | ||||
| SA | 2.2.4 | First Nations Child and Family Services | 3,836,845 | 294,036 | 607,410,150 | $611,541,031 | Enhanced Prevention Focused Approach for the First Nations Child and Family Services Program in Quebec and PEI 2013/14 | $89,001,200 | ||
| Enhanced Prevention Focused Approach for the First Nations Child and Family Services Program in Manitoba 2013/14 | $131,967,688 | |||||||||
| Enhanced Prevention Focused Approach for the First Nations Child and Family Services Program 2017/18 | $390,572,143 | |||||||||
| Other Social Services | 5,031,403 | 807,346 | 26,236,967 | $32,075,716 | Other Social Services 2016-17 | $32,075,716 | ||||
| SA | 2.2.5 | Family Violence Prevention | 72,500 | 12,615 | 18,515,393 | $18,600,508 | Family Violence Prevention 2016/17 | $18,600,508 | ||
| Aboriginal Women's Issues | 183,351 | 28,471 | 250,000 | $461,822 | ||||||
| PA | 2.3 | Managing Individual Affairs | ||||||||
| SA | 2.3.1 | Registration and Membership | 11,631,384 | 639,000 | 1,668,089 | 8,325,796 | $22,264,269 | Registration Administration 2015/16 | $22,264,269 | |
| SA | 2.3.2 | Management of Moneys | 1,005,210 | 147,178 | 462,000 | $1,614,388 | Band Moneys (including suspense accounts) 2017/18 | $132,110 | ||
| SA | 2.3.3 | Estate Management | 2,118,855 | 303,037 | 232,000 | $2,653,892 | Estates 2017/18 | $3,674,170 | ||
| SA | 2.3.4 | Treaty Annuities | 811,147 | 1,465,048 | $2,276,195 | Treaty Annuities 2017/18 | $2,276,195 | |||
| PA | 2.4 | Residential Schools Resolution | ||||||||
| SA | 2.4.1 | Common Experience Payment | Note: An evaluability assessment completed in September 2009 identified two evaluation commitments for AANDC. The Evaluation of Advocacy and Public Information was completed in 2008-09 and the Evaluation of Community-Based Healing Initiatives Supported Through the Aboriginal Healing Foundation in 2009-10. No further evaluations by AANDC are planed. | |||||||
| SA | 2.4.2 | Independent Assessment Process | 684,878,366 | 7,382,000 | $692,260,366 | |||||
| SA | 2.4.3 | Commemoration | 3,356,919 | 420,608 | $3,777,527 | |||||
| SA | 2.4.4 | Support to the Truth and Reconciliation Commission | ||||||||
| SO | 3 | THE LAND AND ECONOMY | ||||||||
| PA | 3.1 | Aboriginal Economic Development | ||||||||
| SA | 3.1.1 | Aboriginal Entrepreneurship | ||||||||
| SSA | 3.1.1.1 | Access to Capital and Business Services | 7,210,680 | 928,837 | 40,016,000 | $48,155,517 | Access to Capital and Business Services (to include ABDP, Access to Capital, Aboriginal Financial Institutions, Major Projects Investment Fund) 2013/14 Note: The Evaluation of Aboriginal Entrepreneurship from 2012/13 Plan split into two evaluations 1) Access to Capital and Business Services; and 2) Procurement Strategy for Aboriginal Business |
Loan Loss Reserve/Major Resource Development and Energy Investments - Nov 2010 | $48,155,517 | |
| SSA | 3.1.1.2 | Procurement Opportunities | 1,428,643 | 114,648 | 500,000 | $2,043,291 | Procurement Strategy for Aboriginal Business 2013/14 | $2,043,291 | ||
| SA | 3.1.2 | Activation of Community Assets | 3,044,075 | 529,669 | $3,573,744 | Investment in Economic Opportunities (to include CEDP, CSSP, CEOP) 2013/14 Note: the Evaluation of Activation of Community Assets from the 2012/13 Plan has been split into five evaluations: 1)Investment in Economic Opportunities; 2) Land Management; 3) Indian Oil and Gas Canada; 4) Evaluation of Legislation to Facilitate Economic Development; and 5) First Nations Land Management |
$109,465,563 | |||
| SSA | 3.1.2.1 | Investment in Economic Opportunities | 6,603,380 | 2,439,057 | 96,849,382 | $105,891,819 | ||||
| SSA | 3.1.2.2 | Creation of Rights and Interests in Reserve Land | 10,136,709 | 1,516,598 | 5,320,880 | $16,974,187 | Land Management 2015/16 Note: Name change from 2012/13 Plan from Federal Administration of Reserve Land. Evaluation to include Additions to Reserve, Registration of Rights and Interests in Reserve Land and Clarity of Reserve Boundaries (see 3.2.1) |
$31,133,724 | ||
| SSA | 3.1.2.3 | Federal Management of Oil and Gas Interests in Reserve Land | 11,372,591 | 1,270,089 | 1,338,000 | $13,980,680 | Indian Oil and Gas Canada 2016/17 | Indian Oil and Gas Canada - Feb 2011 | $13,322,680 | |
| SSA | 3.1.2.4 | First Nations Commercial and Industrial Development | 2,021,123 | 82,076 | $2,103,199 | Legislation to Facilitate Economic Development 2016/17 Note: To include First Nations Commercial and Industrial Development Act and First Nations Oil and Gas Moneys Management Act |
$4,500,874 | |||
| SSA | 3.1.2.5 | First Nations Land Management | 3,907,844 | 324,365 | 29,969,334 | $34,201,543 | First Nations Land Management 2014/15 | Reserve Land and Environment Management Program - June 2010 | $34,201,543 | |
| SSA | 3.1.2.6 | First Nations Oil and Gas Management | 1,385,675 | 550,000 | $1,935,675 | Legislation to Facilitate Economic Development … (see above) | ||||
| SA | 3.1.3 | Strategic Federal Investments and Partnerships | 9,846,802 | 910,669 | 14,450,000 | $25,207,471 | The Aboriginal Economic Development Framework and Strategic Partnerships Initiative 2013/14 | Strategic Partnership Initiative - Sept 2010 | $25,207,471 | |
| PA | 3.2 | Federal Administration of Reserve Land | ||||||||
| SA | 3.2.1 | Additions to Reserve | 8,117,353 | 624,619 | 5,400,000 | $14,141,972 | Land Management… (see above) | Additions to Reserve - June 2009 | ||
| SA | 3.2.2 | Registration of Rights and Interests in Reserve Lands | ||||||||
| SA | 3.2.3 | Clarity of Reserve Boundaries | 14,962 | 2603 | $17,565 | |||||
| SA | 3.2.4 | Environmental Management | 181,458 | 31574 | $213,032 | Environmental Sustainability and Contaminated Sites On Reserve 2013/14 | $26,558,157 | |||
| SSA | 3.2.4.1 | Contaminated Sites on Reserve | 1,470,986 | 221,317 | 16,216,948 | $17,909,251 | ||||
| SSA | 3.2.4.2 | Environmental Sustainability | 5,669,639 | 686,075 | 2,080,160 | $8,435,874 | ||||
| SSA | 3.2.4.3 | Emergency Management Assistance | 1,874,653 | 259,054 | 9,736,000 | $11,869,707 | Emergency Management Assistance for Activities On Reserve 2014/15 | $11,869,707 | ||
| PA | 3.3 | Community Infrastructure | ||||||||
| SA | 3.3.1 | Water and Wastewater Infrastructure | 13,631,593 | 1,328,138 | 313,626,301 | $328,586,032 | First Nations Water and Wastewater Infrastructure 2013/14 | Umbrella Infrastructure - Sept 2009 | $328,586,032 | |
| SA | 3.3.2 | Education Facilities | 300,465,700 | $300,465,700 | Education and Community Infrastructure 2014/15 | $743,260,057 | ||||
| SA | 3.3.3 | Housing | 754,445 | 526,613 | 144,220,316 | $145,501,374 | Housing 2015/16 | $145,501,374 | ||
| SA | 3.3.4 | Community Infrastructure Assets and Facilities | 1,098,269 | 191,099 | $1,289,368 | Education and Community Infrastructure... (see above) | ||||
| SSA | AFA Block/Core Funding | 403,824,359 | $403,824,359 | |||||||
| Acquisition and Construction of Infrastructure Assets and Facilities | 716,185 | 110,423 | 5,695,000 | 6,521,608 | ||||||
| Operation and Maintenance of Infrastructure Assets and Facilities | 3,763,173 | 653,481 | $4,416,654 | |||||||
| Community Capital Facilities Service Delivery | 5,209,348 | 680,186 | $5,889,534 | |||||||
| Technical Services | 6,065,355 | 888,911 | $6,954,266 | |||||||
| Comprehensive Community Based Planning | 898,568 | $898,568 | ||||||||
| Essential Fuel Storage Tanks for First Nations Communities | 13,000,000 | $13,000,000 | ||||||||
| First Nation Infrastructure Fund | 88,311 | 14,782 | $103,093 | First Nations Infrastructure Fund 2013/14 | $103,093 | |||||
| 3.3.5 | Renewable Energy and Energy Efficiency | 1,076,536 | 107,056 | 2,710,976 | $3,894,568 | EcoENERGY for Aboriginal and Northern Communities 2015/16 Note: Thematic Evaluation of Adaptation for the Clean Air Agenda - EC lead |
EcoENERGY for Aboriginal and Northern Communities (Theme of Clean Air Agenda) - June 2011 | $3,814,246 | ||
| EcoENERGY for Aboriginal and Northern Communities - AANDC Component 2015/16 | ||||||||||
| PA | 3.4 | Urban Aboriginal Participation | 2,112,367 | 220,354 | 38,700,980 | $41,033,701 | Urban Aboriginal Strategy 2013/14 | $41,033,701 | ||
| SO | 4 | THE NORTH | ||||||||
| PA | 4.1 | Northern Governance and People | ||||||||
| SA | 4.1.1 | Political Development and Intergovernmental Relations | 216,289 | 37,634 | $253,923 | Northern Governance – Support for Territorial Relations and Northern Organizations 2014/15 | $12,401,384 | |||
| Intergovernmental Relations | 940,149 | 84,354 | 1,789,000 | $2,813,503 | ||||||
| Commissioners | 186,100 | 30,537 | $216,637 | |||||||
| Arctic Council | 748,900 | 62,344 | $811,244 | |||||||
| Canada/Russia International Relationships | 90,000 | $90,000 | ||||||||
| Northern Governance - Administration Costs to Support Program | 7,039,934 | 1,176,143 | $8,216,077 | |||||||
| Hospital and Physician Services | 51,231,000 | $51,231,000 | Northern Hospital and Physician Services 2016/17 | $51,231,000 | ||||||
| Devolution | 7,112,157 | 203,549 | 4,027,388 | $11,343,094 | NWT Devolution 2014/15 | $7,820,090 | ||||
| SA | 4.1.2 | Nutrition North | 3,129,521 | 93,352 | 53,930,000 | $57,152,873 | Northern Nutrition Contribution (Implementation Evaluation) 2013/14 | Nutrition North Canada - Sept 2010 | $57,152,873 | |
| Northern Nutrition Contribution (Impact Evaluation) 2014/15 | ||||||||||
| SA | 4.1.3 | Climate Change Adaptation | 906,051 | 93,090 | 3,800,000 | $4,799,141 | AANDC's Climate Change Adaptation Program - Assist Northerners in Assessing Key Vulnerabilities and Opportunities 2015/16 Note: Thematic Evaluation of Adaptation for the Clean Air Agenda - EC lead |
Climate Change Adaptation (Theme of Clean Air Agenda) - Sept 2011 | $4,799,141 | |
| AANDC's Climate Change Adaptation Program - Assist Northerners in Assessing Key Vulnerabilities and Opportunities – AANDC Component 2015/16 | ||||||||||
| PA | 4.2 | Northern Science and Technology | ||||||||
| SA | 4.2.1 | Northern Contaminants | 104,400 | 4,805,000 | $4,909,400 | Northern Science and Technology 2017/18 Note: Name changed from Northern Contaminants Program/Northern Scientific Training Program in 2012-13 Plan |
5,901,936 | |||
| SA | 4.2.2 | Science Initiatives | 961,984 | 6,750,060 | 277,139 | $7,989,183 | Note: This will not be evaluated as it is a capital project. | |||
| PA | 4.3 | Northern Land, Resources and Environmental Management | ||||||||
| SA | 4.3.1 | Oil and Gas | 5,241,942 | 198,277 | 2,650,000 | $8,090,219 | Northern Land, Resources and Environmental Management 2016/17 Note: Name changed from Northern Regulatory Improvement Initiative, Land Resources and Environmental Management in 2013-13 Plan |
$60,874,638 | ||
| SA | 4.3.2 | Mines and Minerals | 10,503,803 | 2,105,836 | $12,609,639 | |||||
| SA | 4.3.4 | Land and Water Management | 21,320,878 | 2,736,218 | 7,518,500 | $31,575,596 | ||||
| SA | 4.3.3 | Contaminated Sites | 161,919,731 | 392,691 | 36,790,173 | $199,102,595 | Federal Contaminated Sites Action Plan 2017/18 Note: Horizontal evaluation with EC lead. |
$187,845,450 | ||
| Northern Contaminated Sites 2013/14 | Northern Contaminated Sites - Feb. 2009 | $11,257,145 | ||||||||
| SA | 4.3.5 | Environmental Management | 5,656,314 | 350,370 | 2,592,500 | $8,599,184 | Northern Land, Resources and Environmental Management… (see above) | |||
| SO | INTERNAL SERVICES | |||||||||
| PA | Governance and Management Support | |||||||||
| SA | Management and Oversight | 32,998,525 | 27,109 | 3,710,464 | $36,736,098 | |||||
| SA | Communications | 15,373,704 | 70,896 | 1,648,283 | $17,092,883 | |||||
| SA | Legal | 86,282,971 | 20,250 | 2,574,420 | $88,877,641 | Note: Department of Justice is conducting and evaluation of the Aboriginal Affairs Portfolio in 2013-14 | ||||
| PA | Resource Management Services | |||||||||
| SA | Human Resource Management | 18,575,056 | 14,320 | 2,707,791 | $21,297,167 | Recruitment, Development and Retention 2014/15 | $18,389,031 | |||
| SA | Financial Management | 23,491,723 | 135,922 | 3,065,946 | $26,693,591 | |||||
| SA | Information Management | 14,299,339 | 25,058 | 2,387,230 | $16,711,627 | Information for Decision Making 2013/14 | $26,449,905 | |||
| SA | Information Technology | 8,577,605 | 1,160,673 | $9,738,278 | ||||||
| SA | Travel and Other Administrative Services | 17,831,124 | 1,948,240 | $19,779,364 | ||||||
| PA | Asset Management Services | |||||||||
| SA | Real Property | 26,763 | 4,657 | $31,420 | ||||||
| SA | Material | 3,053,200 | 263,213 | $3,316,413 | ||||||
| SA | Acquisition | 1,163,933 | 184,012 | $1,347,945 | ||||||
| $1,415,528,466 | $13,682,615 | $159,161,058 | $6,316,598,423 | $7,904,970,562 | $6,983,598,799 | |||||
Coverage amounts may differ due to the scope of the evaluation, i.e. evaluation covers specific activities and/or a broader range of activities