Archived - Northern Contaminated Sites Program Performance Report 2010-2011
Archived information
This Web page has been archived on the Web. Archived information is provided for reference, research or record keeping purposes. It is not subject to the Government of Canada Web Standards and has not been altered or updated since it was archived. Please contact us to request a format other than those available.
Author: Her Majesty the Queen in right of Canada,
represented by the Minister of Aboriginal Affairs and Northern Development
Date: 2013
ISSN: 2291-8086
QS-6315-000-EE-A1
PDF Version (2.29 Mb, 27 Pages)
Table of Contents
- Purpose
- List of Acronyms
- Executive Summary
- 1.0 Program Overview
- 2.0 Program Scope
- 3.0 Changing Environment
- 4.0 Challenges in 2010-11
- 5.0 Performance Measurement Strategy 2010-11 to 2014-15
- 6.0 Performance Measurement Results
- 7.0 Major Accomplishments in 2010-11
- Annex A – AANDC Contaminated Sites Remediated
Purpose
As part of its commitment to public reporting, Aboriginal Affairs and Northern Development Canada (AANDC)'s Northern Contaminated Sites Program (NCSP) issues an annual performance report on its progress in managing northern federal contaminated sites.
This is the tenth annual performance report published by the program. It reports on the NCSP's performance from April 2010 to March 2011 against the objectives established in its 2010-2015 Performance Measurement Strategy.
Further information on the NCSP, its activities and previous annual performance reports can be found at Northern Contaminated Sites Program.
List of Acronyms
Executive Summary
Through its Northern Contaminated Sites Program (NCSP), Aboriginal Affairs and Northern Development Canada (AANDC) manages contaminated sites across the Yukon, the Northwest Territories and Nunavut. The purpose of the program is to reduce and eliminate risks to human and environmental health as well as federal financial liabilities associated with these sites. This report presents NCSP's performance against the objectives of the Program's Performance Measurement Strategy.
The Program liability estimate, which includes some of the largest and most complex contaminated sites in the country, is currently estimated at $1.7 billion, the largest liability of any federal department. It represents an increase of $200 million in 2010-11. The increase in liability is mainly due to revised cost estimates received during the year for both Giant Mine (NWT) and Faro Mine (Yukon). The revisions resulted from updated estimates accounting for changes in market rates for labour, fuel, equipment and materials and included costs that had been omitted in the past (e.g. care and maintenance during the construction phase, inflation).
In 2010-11, the NCSP accelerated its site assessment efforts as a result of new funding received under Canada's Economic Action Plan. The program has also moved an unprecedented number of sites beyond site assessment and remediation planning to the active remediation stage. Seventeen sites were under active remediation and eleven sites remediated in 2010-11.
The NCSP continues to promote social and economic opportunities in the North by engaging First Nations, Inuit and other Northerners in all aspects of the site management and remediation process. To that end, the program has established an overall target of ensuring that 60% of all project employment, training and contracts (by value) are provided to Northerners and northern Aboriginals. The program has made steady progress in achieving this objective. However, additional work is required to achieve these goals for northern Aboriginals.
Program expenditures in 2010-11 exceeded $145 million with $138 million coming from the Federal Contaminated Sites Action Plan (FCSAP). This included $11.1 million from Canada's Economic Action Plan. These expenditures reflect an increase over previous years, in part due to the growing number of priority sites moving into active remediation. Moving forward, the program will continue to accelerate its activities on priority sites.
1.0 Program Overview
Aboriginal Affairs and Northern Development Canada (AANDC) is the principal federal department responsible for meeting the Government of Canada's constitutional, political and legal responsibilities in the North. In order to achieve the mandate of AANDC with respect to management of the North, the Department has developed a strategic outcome to ensure that the people of the North are self-reliant, healthy, skilled and live in prosperous communities. To meet the challenges and opportunities of a changing North, and ensure that our strategic outcome is achieved the Government has established a comprehensive Northern Strategy and is taking concrete action in four priority areas:
- Exercising our Arctic sovereignty
- Protecting our environmental heritage
- Promoting social and economic development
- Improving and devolving northern governance
Protecting our environmental heritage involves taking a comprehensive approach to the protection of environmentally sensitive lands and water in our North, ensuring conservation keeps pace with development and development decisions are based on sound science and careful assessment. As part of this effort, the Government has enhanced pollution prevention legislation in Arctic waters and is taking steps to clean up abandoned mine and military sites across the North.
Within AANDC, the Northern Affairs Organization's (NAO) is mandated with the vast majority of the Department's activities related to the Northern Strategy, a complete version of which can be located at Canada's Northern Strategy: Our North, Our Heritage, Our Future. In addition, pursuant to the Department of Indian Affairs and Northern Development (DIAND) Act, AANDC is responsible for the management of contaminated sites in the Yukon, the Northwest Territories and Nunavut.
Contaminated sites in the North have not typically resulted from departmental operations. Rather, AANDC's portfolio of northern contaminated sites originate primarily from mining, petroleum and military activity dating back over half a century, long before the environmental impacts of these activities were adequately understood.
The Northern Contaminated Sites Program (NCSP) was created within NAO in 1991. However, the scale and complexity of AANDC's liability grew rapidly in the late 1990s as a result of a sudden increase in private sector bankruptcies associated with falling mineral prices. The Department has since developed and implemented a mine reclamation policy which limits its liability in current and future mining projects.
The NCSP's goal is to ‘reduce and eliminate, where possible, risk to human and environmental health and liability associated with contaminated sites'. Priority is placed on sites that have been classified according to the Canadian Council of Ministers of the Environment (CCME) National Contaminated Sites Classification System (NCSCS) as Class 1 (high priority for action) or Class 2 (medium priority for action).
Implementation of the program is guided by the 2002 AANDC Contaminated Sites Management Policy, which outlines the following six objectives:
- to meet federal and departmental policy requirements and legal obligations regarding the management of contaminated sites;
- to require that, where a suspected contaminated site has been identified, the site be assessed in a timely, consistent and cost-effective manner;
- to provide a scientifically valid, risk management-based framework for setting priorities, planning, implementation and reporting on the management of contaminated sites;
- to remediate, based on approved resource levels, all NCSCS Class 1 contaminated sites in the North, on a priority basis, unless it can be demonstrated that for a specific site an alternative form of management is appropriate;
- to promote the social and economic benefits that may accrue to First Nations, Inuit and Northerners when carrying out activities required by this policy; and
- to promote the federal "polluter pay" principle.
Annually NCSP produces a Performance Report that outlines the work done within the last year. The last five Performance Reports written for the Northern Contaminated Sites Program were based on the Results-Based Management Accountability Framework (RMAF) for 2005-2010. They reported on the progress made against targets found in the RMAF designed to show progress towards the six objectives found in the Contaminated Sites Management Policy. The results of which can be found in the Northern Contaminated Sites Program Progress Report 2005-2010.
This past fiscal year a Performance Measurement Strategy was developed based on guidance provided by the Treasury Board Secretariat which replaces the RMAF. This progress report is designed to report on our progress against this strategy.
2.0 Program Scope
2.1 Program Liability
Liability is defined as the obligation the Crown has to remediate and/or risk manage these contaminated sites. The determination of the liability for the Crown is governed by the 'Treasury Board Secretariat (TBS) Guidance on Remediation Liabilities Related to Contaminated Sites - Dec 2010'.
AANDC has the largest liability of all federal departments. Liabilities associated with AANDC sites are found in Table 1 and are currently estimated at $1.7 billion. These liabilities include some of the largest and most complex contaminated sites in the country. For example, the Faro Mine, in the south-central Yukon, and the Giant Mine, within Yellowknife City limits in the NWT, together represent liabilities of approximately $1.2 billion. The current liability has increased mainly due to revised cost estimates received during the year for both sites that updated existing estimates for changes in market rates for labour, fuel, equipment and materials and also added in other costs that had been omitted in the past (e.g. care and maintenance during the construction phase, inflation). Other increases were related to refinements made to cost estimates, offset in some cases by liability reduction due to work carried out during the year.
The program has continued to actively assess suspected sites to ensure that it has a complete picture of its liabilities in the North. It is not anticipated that major new liabilities will emerge, or that significant ongoing efforts will be required on any sites that are identified as a result of this process. This work was accelerated during 2010-11 as a result of new funds approved under Canada's Economic Action Plan (CEAP). In the next couple of years the overall liability will start to trend downwards as the small-to medium-size contaminated sites are completed.
| Liability Estimates by Region | |||||
|---|---|---|---|---|---|
| 2006-07 | 2007-08 | 2008-09 | 2009-10 | 2010-11 | |
| Yukon | $98,724,970 | $85,014,416 | $82,876,022 | $82,176,239 | $111,602,883 |
| NWT | $139,030,647 | $159,571,894 | $163,016,548 | $237,339,979 | $187,585,626 |
| Nunavut | $139,314,007 | $163,866,827 | $192,259,134 | $212,866,917 | $191,103,698 |
| Giant & Faro | $855,969,099 | $990,658,620 | $990,524,682 | $1,057,229,942 | $1,251,346,485 |
| Total Liability | $1,243,038,644 | $1,399,111,757 | $1,428,567,513 | $1,589,613,077 | $1,755,219,705 |
Figure 1 – Overall Program Liability

Text description for figure 1 - Overall Program Liability
This image is a line graph of the overall program liability for each fiscal year between 2006-07 and 2010-11, with two lines. One line shows the liability for Giant and Faro mines, and the other line is for the total liability for all sites excluding Giant and Faro mines. Both numbers have gone up gradually over the five years.
2.2 Contaminated Sites Inventory
The NCSP maintains a comprehensive, regularly updated, electronic inventory of contaminated sites in the North. Following an initial assessment, each site is classified using NCSCS. This system is designed to rank the sites according to the risk to human health and the environment. Of these, 109 are classified as Class 1 (a high priority for action) or Class 2 (a medium priority for action). As indicated below, the number of priority NCSP sites has increased slightly over time, as a result of further assessment activities at these sites. AANDC will work to further remediate Class 1 and 2 sites and reduce the risk to human health and the environment.
| CLASS | 2006-07 | 2007-08 | 2008-09 | 2009-10 | 2010-11 |
|---|---|---|---|---|---|
| 1 | 49 | 50 | 45 | 47 | 54 |
| 2 | 22 | 26 | 33 | 32 | 55 |
| 3 | 0 | 0 | 7 | 7 | 5 |
| TOTAL | 71 | 76 | 85 | 86 | 114 |
| Note 1: Sites under risk management and monitoring maintain their NCSCS designation and are included in this table. | |||||
CSP made excellent progress towards the overall goal in 2010-11 with the number of sites moving from remediation to either closure or long term monitoring increasing and the number of suspected sites decreasing in the last couple of years (Figure 2).
Figure 2 – Projects Undergoing Assessment, Remediation and Ongoing Risk Management
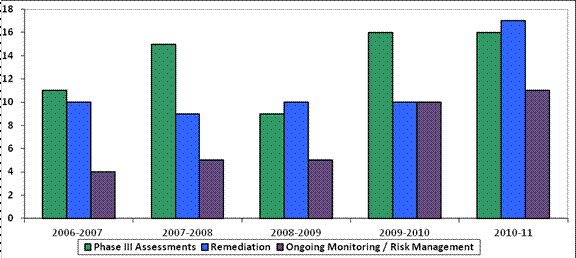
Text description for figure 2 - Projects Undergoing Assessment, Remediation and Ongoing Risk Management
This image is of a bar graph showing the number of projects undergoing assessment, remediation, and ongoing risk management for each fiscal year between 2006-07 and 2010-11. The first bar for each fiscal year is for phase 3 assessments, which has varied over the years between 11 sites in 2006-07 and 16 sites in 2010-11, based on the available funding for assessments. The second bar for each fiscal year is for number of sites undergoing remediation activities, which has also varied over the years. The third bar represents the number of sites with ongoing monitoring or risk management. This number has increased over the years from 4 to 11.
2.3 Program Funding
The majority of funding for the NCSP Program comes from the Federal Contaminated Site Action Plan (FCSAP). FCSAP was created in 2005 and is administered jointly by Environment Canada and the TBS. With a commitment of $3.5 billion over 15 years, FCSAP's overall goal is to protect the human health and the environment from the impacts of federal contaminated sites and to effectively eliminate federal financial liability associated with these sites.
FCSAP provides resources on a cost-shared basis for remediation of most federal sites classified as Class 1 (high priority for action) or Class 2 (medium priority for action) according to the NCSCS. FCSAP covers 100% of the costs associated with the largest and most complex sites in the federal inventory, such as the Faro (Yukon), Colomac (NWT) and Giant Mine (NWT). The NCSP participates actively in all aspects of the FCSAP program, including program oversight and the development of relevant procedures and tools.
| Source of Funds | 2006-07 | 2007-08 | 2008-09 | 2009-10 | 2010-11 |
|---|---|---|---|---|---|
| AANDC | $18,500,000 | $13,510,605 | $12,422,928 | $12,688,225 | $7,389,925 |
| FCSAP | $92,441,194 | $101,703,175 | $99,923,367 | $131,782,678 | $136,868,081 |
| TOTAL | $110,941,194 | $115,213,780 | $112,346,295 | $144,470,903 | $144,028,006 |
2.4 Human Resources
The number of people required to deliver the program has increased significantly since its inception. In the last four years, the Program has continued to grow its employee base both in the regions and at its Headquarters location. This coincides with the increases in activity at contaminated sites and the increase in funding and policy requirements, which are required to deliver the program and projects. Table 4 outlines trends in total program employment since 2006-07. The staff that delivers the program is made up of scientists, engineers, project managers, financial and support staff.
| Total Employment | 2006-07 | 2007-08 | 2008-09 | 2009-10 | 2010-11 |
|---|---|---|---|---|---|
| Headquarters | 7.5 | 10.5 | 9.5 | 12 | 19.5 |
| Nunavut | 4.75 | 4.75 | 8 | 9 | 8.5 |
| NWT | 29 | 42.5 | 37 | 40 | 34.5 |
| Yukon | 7.5 | 7.5 | 11 | 11 | 10 |
| Total | 48.75 | 65.25 | 65.5 | 72 | 72.5 |
3.0 Changing Environment
3.1 NWT Devolution
The process of devolving the NWT is currently being negotiated and will give the NWT Government more power to manage the territory. The Devolution Agreement-In-Principle (AIP) was signed on January 26, 2011. A key step in the devolution process is preparing to meet the Agreement-In-Principle commitments specified within Chapter 8: Waste Sites. The Chapter is based on the principle that Canada is responsible for sites created pre-devolution, while the Government of the Northwest Territories (GNWT) and/or Aboriginal organizations are responsible for sites created post-devolution or post land claims settlement within their respective lands (class 8.3 of the Agreement-In-Principle). NCSP is currently working to define and prioritize all known waste sites within the NWT to inform the devolution process.
3.2 Treasury Board Policies
In 2010-11 a major shift in the Treasury Board Policy Suite relating to the management of contaminated sites and major projects was introduced. The Treasury Board Policies for the management of major projects focused on dollar value, meaning that a project that was greater than $100 million dollars to implement needed to go to the Treasury Board for approval at two stages. In addition, any projects that were going to be implemented by the Department in excess of $15 million dollars also needed to go to the Treasury Board for approval. These policies are being phased out and will no longer be used as of April 2012.
In June 2007 TBS introduced the Policy on Investment Planning, Assets and Acquired Services and the Policy on the Management of Projects. The management of major projects has shifted to an emphasis on risk rather than dollar value. This new Policy Suite also incorporates two new standards: the Standard for Organizational Project Management Capacity and the Standard for Project Complexity and Risk. These tools, are used, on a project-by-project basis, to determine if the Department in question has the necessary governance structures in place to manage projects of a certain complexity and risk.
4.0 Challenges in 2010-11
Working on these very large, labour-intensive and expensive projects always means facing challenges, including continuity of staff and developing or finding the level of talent and experience required to conduct these large scale projects. Working in the North adds its own unique set of challenges that affect the manner and the speed with which these sites can be assessed and remediated. The short field season of two to four months limits the amount of work that can be completed in a given year. The remoteness of these sites means that people and resources need to get to the site often either by air, winter roads or sea lift.
In addition, there are challenges related to the management of these sites. Often the sites are located in overlapping regulatory regimes, jurisdictions and in settled and unsettled land claims areas. Obtaining permits to complete remediation work are part of the process. Often these permits need to be obtained annually, as is the case with quarry permits. These permits are critical to the start of the field season and any delays in obtaining the permits can result in the work not being completed or put the entire field season in jeopardy. Delays are always a possibility since approvals and permits are received throughout multiple levels of government.
In addition to these "regular" challenges that occur every year some of our sites faced additional challenges this year with regards to their specific site characteristics:
- The Frobisher Sour Gas Well Project in NWT faced some challenges related to equipment required for drilling. These rigs are scarce and in demand in Alberta for the oil sands. A rig was located but it required 13 semi truck loads to transport it to site. The work was being performed during the winter months, but the crew and the equipment had to stop work earlier than expected due to deteriorating condition of the ice road. This required the crew and the equipment to leave the site while the ice road was still passable.
- A one in 500-year flood occurred at Clinton Creek, Yukon in August 2010; this resulted in significant damage occurring at the site. Gabion Structures were damaged, channel floors were eroded to bedrock, 1 to 1 ½ meters of river bank eroded away, cracks formed in roads, creek channels changed course, debris was found throughout and canyons were created. This will result in emergency repairs being required at the site, increasing the budget. These events are impossible to predict, difficult to plan for and impossible to prevent but can increase the budget and often delay progress towards remediation.
5.0 Performance Measurement Strategy 2010-11 to 2014-15
5.1 Introduction
In 2009-2010 a new Performance Measurement Strategy (PM Strategy) was developed for the program in conjunction with the policy and guidance provided by the Treasury Board Secretariat and the requirements outlined in the INAC Guidance on Performance Measurement Strategies. The purpose of these strategies is to support program planning, monitoring and reporting through the identification of a suite of performance indicators that can inform decision making and support evaluation activities over time.
5.2 Logic Model
Figure 3 is the logic model that was developed for the NCSP. It aims to link the NCSP's inputs and activities to its expected outputs and outcomes in a visual fashion while ensuring that the program works towards its ultimate outcome of "human health and the environmental risks and associated liabilities are reduced while bringing economic benefits to the North". The Performance Measurement Matrix was designed with indicators to enable NCSP to monitor and meaningfully assess its progress against the outputs and outcomes found in the logic model, as well as the overall impact of their program over time. Performance indicators provide the basis for strong and effective program evaluation.
Figure 3 – AANDC NCSP Logic Model
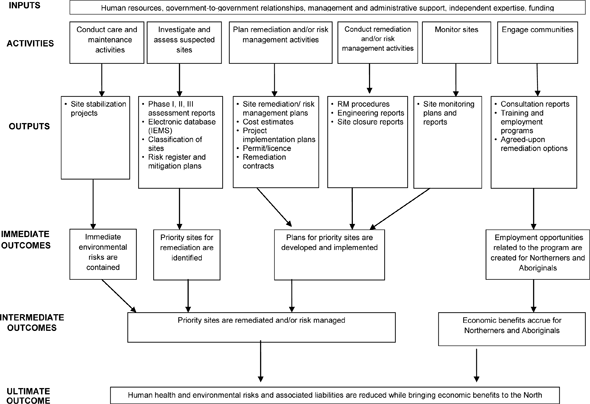
Text description for figure 3 - AANDC NCSP Logic Model
This image is a logic model for the NCSP:
Inputs
- Human resources, government-to-government relationships, management and administrative support, independent expertise, funding
Activities
- Conduct care and maintenance activities
- Investigate and assess suspected sites
- Plan remediation and/or risk management activities
- Conduct remediation and/or risk management activities
- Monitor sites
- Engage communities
Outputs
Box 1:
- Site stabilization projects
Box 2:
- Phase I, II, III assessment reports
- Electronic database (IEMS)
- Classification of sites
- Risk register and mitigation plans
Box 3:
- Site remediation/ risk management plans
- Cost estimates
- Project implementation plans
- Permit/licence
- Remediation contracts
Box 4:
- RM procedures
- Engineering reports
- Site closure reports
Box 5:
- Site monitoring plans and reports
Box 6:
- Consultation reports
- Training and employment programs
- Agreed-upon remediation options
Immediate Outcomes
- Immediate environmental risks are contained
- Priority sites for remediation are identified
- Plans for priority sites are developed and implemented
- Employment opportunities related to the program are created for Northerners and Aboriginals
Intermediate Outcomes
- Priority sites are remediated and/or risk managed
- Economic benefits accrue for Northerners and Aboriginals
Ultimate Outcome
- Human health and environmental risks and associated liabilities are reduced while bringing economic benefits to the North
5.3 Performance Measurement Matrix
At the core of performance measurement is the establishment of performance indicators. The list of indicators developed for the PM Strategy reflects a mix of quantitative and qualitative indicators, and includes both indicators currently in use by the program as well as new indicators that reflect emerging priorities and needs.
Several Tier 2 indicators were also identified and will be refined in future years in order to measure trends in environmental risks associated with sites managed by the program. Tier 2 indicators require further refinement and/or analysis and will be phased in over the life of this PM Strategy. The suite of indicators also includes several sub-indicators pertaining only to the Faro and Giant mine sites. These sub-indicators have been included because of the significance of these two sites to the program as a whole as well as the overall proportion of program responsibility and risk they represent.
6.0 Performance Measurement Results
The progress towards each indicator outlined in the Performance Measurement Strategy can be found in subsequent sections. The indicators are grouped together as they are found on the logic model, an overall dashboard is present indicating where the targets were met in terms of, "achieved", "partially achieved" and "not achieved".
6.1 Outputs
The Logic Model contains activities, which represent stages that are conducted on all federal contaminated sites; as such, they correspond with the broad categories of work outlined in the FSCAP program. Each of these are designed to show our progress towards these outputs.
| Output | Indicator | Target | Overall Result |
|---|---|---|---|
| 6.1.1 Classification of sites | % of suspected sites that have been assessed | 33% | 35% Achieved |
| 6.1.2 Consultation Reports | # of consultation / engagement activities | 30/year | 122 Achieved |
| 6.1.3 Training Program | 6.1.3.1 % of persons hours of training provided to Northern / Aboriginals | 60% | 92.8% Achieved |
| 6.1.3.2 Training for women (sub-indicator) | 5% | n/a (Tier II) |
6.1.1 Classification of sites - % of suspected sites that have been assessed
The assessment refers to Phase I or Historical Review and is a useful indicator because it determines if sites have the possibility of being a contaminated site. In 2010-11, 101 sites underwent a Phase I and 155 underwent a site reconnaissance, with only six sites requiring further assessment, achieving our target. In the Northwest Territories some sites undergo a reconnaissance before a Phase I / II is completed. This is due to the fact that the information relating to these sites is anecdotal or more information is needed on the size/scope of the site prior to the assessment being undertaken.
6.1.2 Consultation Reports - # of consultation / engagement activities
Consultation and community engagement activities (community meetings, site visits, workshops) are important and an opportunity to invite the participation of First Nations, Inuit and other Northerners in program activities. These typically take place at the beginning of the project, once the remediation plan is developed and once the project is complete. However, some of our larger sites, such as Giant, have ongoing community involvement throughout the year. The target of 30 consultation activities per year was achieved with 122 consultation activities taking place with an audience of 2505 people attending.
| Consultation Performance Measures | 2006-07 | 2007-08 | 2008-09 | 2009-10 | 2010-11 | |
|---|---|---|---|---|---|---|
| Community tours & meetings, Workshops and Site Tours | Number | 81 | 87 | 86 | 130 | 122 |
| Audience (# of persons) | 741 | 1488 | 1238 | 1612 | 2,505 | |
| Media (TV, radio) events and Press reports | Number | 43 | 26 | 39 | 23 | 40 |
6.1.3 Training Program - % of persons hours of training provided to northern Aboriginals
Training is an important prerequisite for Northerners and northern Aboriginals to benefit from program activities. As such, the NCSP continues to place priority on developing and delivering workforce training programs across the North.
6.1.3.1 Percentage of persons hours of training provided to northern Aboriginals
These training efforts in 2010-11 exceeded its target of ensuring 60% of all person hours of training being provided to Northerners and Aboriginals. Northerners (including Aboriginals) received 92.8% and Aboriginals receiving 32% of all the training provided. An increase in training in the last year is due to some sites did not report on training numbers in 2009-10.
Figure 4 – Training Implemented by the Northern Contaminated Sites Program
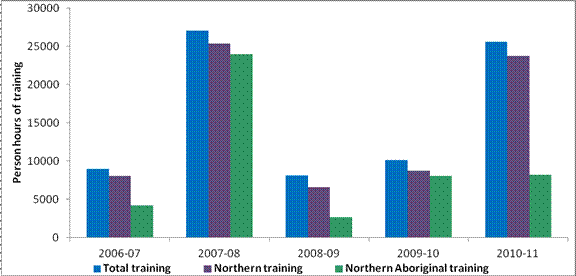
Text description for figure 4 - Training Implemented by the Northern Contaminated Sites Program
This image is of a bar graph showing the person-hours of training implemented by the Northern Contaminated Sites Program each fiscal year between 2006-07 and 2010-11.
The first bar for each fiscal year shows the total person-hours of training for the program. In 2006-07, 8,938 person-hours of training was carried out; 27,054 person-hours in 2007-08; 8,119 in 2008-09; 10,136 in 2009-10; and 25,578 in 2010-11.
The second bar for each fiscal year shows the number of person-hours of training for Northerners. In 2006-07, 8,033 person-hours of training was carried out for Northerners; 25,340 in 2007-08; 6,604 in 2008-09; 8,715 in 2009-10; and 23,741 in 2010-11.
The third bar for each fiscal year shows the number of person-hours of training for Northern Aboriginals. In 2006-07, 4,158 person-hours of training was carried out for Northern Aboriginals; 23,968 in 2007-08; 2,667 in 2008-09; 8,024 in 2009-10; and 8,194 in 2010-11.
Note that the person-hours of training for Northerners can include Northern Aboriginals. As well, some sites did not report numbers for 2008-09 and 2009-10.
6.1.3.2 Percentage of persons hours of training provided to Women
This indicator is currently not being tracked by our contractors as a result it cannot be reported on in 2010-11. The data will be tracked in upcoming years; the target of 5% may be refined based on this data. The indicator will be reported on in 2012-13.
6.2 Immediate outcomes
Four immediate outcomes underpin the intermediate outcomes. It is anticipated that most of these immediate outcomes will be achieved over the next two to three years.
| Immediate Outcome | Indicator | Target | Overall Result |
|---|---|---|---|
| 6.2.1 Immediate environmental risks are contained | 6.2.1.1 #of high and very high risks to the environment for sites under care and maintenance | No net increase | n/a (Tier II) |
| 6.2.1.2 # of non-compliant releases | Zero | 2 Partially achieved |
|
| 6.2.2 Priority sites for remediation are identified | 6.2.2.1 # of Phase III assessments completed | 4 / year | 16 Achieved |
| 6.2.2.2 Regulatory approvals secured (Sub-indicator for Giant and Faro) | Giant 2012/13 Faro 2013/14 |
n/a (Tier II) |
|
| 6.2.3 Plans for priority sites are developed and implemented | 6.2.3.1 Number of sites under active remediation or risk management | 10 / year | 17 Achieved |
| 6.2.3.2 # of remediation contracts established | 3 / year | 5 Achieved |
|
| 6.2.3.3 # of sites for which further action is required | Zero | 0 Achieved |
|
| 6.2.4 Employment opportunities are created for Northerners and Aboriginals | 6.2.4.1 % of Aboriginals and Northerners employed | 60% | 51% Not achieved |
| 6.2.4.2 % of women employed | 5% | n/a (Tier II) |
6.2.1 Immediate environmental risks are contained
Care and Maintenance refers to efforts to control, stabilize or avoid any potential risks or contaminant releases that could arise from sites under care and maintenance activities. Only two sites are under care and maintenance, Giant and Faro Mines. Two indicators were developed for this outcome.
6.2.1.1 Number of high and very high risks to the environment for sites under care and maintenance
All contaminated sites under care and maintenance or remediation have a risk register developed for them. Site risk registers are based on extensive analysis of the types and level of risks at individual sites and as such, provide the best measure of whether this outcome is being achieved. The target for this indicator will be developed in 2011-12 and reported on in 2011-12. The notional target available at this time is no net increase in the number of existing risks.
6.2.1.2 Number of non-compliant releases
This refers to efforts to control, stabilize or avoid any potential risks or contaminant releases that could arise from sites under care and maintenance activities. This objective is only for sites currently under care and maintenance; as a result, it only reflects non-compliant releases that occurred at Giant and Faro Mines.
In 2010-11 no releases occurred at Faro Mine and 6,500 liter were spilled at Giant Mine. The total volume spilled was the result of two incidents one 100 liter waste oil spill which was the result of a broken pipe and one 6,400 liter arsenic contaminated water spill which was the result of a pipeline spill. Both were contained and cleaned up with no adverse impacts occurring.
6.2.2 Priority sites for remediation are identified
This outcome refers to the process by which sites are assessed and then classified under the CCME NCSCS. At the end of this process, project managers have enough relevant information upon which to base decisions on appropriate remediation and/or risk management actions. Two indicators were developed for this immediate outcome.
6.2.2.1 Number of Phase III assessments completed
A Phase III or detailed site assessment needs to be conducted at each site in order to fully understand the level and extent of contamination present at the site and important site characteristics that are required in order to develop a comprehensive and successful remediation action plan. This year, 16 phase III site assessments were undertaken at the following locations: CAM A, NU; FOX E, NU; Hope Lake (five sites), NU; Padloping Island, NU Bar C, NWT; five sites at Bullmoose/Ruth, NWT (Storm mine, Joon Lake, Beaulieu Mine, Spectrum Lake, Chipp Lake Mine); and two sites at Great Slave Lake, NWT (Blanchet, Outpost). This exceeded our target of four sites per year being assessed.
6.2.2.2 Regulatory approvals secured (Sub-indicator for Giant and Faro Mines)
Regulatory approvals (i.e. environmental assessments, water licences and TB submission approvals) for remediation/risk management activities at Faro and Giant mine sites are needed prior to the start of remediation occurring at these sites. Approvals are not expected until 2012-13 for Giant Mine and 2013-14 for Faro Mine, as a result this indicator will not be reported on until 2012-13.
6.2.3 Plans for priority sites are developed and implemented
Following site assessment and prioritization, the program works to plan and then conduct specific remediation and/or risk management activities for individual sites. Three indicators were developed for this outcome.6.2.3.1 Number of sites under active remediation or risk management
Due to the limited field season and the difficulty mobilizing and demobilizing to each of our sites remediation can take anywhere from a couple of months to a number of years. Typically, these sites take more time to remediate than similar sites south of 60. However, AANDC has made excellent progress towards the remediation of our sites with 17 sites under active remediation in 2010/11. These sites were: Colomac, NWT; Victoria Island, NWT (six sites); Hidden Lake, NWT; Johnson Point, NWT; Tundra, NWT; Jean-Marie River, NWT; Frobisher Gas Wells, NWT; Bear Island, NU; CAM D, NU; Cape Christian, NU; PIN-B, NU; and Roberts Bay, NU. Eleven of the sites listed above were completed and further detail can be found in 7.5.
6.2.3.2 Number of remediation contracts established
The establishment of a remediation contract is normally one of the last steps before active remediation takes place on the ground. There can be a considerable amount of time between when the site undergoes its detailed assessment and when remediation starts. During this time important steps are achieved such as the development of the remediation action plan, applying for and receiving approvals, permits and licenses and the tendering of contracts. In 2010/11 three remediation contracts were established (Tundra Mine, Sawmill Bay, Victoria Island, Bear Island and one for both PIN D and PIN E) achieving our target of three contracts established per year.
6.2.3.3 Number of sites for which further action is required
Once a site undergoes remediation a long term monitoring plan is often developed. These plans typically outline the when, what and where monitoring must take place to ensure that the remediation was successful and any tailings caps or landfills are performing as designed. This target was designed to give AANDC an indication of the long-term success of our program. Last fiscal year no sites needed to be revisited and the target was achieved.
6.2.4 Employment opportunities are created for Northerners and Aboriginals
This immediate outcome reflects the fact that for economic benefits to accrue in the longer term, particular efforts may be required to ensure that northern and Aboriginal communities have the knowledge, capacity and opportunity to participate effectively in program activities and employment opportunities that emerge as a result of those activities.
6.2.4.1 Percentage of Aboriginals and Northerners employed
Direct employment is a key direct measure of the socio-economic benefits provided by the program. This target is measured by the number of people employed for the program and in 2010-11 the NCSP provided 1544 individuals with employment. Of these, 786 were Northerners (51%) and 523 were northern Aboriginals (34%). Figure 5 demonstrates employment on northern contaminated sites through time. The increase in overall employment in 2010/11 is due to the increased activity occurring at our three largest sites, Giant, Colomac and Faro Mines.
Figure 5 – Overall employment for the Northern Contaminated Sites Program
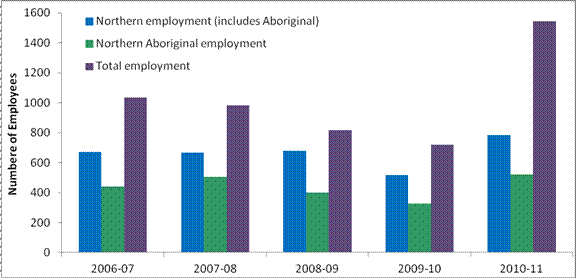
Text description for figure 5 - Overall employment for the Northern Contaminated Sites Program
This image is a bar graphs showing the overall employment for the Northern Contaminated Sites Program between 2006-07 and 2010-11.
The first bar for each fiscal year shows the number of Northern (including Aboriginal) employees directly employed by the program. In 2006-07, 673 Northerners were employed by the program; 667 in 2007-08; 678 in 2008-09; 517 in 2009-10; and 786 in 2010-11.
The second bar for each fiscal year shows the number of Northern Aboriginals directly employed by the program. In 2006-07, 439 Northern Aboriginals were employed by the program; 506 in 2007-08; 402 in 2008-09; 329 in 2009-10; and 523 in 2010-11.
6.2.4.2 Percentage of Women employed
This indicator is currently not being tracked by our contractors; as a result it cannot be reported on in 2010-11. The data will be tracked in upcoming years, and the target of 5% may be refined based on this data. The indicator will be reported on in 2012-13.
6.3 Intermediate Outcome
This long-term outcome is supported by two intermediate outcomes, each of which contributes to its achievement. The anticipated timeline for achieving these outcomes for the program as a whole is 5-10 years, although specific sites will progress towards these outcomes at different paces throughout the life of the logic model.
| Intermediate Outcome | Indicator | Target | Overall Result |
|---|---|---|---|
| 6.3.1 Priority Sites are remediated and/or risk managed | % of Class 1 & 2 Sites not yet addressed | TBD | n/a (Tier II) |
| 6.3.2 Economic Benefits accrue for Northerners and Aboriginals | % of contract value for Northern /Aboriginal suppliers | 60% | 75% Achieved |
6.3.1 Priority sites are remediated and/or risk managed
This outcome refers to completion of all required remediation and/or risk management activities at a given Class 1 or 2 site, recognizing that for larger sites (such as Faro Mine), the emphasis over the next five years will be on remediating or risk managing the highest risks associated with these sites. The indicator of percentage of Class 1 and 2 sites not yet addressed will be reported on in 2013-14 following confirmation of baseline and establishment of the target in 2012-13.
6.3.2 Economic Benefits accrue for Northerners and Aboriginals - % of contract value for northern /Aboriginal suppliers
This outcome reflects the program's desire to ensure that Northerners and Aboriginals are both involved in and benefit from CSP activities and resources throughout the contaminated sites management process. In particular, it seeks to ensure that northern and Aboriginal companies and individuals derive tangible economic benefits, one of which is the total value of program business with northern/Aboriginal suppliers. The program spent $67,217,475 in contracts in 2010-11, with 75% or $50,732,544 going to northern suppliers and 58% or $38,752,230 going to Aboriginal suppliers.
6.4 Ultimate Outcome
Consistent with the program goal articulated in the Contaminated Sites Management Policy, the ultimate outcome of the program is to ensure that human health and environmental risks, as well as associated federal liabilities, are reduced from contaminated sites under program management, while bringing economic benefits to the North to the extent possible.
Accomplishing this goal will help the Department achieve its Strategic Outcome for the North, by contributing to the Program Activity Architecture's Program Activity for Northern Land and Resources, as well as commitments outlined in the departmental Sustainable Development Strategy.
| Ultimate Outcome | Indicator | Target | Overall Result |
|---|---|---|---|
| Human health/environmental risks and associated federal liabilities are reduced while bringing economic benefits to the North | 6.4.1 Liability | Reduction | n/a (Tier II) |
| 6.4.2 Liability (Sub-Indicator) | Reduction | n/a (Tier II) | |
| 6.4.3 # of high and very high risks to the environment | To be confirmed | n/a (Tier II) | |
| 6.4.4 # of Class 1 and 2 sites fully remediated or risk managed | 2 sites / year | 11 Achieved |
6.4.1 Liability
This indicator refers to the total financial liability for the program (including adjustments related to existing sites) with the exception of Faro and Giant Mines. Due to the size and long-term management required for Giant Mine and Faro Mine they will be reported under another indicator. This will enable the program to measure meaningful changes in total liability and progress towards our ultimate outcome. The goal is to reduce overall liability, the target will be refined further in 2012-13 once all assessments are completed and a baseline can be established. Reporting will begin in 2013-14.
6.4.2 Liability (Sub-Indicator)
The Giant and Faro Mines are the two largest contaminated sites in the country and represent a disproportionate amount of the program's financial liability. Even minor annual fluctuations in liability estimates for these sites can overshadow liability reductions achieved in the rest of the program. As such, liability for these sites will be reported separately. Reporting against this indicator will commence once the sites have undergone regulatory approvals and the final remediation option for each has been confirmed and fully designed, as these stages must be complete in order for the baseline to be confirmed. It is currently anticipated that reporting will begin in 2013-14 for the Giant Mine and 2014-15 for the Faro Mine.
6.4.3 Number of high and very high risks to the environment
Risks to the environment are regularly identified and prioritized in site risk registers, which are completed every fall and included in the Detailed Work Plan (DWP) for the site. Measuring trends in this information will provide an accurate indication of the extent to which the program is reducing environmental risks. The completion of risk registers has been ongoing since 2004-05; however, this type of analysis has not been done to date. Program staff will refine this indicator during the course of 2010-11 and will commence reporting in 2011-12.
6.4.4 Number of Class 1 and 2 sites fully remediated or risk managed
Class 1 and 2 sites are those sites representing highest priority for action according to the NCSCS. This represents the best indicator of whether or not the program's long-term outcome is being achieved. Annex A contains all of the sites to date that have been remediated by the Program. In 2010/11 the program remediated 11 sites, the details can be found in Section 7.5:
- Johnson Point, NWT;
- Hidden Lake, NWT;
- Victoria Island Sites (six sites in total), NWT;
- PIN-B, Nunavut;
- Cape Christian, Nunavut; and
- Roberts Bay, Nunavut.
7.0 Major Accomplishments in 2010-11
7.1 Giant Mine, NWT
Giant Mine covers 949 hectares within the city limits of the City of Yellowknife, NWT. The site lies along the western shore of Yellowknife Bay, an arm of Great Slave Lake. This gold mine operated nearly continuously from 1948 until its closure in July 1999. This operation left 237,000 tonnes of arsenic trioxide stored underground, as well as various buildings and surface areas contaminated with arsenic.
A remediation plan for the site was completed following extensive site characterization and community consultations. The plan has now entered the environmental assessment process. The remediation plan focuses on the mimicking of permafrost conditions and creating frozen chambers underground to prevent water from entering the chambers and mixing with the arsenic trioxide.
A Freeze Optimization Study (FOS) has been initiated and funded in part by Canada's Economic Action Plan (CEAP). The FOS focuses on optimizing the freezing to improve in the final design of the remediation project. The FOS began freezing one underground chamber in order to identify technical and process efficiencies in advance of freezing the remaining chambers. Construction activities for the FOS were completed in March 2011. The operation phase of the study is ongoing and a final report is expected to be completed in March 2012.
Even thought the FOS is now operational, research and trials need to continue in order to establish the most effective and efficient process that will be used for freezing each of the underground arsenic chambers. This research will involve an extensive number of trials on the test chamber including flooding, freezing and thawing. The trials will also include the final steps required to effectively cap and freeze the chambers. The conclusion of the next phase of the FOS will result in one frozen arsenic chamber and the results of the work will inform the approach that will be used for freezing the remaining chambers.
7.2 Faro Mine, Yukon
Located in the south-central Yukon close to the Town of Faro, the Faro Mine was an open-pit lead-zinc mine from 1969 until it went into interim receivership in 1998. The site covers approximately 2500 hectares and includes 70 million tonnes of tailings and 320 million tonnes of waste rock. Both the tailings and waste rock contain high levels of heavy metals that could leach into the environment in the absence of remediation. As such, there are significant long-term environmental risks associated with the site. A care and maintenance regime, including collection and treatment of contaminated water and general maintenance and site security, is currently in place.
The Faro Mine is one of seven Type II sites identified under the 2003 Canada – Yukon Northern Affairs Program Devolution Transfer Agreement. As such, the Governments of Canada and the Government of Yukon, along with the Ross River Dena Council (on behalf of the Kaska Dena Council) and Selkirk First Nation have worked cooperatively through a joint Oversight Committee to develop a site closure and remediation plan. Development of this plan was led by a multi-disciplinary team of engineers, scientists and First Nations, and informed by hundreds of technical studies, as well as consultations with community members of affected First Nations and the Town of Faro. An Independent Peer Review Panel also performed a comprehensive review of remediation options. The project reached a major milestone in early 2009 when the closure plan was confirmed by the Oversight Committee. In 2010-11 a completed draft of the concept level remediation plan was developed. This will further the permitting and Environmental Assessment process and render the site one step closer to remediation.
The plan emphasizes stabilizing contaminants, rather than removing them from the site. Key features include upgrading dams to ensure tailings stay in place, re-sloping waste rock, installing engineered soil covers over tailings and waste rock, upgrading stream diversions, and installing state-of-the-art water collection and treatment systems.
7.3 Major Projects Procedures
Within the NCSP not all projects have the same level of complexity. As a result, it was recognized that major projects (such as Giant and Faro Mines) require a more robust governance structure. Major projects require significant investment of human and financial resources. Overlapping complexities across multiple regulatory regimes, jurisdictions and land claims pose challenges. Providing oversight and ensuring appropriate communication across multiple functional areas with distinct project managers, schedules and procurement strategies is essential. Industry has also learned from experience that projects greater than $500 million have their own unique requirements which must be taken into consideration if they are to be delivered successfully.
As such, in 2010-2011 NCSP established a Major Projects Office (MPO) and developed draft Standards and Guidelines for use by major projects such as Giant and Faro. Steps are being taken to control and reduce the degree of uncertainty through risk management, contingency management and planned stage-gated reviews throughout the life-cycle of major projects. MPO is providing expertise and support to these and other projects to ensure they are prepared to meet NCSP-MPO Standards. As well, MPO is committed to ensuring Projects' compliance with Standards.7.4 Marwell Tar Pit, Yukon
The Marwell Tar Pit, located within the city limits of Whitehorse, Yukon operated as a petroleum refinery, built on behalf of the United States Corps of Engineers, to process crude oil extract from Norman Wells, Northwest Territories. The refinery operated between 1944 and 1945 after which it was subsequently closed and dismantled. Waste products from the refinery operations were deposited in what is currently referred to as the Marwell Tar Pit. These activities were directly related to Canada's national security efforts in its role in supporting the Allied Forces during World War II. The site is contaminated predominantly with petroleum hydrocarbons and is considered a Class 1 site.
In Budget 2004, the government set aside $500 million to cost share the remediation of certain contaminated sites on non-federal lands for which the federal government may share some responsibility. Between 2007 and 2010 the Government of Yukon and Government of Canada negotiated a cost-share agreement which was approved by the Treasury Board in June 2010. Remediation work on the site is expected to last until 2015 and cost approximately $6.3 million dollars.
7.5 Remediation Projects Completed
This past year the program made significant progress in the remediation of contaminated sites, with 11 sites being remediated. A detailed explanation of each of the remediation projects is found below.
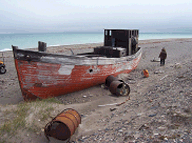
7.5.1 Johnson Point, Northwest Territories

Johnson Point is an abandoned oil and gas exploration support and staging area located on Banks Island, NWT. The site was used from the early 1960s until the early 1980s, when responsibility reverted to the Crown. Assessment work started on the site in 2006-07 with remediation activities being undertaken in 2009-10. The contractor was able to successfully treat approximately 23,000 cubic meters of hydrocarbon-impacted soils, consolidate debris, and dismantle remaining tanks and buildings at the site. In addition, all non-hazardous materials have been removed, all landfills have been capped, and all surface contaminated soil has been treated. The remaining containerized hazardous materials were barged out, inspection of the stability of completed earthworks was completed in the summer of 2010.
As a result, most of the health and safety risks associated with the site have been addressed. Ongoing monitoring activities will determine if any risks remain or emerge over time. In total $13.6 million dollars were spent on this project.
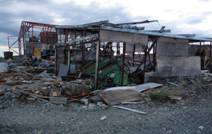
7.5.2 Hidden Lake, Northwest Territories
Exploration of the site began in the 1930s, and mining began in 1940 with the discovery of a small high grade gold deposit. Milling operations ceased in 1968 and since then, there has been very limited activity at the mine. The site contains two abandoned mine shafts and was contaminated with hydrocarbons, asbestos, and waste material is scattered around the site.
Assessment activities started in 2005/06 and remediation was completed this fiscal year. Remediation activities include: collection and containerization of scrap metal and debris, wood debris, asbestos containing material, batteries, tailings, petroleum impacted soils as well as backfilling of the west shaft and the construction of a concrete cap on the east shaft. All materials have been containerized and were removed from the site during demobilization in February 2011. In total $2.1 million dollars was spent on this project.
7.5.3 Victoria Island Group, Northwest Territories
The Victoria Island Group represents six sites, which have been grouped together based on proximity to each other and similar contaminant/waste type. Each site contained a variety of abandoned buildings, tents, drums (some containing product and others empty), garbage and minor ground staining.
Detailed assessment work started in 2009, with remediation taking place in 2010-11. This site was contaminated mainly with hydrocarbons, asbestos, lead-based paint and physical hazards. In total $2.4 million has been spent on this project.
7.5.4 PIN B - Clifton Point, Nunavut
This site is a former Intermediate DEW Line site on Clifton Point, located in Nunavut. PIN B - Clifton Point was reserved by the Department of National Defense (DND) in 1956, constructed in 1957 and abandoned in 1963. In 1965, responsibility for the site reverted to AANDC. The PIN-B station was comprised of a five-module building train, a warehouse, a garage, a small house for Inuit staff, a petroleum, oil and lubricants (POL) storage facility with associated distribution system, and a felled radar tower. In addition to the Station facilities, a cargo beaching area was constructed at the beach area. A second POL storage facility was located at the beach, in the vicinity of the cargo beach area and two airstrips were constructed at the site.
The initial assessment took place in 1985. At that time PCBs and petroleum, oil and lubricants were removed from site but material still remained. Remediation focused on the PCB, lead, hydrocarbons and asbestos contamination on site, as well as the buildings, fallen radar tower and other debris on the site. AANDC's work started in 2007 and the remediation was completed this fiscal year. In total AANDC spent $11 million on the remediation of the site.
7.5.5 Cape Christian, Nunavut

The Cape Christian site is located near the mouth of the River Clyde, on the northeast coast of Baffin Island, in the Territory of Nunavut. From 1954 to 1974, the United States Coast Guard operated a Long Range Navigation (LORAN) communications station at the site. The station comprised of five (5) buildings; six (6) Aboveground Storage Tanks were also installed at the site for fuel storage. Several oil barrels were also supplied to the station during its years of operation. The barrels, following the use of oils in them, were buried at the site. The station was abandoned in 1974.
Environmental and health and safety issues were identified at the site. These include hazardous materials, lead acid batteries, compressed gas cylinders, asbestos, and building materials painted with polychlorinated biphenyls (PCBs) amended paints, soils contaminated with metals, soils contaminated with petroleum hydrocarbons, and soils contaminated with PCB's. Detailed assessment was started in 2006 and site remediation started on the site in 2009 and was completed in 2010. In total $12.2 million was spent on the site.
7.5.6 Roberts Bay, Nunavut
The Roberts Bay and Ida Bay Silver Mine sites are located approximately 115 kilometers southwest of Cambridge Bay on the north coast of mainland Nunavut. The two sites are collectively referred to as the Roberts Lake Area. The silver deposit at Roberts Bay was discovered in 1965. Further explorations of the Roberts Lake Area were conducted from 1967 until 1972. Mining started in 1973 the area yielded over 84,500 ounces of high-grade silver until operations ceased in 1975. Further exploration continued at the leases throughout the 1980s and 1990s.
The Roberts Bay and Ida Bay mine site contained residual infrastructure; tailings pond; waste rock; abandoned equipment/non-hazardous waste/debris; hazardous waste; petroleum and metals impacted soil, three mine openings, a capped vent raise, a partially covered vent raise, three waste rock piles and three exploration trenches. Both the adit and the shaft were closed during the remediation work at Roberts Bay. The non-hazardous debris, hazardous materials, including petroleum products, batteries, propane tanks, and petroleum hydrocarbon contaminated soils were identified at the site. A detailed site assessment was conducted in 2005 and the remediation was completed this year. In total AANDC spent $10.3 million dollars on the site.
Annex A – AANDC Contaminated Sites Remediated
Pre 2006 – 2007
- PIN A – Pearce Point, NWT
- BAR E – Horton River, NWT
- Kittigazuit, NWT
- Rayrock, NWT
- Iqaluit Upper Base, Nunavut
- North Rankin Inlet, Nunavut
2006–2007
- Resolution Island, Nunavut
2007-2008
- Axe Point, NWT
- Radio Island, Nunavut
2008 -2009
- BAR D – Atkinson Point, NWT
- Port Radium, NWT
- Discovery, NWT
- CAM F – Sarcpa Lake, Nunavut
- FOX C – Ekalugad Fiord, Nunavut
2009-2010
- North Inca, NWT
2010-2011
- Johnson Point, NWT
- Hidden Lake, NWT
- Victoria Island (six sites), NWT
- PIN B – Clifton Point, Nunavut
- Cape Christian , Nunavut
- Robert's Bay, Nunavut